Molecular Physiology and Pathology of the Retina
Stephen H. Tsang
Peter Gouras
We have made great progress over the past decade in understanding both the mechanism of phototransduction and the neurocircuitry of the retina. Molecular biology and genetics are revolutionizing the way we study, diagnose, and eventually treat retinal disease by providing important insights into retinal physiology and pathophysiology.
FUNCTION OF THE RETINA
The retina performs two major functions: it transduces light into neural signals, and it transmits these signals in a language usable by our visual brain. Patterns of light and darkness on the photoreceptor mosaic are transformed by retinal circuits that lead to repetitive discharges from a two-dimensional array of ganglion cells. There is no feedback from our brain to the retina, making these ganglion cell responses stereotypical, depending only on the retinal image and their presynaptic circuitry.
PHOTOTRANSDUCTION OF RODS
ACTIVATION
Since 97% of the photoreceptors in cows and frogs consist of rods, research on the physiology and biochemistry of rods has been more approachable technically than has research on cones. With the advent of molecular cloning, however, the phototransduction components of cones are being isolated as well. In rods, phototransduction1,2 starts with the absorption of light by rhodopsin, a seven-loop transmembrane G-protein-coupled receptor containing an 11-cis chromophore covalently linked to a lysine side chain by a protonated Schiff base (Fig. 1). Isomerization by light of the 11-cis retinal to the all-trans retinal form leads to conformational changes in the opsin, producing the activated form metarhodopsin II. Each metarhodopsin II molecule activates hundreds of transducins (heterotrimeric G-proteins [Tαβγ]),3 to exchange guanosine diphosphate (GDP) for guanosine triphosphate (GTP) (Fig. 2). The transducin (Tα)-GTP molecule dissociates from Tβγ and binds to the inhibitory γ-subunits of a cGMP-phosphodiesterase (PDE; a heterotetrameric protein),4,5 thus removing the inhibition that the two γ-subunits exert on the catalytic α- and β-subunits of PDE.3,4,5,6,7
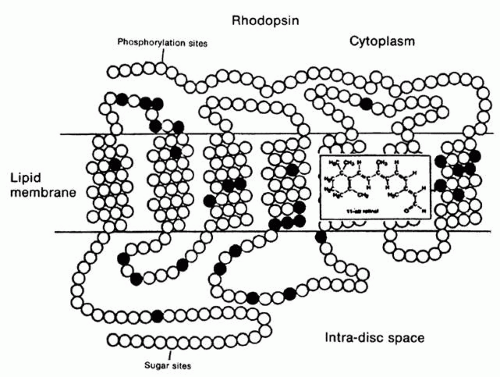 Fig. 1. A schematic view of the rhodopsin molecule with each of its amino acids designated as a small circle; the filled circles indicate amino acids that are identical in different species (i.e., conserved by evolution). The seven segments that are hydrophobic and incorporated into the lipid membranes of the rod discs are also evident, as are the cytoplasmic and intradiscal ends of the molecule. The 11-cis retinal group and its binding to a lysine in the membrane segment of the molecule is also included. |
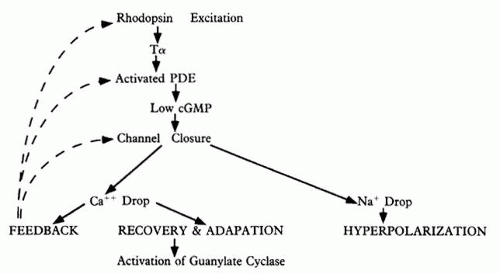 Fig. 2. A flow chart of the phototransduction cascade in which quantal excitation of rhodopsin leads to activation of the phosphodiesterase (PDE), decreasing cyclic guanosine monophosphate (cGMP) levels, closing of Na+ /Ca+ + channels, and hyperpolarization of the rod. Darkness causes the opposite changes, driven by the feedback inactivation mechanism. |
It is debatable whether Tα actually binds and removes PDEγ subunits from PDEαβ(γ)27 or whether it binds and remains associated with PDEαβ as a complex.6,8 In frog photoreceptors, Tα activation of PDE results in release of PDEγ from the membrane-bound PDE. In bovine photoreceptors, however, PDEγ remains bound to PDEαβ upon Tα activation.9 The resulting activation of PDEαβ is profound: light-activated PDE is nearly 300 times more active than PDE in the basal level.10 Hydrolysis of cGMP by activated PDE lowers the levels of this cyclic nucleotide,11 which leads to closure of cGMP-gated Na+ /Ca+ + channels on the plasma membrane of the outer segment (see Fig. 2; Fig. 3). This reduces the entry of Na+ and Ca+ + into the cytoplasm, causing the entire rod to hyperpolarize, and thus curtails the release of the rod’s transmitter, glutamate, at its synaptic terminal; intracytoplasmic reduction of Ca+ + also reduces transmitter release.
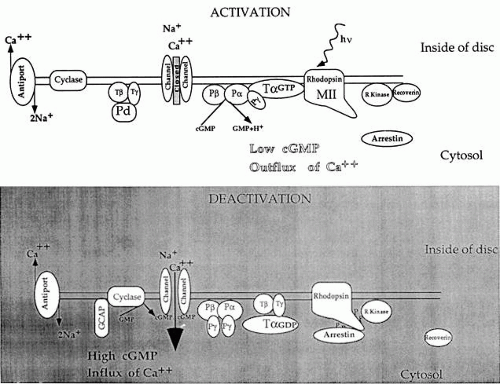 Fig. 3. The phototransduction cascade that results from activation of rhodopsin, subsequent formation of activated Tα, and activation of phosphodiesterase (PDE), which reduces the cGMP in the rod cytoplasm and closes Na+ /Ca+ + channels on the outer plasma membrane of the rod. Cyclase = guanylate cyclase; GCAP = guanylate cyclase-activating protein; P = PDE; Pd = phosducin; R kinase = rhodopsin kinase; T = transducin. |
DEACTIVATION
The termination of the photoresponse requires inactivation of the photoexcited rhodopsin and transducin subunit, Tα, as well as reassociation of PDEγ to the PDEαβ catalytic core; it also involves activation of a guanylate cyclase to synthesize more cGMP. Tα possesses intrinsic GTPase activity for its own inactivation, which is accelerated upon binding to PDE.10 Photoactivated rhodopsin is inactivated by phosphorylation of serine and threonine residues at its carboxyl tail by a rhodopsin-specific kinase. Phosphorylated rhodopsin binds arrestin (also known as S-antigen) more efficiently than Tα. Arrestin inhibits the removal of phosphates from rhodopsin by a phosphatase 2A.12 Thus the amount of active (dephosphorylated) rhodopsin available to activate Tα is diminished. In minutes, rhodopsin is regenerated by the replacement with 11-cis retinal, released from arrestin, and dephosphorylated by phosphatase 2A (see Fig. 3).
ADAPTATION
The light-induced drop in Ca+ + influx also leads to adaptation of the photoreceptor to constant light.13 Intracellular Ca+ + inhibits the guanylate cyclases Ret GC-1 and Ret GC-2.14,15 When Ca+ + is reduced, these two enzymes are stimulated to form more cGMP, thus counteracting the reduction in cGMP by the photoresponse (see Fig. 2). In low Ca+ + concentrations, Ret GC-1 and Ret GC-2 are also stimulated by guanylate cyclase-activating proteins (GCAP-1/p20 and GCAP-2/p24) that possess Ca+ + binding sites. Ca+ + also appears to influence the half-life of photoexcited rhodopsin16 as well as its catalytic action. The rate of rhodopsin phosphorylation is inversely proportional to Ca+ + concentration; this Ca+ + sensitivity of rhodopsin kinase phosphorylation is mediated by recoverin. Prolonged light induces a decrease in cytoplasmic Ca+ + concentration as well as a cessation in recoverin inhibition of rhodopsin kinase. In both cases, the light-induced decrease in intracellular Ca+ + concentration leads to a desensitization and speeding up of the response. In addition, Ca+ + influences the cGMP-gated Na+ /Ca+ + channels, which provide the ionic current of the photoresponse.17 The cGMP-gated Na+ /Ca+ + channel is composed of a functional α-subunit and a structurally similar β-subunit. At high levels of Ca+ +, the β-subunit binds to calmodulin, which then increases the channel affinity for cGMP.
Ca+ + may also affect photoreceptor inactivation and recovery through the regulation of Ca+ + -sensitive members of the protein kinase C family, which can phosphorylate rhodopsin, Tα, Tβ, arrestin, and PDEγ. Phosphorylation of PDEγ occurs at threonine 35, and this enhances the inhibitory action of PDE on the catalytic PDEαβ-subunit. When PDEγ remains attached to PDEαβ, the threonine 35 site appears to be less accessible to phosphorylation because free PDEγ is a better substrate for the kinase when separated from PDEαβ(γ)2.18 When light activates the transduction cascade PDEγ complexed with Tα-GTP can dissociate from the catalytic PDEαβ-subunits; after GTP hydrolysis, free PDEγ becomes phosphorylated. The binding of phosphorylated PDEγ to reform the tetrameric PDE holoprotein then results in greater inhibition of the catalytic action. Therefore, light adaptation increases the free pool of PDEγ and consequently the phosphorylated subspecies that can exert greater inhibition of the PDE enzyme.
PHOTOTRANSDUCTION OF CONES
Qualitatively, cone phototransduction is similar to that of rods; however, cones do differ in a number of ways, the most significant of which is their ability to adapt to the brightest ambient lights (e.g., midday sunlight). The rod system is much more sensitive than that of the cones, but rods are virtually incapable of adapting: they saturate at light levels where cones are just beginning to function well.
Light adaptation decreases a photoreceptor’s sensitivity, which can be an advantage when there is a plethora of photons, but it also speeds up and increases the temporal accuracy of the photoresponse, which is even more of an advantage. Sensitivity and response speed are inversely coupled in the light-adapting retina, and this is especially apparent for cone vision. The most logical explanation for this behavior is negative feedback exerted biochemically in the cone’s photoresponse and neurally by horizontal cell feedback inhibition.
Several phenomena play a more physical role in light adaptation, influencing sensitivity but not response speed. For example, increasing light levels bleach away photopigments in the photoreceptors, making the latter insensitive. There is also decreased sensitivity in the detection of an additional signal in the presence of an increasing level of background light (“noise”). Negative feedback, however, begins only in the biochemistry of the photoresponse. If the speed at which the light-activated molecules (opsins, transducins, PDEs) of the phototransduction cascade are inactivated is progressively increased with stronger ambient lights, then the time scale and temporal accuracy of the photoresponse would increase correspondingly. This is undoubtedly what happens in the cone photoresponse (see Fig. 2). Molecular cloning of cone transduction components shows that cone op sins,19 transducins,20,21 PDEα,22 PDEγ,23 and arrestin are similar to the rod homologues.
NEUROCIRCUITRY OF THE RETINA
The retina consists of a combination of several quasi-independent retinas: (1) a rod retina, which participates neither in high resolution nor in color vision; (2) an S-cone retina, which does not participate in high resolution, but does participate in color vision; and (3) the dominant L-M cone retina, which participates in both high resolution and color vision.
THE ROD SYSTEM
Although the rods outnumber the cones about 20 fold, they are almost vestigial, being seldom used effectively by members of modern society because of artificial illumination. Defects in the rod system are important to detect, however, because they often herald the subsequent or concomitant destruction of cones, which leads to blindness.
The rods transmit their signals to a homogeneous population of rod bipolars called on-bipolars; that is, they are depolarized whenever the rods are hyperpolarized by light (Fig. 4). The rod bipolars synapse on a rod-amacrine interneuron, which subsequently transmits the rod signals to ganglion cells. The ganglion cells are the only retinal structures that rods share directly with cones. The rod system is kept independent of the cones because its signals tend to be out of phase in both space and time with those of cones. It is therefore possible for a person to have major defects in the rod system without there being any significant effects on cone vision (e.g., stationary nyctalopias). Defects that cause rods to degenerate, however, do result in subsequent degeneration of cones.
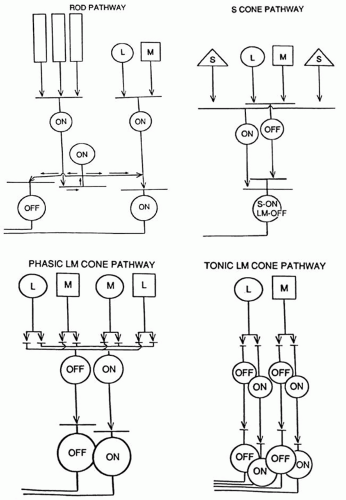 Fig. 4. Schematic diagram of the rod system’s circuitry (upper left). Rods (vertical rectangles) transmit their signals through rod on-bipolars to the unique rod amacrine cells, which transmit these signals to on- and off-ganglion cells. The S-cone system’s circuitry (upper right). S-cones (S) transmit their signals through an S-cone on-bipolar to excite ganglion cells when S-cones absorb light; the same ganglion cells receive input from LM cone off-bipolars, which excite the same ganglion cells when LM cones have a decrease in light absorption. The phasic LM cone system’s circuitry (lower left). LM cones transmit signals to separate LM cone on- and off-bipolars, which in turn transmit them to separate large on- and off-ganglion cells; specific amacrine cell interneurons are probably responsible for making these responses phasic. The tonic LM cone system’s circuitry (lower right). LM cones transmit signals to “midget” cone on- and off-bipolars, which transmit them in turn to separate systems of midget on- and off-ganglion cells. |
THE S-CONE SYSTEM
Like the rods, the S-cones may also have only one system of on-bipolars, although this has not been firmly established.24 The S-cone on-bipolars transmit their signals to a unique bistratified ganglion cell,25 which receives excitatory signals from S-cone on-bipolars on its inner dendritic tree and excitatory signals from L-M cone off-bipolars on its outer dendritic tree (see Fig. 4). Short wavelength light (blue, violet, white, or a combination) excites this ganglion cell; minus short wavelength lights (yellow, red, green) excite this ganglion cell when these lights are turned off.
THE L-M CONE SYSTEM
The L-M cones are the most important photoreceptor system, undoubtedly reflecting the earliest evolution of cones, which were probably yellow-green-sensitive cones from which rods and S-cones later evolved. Later in evolution the primeval yellow cones are believed to have split into L and M cones in primates to allow trivariant color vision. The L-M cone system has two distinctly different sets of ganglion cell outputs26: the midget (tonic) system and the larger phasic system (see Fig. 4). Both systems have their own system of on- and off-bipolar cells. The midget system, discovered by Polyak, has a one bipolar to one ganglion cell connection to single foveal cones. The midget system mediates the high spatial resolution of the fovea and also participates in trivariant color vision. The phasic system is a fast, alerting system with poorer spatial resolution and a lack of response to color contrast. It is thought to play a role in luminance and movement detection, perhaps global more than local movement.
HORIZONTAL AND AMACRINE CELLS
The horizontal and amacrine cells tend to be specific for the separate subretinal systems. The horizontal cells provide negative feedback on to the cones. These cells release gamma-aminobutyric acid (GABA), an inhibitory transmitter that hyperpolarizes cones in the dark (i.e., when cones are normally depolarized). With light stimulation, the cones inhibit the horizontal cell, thereby stopping the release of GABA back on themselves. This depolarizes the cones, which counteracts the hyperpolarization of light (negative feedback). This tends to increase spatial and temporal resolution.
The amacrine cells also appear to be coupled to specific bipolar and ganglion cell systems, also providing antagonistic interaction at the inner plexiform layer. The rod amacrine cell is a unique interneuron that brings rod signals into the common ganglion cell stream.
ELECTROPHYSIOLOGIC TESTS
flash electroretinogram.Information about retinal function can be obtained objectively by a number of electrophysiologic techniques, but the flash electroretinogram (ERG) is the oldest and most frequently used (Fig. 5). It reveals a corneal negative a-wave and a positive b-wave, the latter containing oscillations on its rising phase after strong stimulation. The a-wave provides insights into the outer nuclear layer (i.e., photoreceptor function), but it also appears to reflect some signals from bipolar and possibly amacrine cells. The b-wave provides information about the inner nuclear layer, especially bipolar cells. Once the appropriate stimulus conditions are chosen, the flash ERG can selectively examine each of the subretinal systems (rods, S-cones, and L-M cones) (Fig. 6). The flash ERG obtains a distinct signal from each subretinal system:
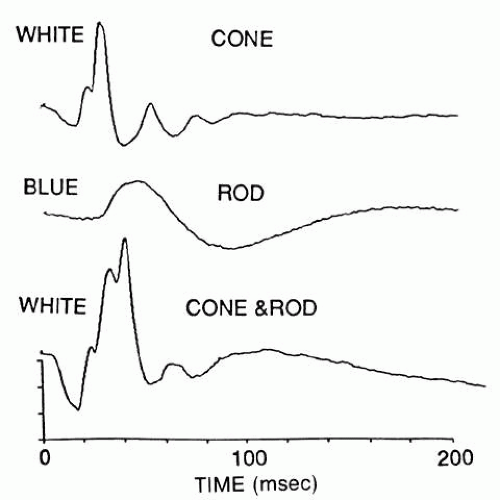 Fig. 5. The flash electroretinogram, showing a cone response (top) obtained with a ganzfeld white flash on a strong white adapting field, which saturates the rod response; a rod response (middle) obtained with a dim blue light in the absence of any adapting field; and a mixed cone and rod response (bottom) obtained with the same white flash used, above, but in the absence of any adapting field. The ordinate indicates 10 microvolts/division. |
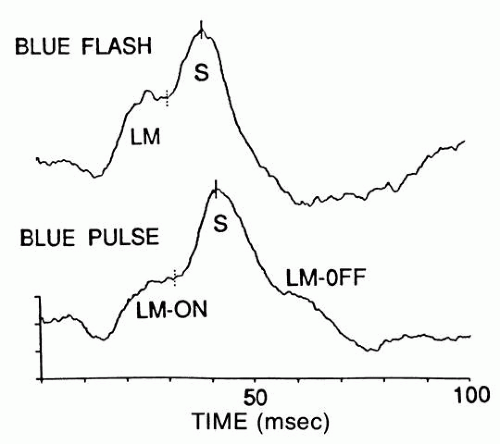 Fig. 6. S-cone electroretinogram (ERG) obtained with a blue flash (top) and a quasi-blue pulse (bottom); the pulse is a high-frequency (100-Hz) train of five flashes. These responses are obtained in the presence of a strong white adapting field. The blue light also elicits a quicker LM cone response. The pulse splits the LM cone response into an on-response to the start of the pulse and an off-response to the cessation of the pulse. The S-cone ERG does not split in this way. The ordinate scale indicates 1-microvolt values. |
Rod signals are obtained in virtual isolation by giving dim blue flashes to the dark-adapted retina (see Fig. 5). S-cone signals are obtained by giving strong, blue flashes to the light-adapted retina (see Fig. 6); many of these stimuli must be computer-averaged to detect the relatively faint signals of the S-cone response.
L-M cone signals are obtained by giving yellow flashes to the light-adapted retina; these signals are so large compared with those of the S-cones that a white flash also elicits mainly an L-M cone response. A less informative way to isolate the L-M cone ERG is to flicker the stimulus above the fusion frequency of rods.
PULSE ELECTRORETINOGRAM.
By using stimuli of longer duration than a flash, one can detect corneal positive off-responses,27 which reflect both the turn-off of the L-M cone receptor response and the excitation of cone off-bipolars.
THE SCOTOPIC THRESHOLD RESPONSE.
By exposing dim flashes to the dark-adapted retina, one can detect a negative wave that appears to reflect amacrine or other inner nuclear layer activity.28 There is evidence that the scotopic threshold response is reduced in glaucoma.
FOCAL ELECTRORETINOGRAM.
Several new methods are being used to obtain ERGs from local retinal areas, especially the fovea.29,30 One of the most innovative methods uses the simultaneous presentation of random focal stimuli combined with cross-correlation to extract each focal response.31 This greatly shortens the time it usually takes to obtain a record of local retinal function.
PATTERN ELECTRORETINOGRAM.
In pattern ERG, the retinal response is generated by a shift in a light/dark pattern, which causes no net change in retinal flux. This reduces the flash ERG enormously and exposes responses to spatial contrast. This response may reflect in part the retinal ganglion cell layer.
ELECTRO-OCULOGRAM.
The response to light by the electro-oculogram (EOG) depends on changes induced in the retinal pigment epithelium (RPE) mainly by photoreceptor activity. It requires the subject to track a small light spot while the patient’s ocular saccades “chop” the standing potential of the RPE layer across skin electrodes on either side of the eye. The test takes about 1 hour to perform and is in general superseded by the more rapid and usually even more informative flash ERG. A defect in the EOG in the presence of a normal ERG may be pathognomonic of diseases such as vitelliform macular degeneration, pattern retinal dystrophy, and autosomal-dominant vitreoretinal choroidopathy.
EARLY RECEPTOR RESPONSE.
This response depends on charge displacement of opsin molecules in the outer segment; it requires an extremely bright flash because it precedes the phototransduction cascade and is therefore not amplified, as is the ERG. It is seldom used because it is prone to artifacts, and equivalent information can usually be obtained by the flash ERG.
MODEL OF PHOTORESPONSE.
A mathematic model based on the physical and biochemical parameters of rods and the biochemistry of the transduction cascade provides a quantitative description of the electrical response of rods,32 which can be monitored by the early phase of the ERG a-wave. Several attempts have been made to use this approach to study genetically defined retinal degenerations.33,34 The complexity of the degenerative process, however, impedes easy extrapolations.
ACQUIRED RETINAL DYSTROPHIES
CANCER-ASSOCIATED RETINOPATHY
Recently, Thirkill35 described a syndrome of cancer-associated retinopathy (CAR syndrome), which appears to be due to the formation of autoantibodies induced by the tumor. Recoverin was found to be expressed in the lung tumor of a patient with CAR syndrome, but not in tumors derived from subjects who did not have the syndrome.36 Unauthorized synthesis of recoverin outside the retina may lead to generation of autoantibodies against recoverin in the immune system. The impact on each of the subretinal systems is characterized by striking reductions or changes in the ERG:
Rod/Cone: Retinopathy of both the rods and cones was described first; both rods and cones appear to be directly affected because all components of the ERG are lost. This relatively sudden loss of vision in association with a concomitant cancer is strong evidence for CAR syndrome. In some cases, circulating retinal autoantibodies have been identified.35
Rod: A more specific rod-selective retinopathy has been associated with cutaneous melanomas (melanoma-associated retinopathy).37,38 The insult appears to involve mainly the rod b-wave, indicating that it affects the rod bipolars rather than the rods directly; this hypothesis is supported by immunohistochemistry.38
Cone: A CAR that eliminates the cones but preserves rod function as evidenced by the ERG has been reported by three independent groups.39
Because there is great genetic and allelic heterogeneity in retinal dystrophies, classifications based on age of onset as well as on psychophysical and electrophysiologic studies have generated some ambiguity. Genetic heterogeneity is defined as different genetic mechanisms producing the identical (or similar) clinical presentation. An example of this is retinitis pigmentosa, which can be caused by mutant phototransduction enzymes (e.g., rhodopsin, PDEβ-subunit) or alternatively by a mutant rod outer segment membrane protein (e.g., RDS/peripherin). Conversely, allelic heterogeneity is defined as different mutant alleles at the same locus producing different phenotypes. For example, different defects in the PDEβ-subunit gene can lead to either retinitis pigmentosa or congenital stationary night blindness. Therefore, the most precise classification will be based on molecular genetic defects. In the future, genetic tests should be used to complement clinical diagnosis.
RETINITIS PIGMENTOSA
Retinitis pigmentosa is a term applied to a group of heterogeneous genetic diseases that feature retinal degeneration. This disease is the most common form of inherited blindness,42 affecting 1 in 3000 persons worldwide.43 Retinitis pigmentosa affects approximately 1.5 million persons in the world44 and between 50,000 and 100,000 persons in the United States alone.45 Retinitis pigmentosa has autosomal-dominant, autosomal-recessive, X-linked, and mitochondrial inheritance patterns.46 In a study conducted in Maine, the frequency of these inheritance patterns is as follows: 19% autosomal dominant, 19% autosomal recessive, 8% X-linked, 46% isolated cases, 8% undetermined, and less than 0.5% mitochondrial.47 The majority of isolated cases probably involve autosomal-recessive inheritance.
At the onset of retinitis pigmentosa, patients present with night blindness due to progressive loss of rod photoreceptor cells. Subsequently, tunnel vision and eventual loss of sight develops as the cones degenerate as well. Light-evoked responses, generated by the massed electrical activity of the retina and detected on ERG, are abnormal in affected persons before the onset of symptoms.48,49 A loss of rod ERG function in persons with intact photoreceptors is found in families with congenital stationary nyctalopia (night blindness); however, normal full-field ERG functions with loss of foveal function are found in hereditary macular dystrophies.
GENETIC APPROACHES TO RETINAL DISEASES
Genetic analyses of rare inherited disorders have shed light into identifying the molecular mechanisms governing retinal function in health and disease. Many initial studies of mammalian genetics have been conducted on the visual system. In 1911, Wilson49a of Columbia University mapped the color-blind locus to the human X-chromosome. This represents the first gene ever mapped. Principles of mammalian genetic linkage were first established based on analysis of the mouse pink-eye dilute and albino loci by Haldane in50 Retinal genetics has been rediscovered recently with the arrival of molecular tools (Fig. 7).
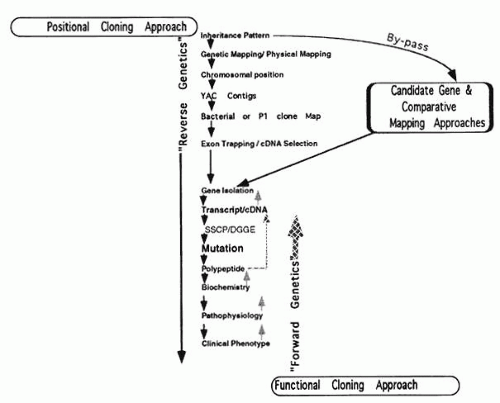 Fig. 7. Different approaches used to define the molecular basis of retinal genetic diseases. The traditional functional cloning approach requires an understanding of the biochemical basis of the disease before cloning of the relevant gene. The positional cloning approach makes no assumption as to the pathologic basis of the disease and systemically isolates the defective gene from its chromosomal location. The positional cloning approach is laborious, but it can be facilitated by a candidate gene at the chromosomal location. DGGE = denaturing gradient gel electrophoresis (also detects mutations); P1 = bacterial phage cloning vector; SSCP = single-strand conformation polymorphism (detects mutations); YAC = yeast artificial chromosome. |
POSITIONAL CLONING
Because of the rapid progress in molecular genetic approaches to studying retinal dystrophies, reviews become rapidly outdated. Therefore, we attempt to illustrate some principles of mammalian genetics by studies of specific retinal dystrophies. Knowledge of the chromosomal location of many mutant loci, combined with recombinant DNA technology, has made it possible to elucidate the primary defects of many retinal diseases. Both developments have made it easier to approach the pathophysiology of these defects through a strategy that has become known as “reverse genetics”; the preferred term is now positional cloning. The general scheme of positional cloning is a follows:
Genetic mapping using family linkage analysis
Establishing a physical map of the locus with yeast artificial chromosomes (YACs), bacterial artificial chromosomes (BACs), or P1 phage and cosmids
Isolation of cDNA from YAC or P1 phage by exon trapping or cDNA selection
Screening candidate cDNA for mutations (see Fig. 7).
Presently, retinal dystrophic genes cloned only by positional strategies include those associated with choroideremia and Norrie’s disease (Table 1).41,51,52 This approach is labor intensive, particularly in the identification of disease-causing genes from the genomic fragment. Each YAC clone could contain as many as 20 genes, and each of these genes would have to be individually examined as a possible candidate for a given disease.
TABLE 1. Genetic Analysis of Human Retinal Diseases | |||||||||||||||||||||||||||||||||||||||||||
|---|---|---|---|---|---|---|---|---|---|---|---|---|---|---|---|---|---|---|---|---|---|---|---|---|---|---|---|---|---|---|---|---|---|---|---|---|---|---|---|---|---|---|---|
| |||||||||||||||||||||||||||||||||||||||||||
CANDIDATE GENES
Another strategy is the candidate gene approach (also known as “position-a-clone approach”) which has been used with great success in retinitis pigmentosa (see Table 1). This involves the co-localization on a chromosomal map of a disease phenotype and a gene for a protein thought to be involved in retinal pathophysiology. This approach allows the testing of hypotheses to examine the cause of a genetic disorder based on a previously described clinical or cellular phenotype. The increasing number of cloned genes in the phototransduction cycle (e.g., rhodopsin, PDE, arrestin) (see Fig. 3) favors a candidate gene approach: a patient and his or her family members can be studied for genetic linkage to the candidate gene(s), or the genes can be sequenced directly from the patient’s DNA.
COMPARATIVE MAPPING
This approach takes advantages of the synteny between human and mouse chromosomes (i.e., evolutionary conservation of the gene order across species). Genes associated with a mutant phenotype in mice become candidate genes for the human disorder that maps to the syntenic genomic region.
PRECAUTIONS
Both the positional cloning and the candidate gene approaches require sequencing the candidate genes for pathogenic mutations responsible for the disease. It is often difficult, however, to distinguish between pathogenic mutations and neutral polymorphisms. Polymorphisms are variations fixed in at least 1% of the population. Well-known protein polymorphisms include the G6PD and other isozymes described by Harris as well the blood groups (ABO, Duffy and others). These polymorphisms were used extensively in the 1970s by Bias, McKusick, and others for linkage markers of human genetic diseases. Polymorphisms in DNA, first described by Kan in 1978, are highly informative markers for genetic mapping and have revolutionized mammalian genetic analysis. For example, restriction fragment length polymorphisms are common variations in the DNA sequences that are recognized by restriction endonucleases.
The frequency of a pathogenic mutation should be the same as the frequency of the disease. The pathogenic mutation should never be found in a control population with normal vision. Furthermore, the mutant allele should always segregate with the disease. In other words, the same pathogenic mutation should cause disease in unrelated persons. More important, a pathogenic mutation should disrupt the protein structure that the gene encodes. In most cases, a pathogenic mutation affects an amino acid residue conserved between different species. Therefore, a functional assay is needed to demonstrate how the pathogenic mutation affects the gene’s function. The pathogenic phenotypes of the mutation should also be reproduced in cell culture or animal models. One should keep in mind that many so-called mutations described in the literature may have only loosely met these important criteria.
RETINAL DEGENERATIONS
POSITIONAL CLONING
During the past few years, clinical, cytogenetic, and molecular analysis of patients with complex phenotypes have led to the identification of syndromes caused by deletions of adjacent disease genes on a single chromosome. Schmickel called these conditions contiguous gene syndromes, and they are well recognized in human genetics. The DNA isolated from patients with these syndromes is useful for the mapping and cloning of disease genes. The presence of a cytogenetic lesion immediately points to the chromosomal location of the disease gene, as in the cases of choroideremia and Norrie’s disease.
X-LINKED RECESSIVE RP3 (XLRP).
Twelve years after the initial location of the RP3 gene, accounting for 70% of X-linked RP, Wright and colleagues isolated a candidate exon from direct sequencing of cosmids mapped within the RP3 locus. The transcript encodes a guanine exchange factor and is mutated in all RP3 patients examined. Guanine exchange factors are recruited to interact with G-proteins in plasma membrane upon growth factor stimulation. The level of G-proteins in the GTP-bound state that is available to activate other effectors, is determined by a balance between the activities of guanine exchange factor and GTPase-activating protein (GAP). Loss of the exchange factor may decrease the activity of G-proteins in photoreceptors and causes degeneration.40
CHOROIDEREMIA.
Noting the association of cleft lip and palate, neurosensory deafness, mental retardation, and choroideremia, Nussbaum and colleagues,53 Ledbetter, Ropers, and Cremers and associates54,55 probed the presence of a contiguous gene syndrome in a subject with choroideremia. Cytogenetic analysis revealed a deletion in the Xq21 region. The chromosomal localization of choroideremia had been confirmed earlier by linkage analysis.53 The clinical manifestations of choroideremia are similar to those of retinitis pigmentosa, but choroideremia patients present with more severe involvement of the vascular choroid and the RPE layer, which is known to influence the choriocapillaris. Physical mapping studies of DNA from patients affected with the Xq21 contiguous gene deletion syndrome narrowed the search for the choroideremia gene.54 Subtractive cloning strategies similar to those used in identifying the Duchenne muscular dystrophy locus were used to isolate additional probes around the choroideremia locus.
A milestone in the cloning project was the identification of a female choroideremia patient with a t(X;13) translocation. Further studies on other patients with classic presentations of choroideremia identified smaller deletions. Analysis of the translocation breakpoint and the smallest deletion finally localized the choroideremia gene to a 45 kilobase (kb) region. Using conserved DNA within this region as a probe, a candidate transcript, which was found in the choroid and RPE as well as in other nonretinal tissues, was isolated.55 Mutations in this transcript have been found in patients affected with choroideremia.56 The gene codes for RAB geranylgeranyl transferase, subunit A. Lymphoblast cell lines from choroideremia patients have shown deficiency in the activity of component A, but not component B, of RAB geranylgeranyl transferase.57
NORRIE’S DISEASE.
Retinopathy, pseudoglioma, iris atrophy and synechiae, cataract, corneal opacities, deafness, microcephaly, mental retardation, and hypogonadism characterize Norrie’s disease.41,58 However, only about half of Norrie’s disease patients are deaf or mentally retarded. The clinical features of Norrie’s disease suggest that the gene product may be involved in neuroectodermal cell fate determination and proliferation. The gene was identified by positional cloning, and its gene product showed similarity to transforming growth factor β with a cystine knot motif being isolated.59,60 Nonsense, missense, insertional, and deletional mutations in this candidate gene have been found in Norrie’s disease patients.61 X-linked exudative vitreoretinopathy was later found to be allelic to Norrie’s disease.62
EXUDATIVE VITREORETINOPATHY.
Autosomal exudative vitreoretinopathy41,63 is characterized by subretinal and intraretinal exudates, peripheral vitreous opacities, retinal traction, congenital retinal folds, and enophthalmos. Interestingly, this disorder maps to the location of autosomal-dominant neovascular inflammatory vitreoretinopathy (11q13)64; however, these disorders are considered nonallelic on the basis of distinct EOG b-wave findings.
Stay updated, free articles. Join our Telegram channel

Full access? Get Clinical Tree


