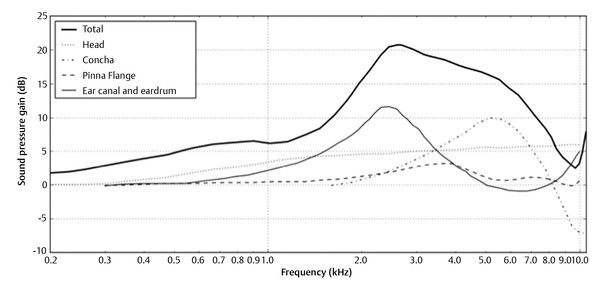
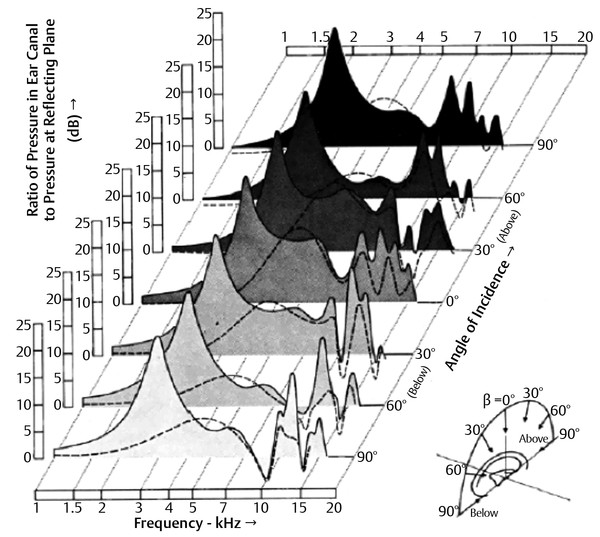
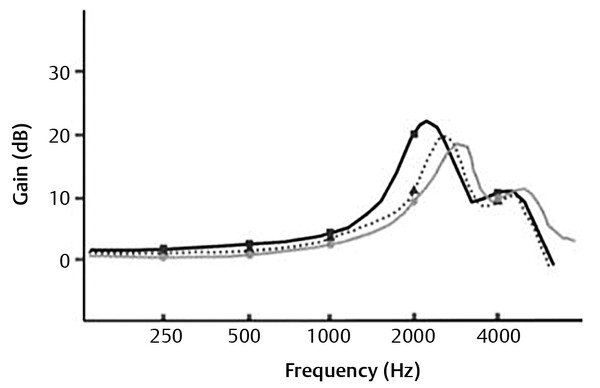
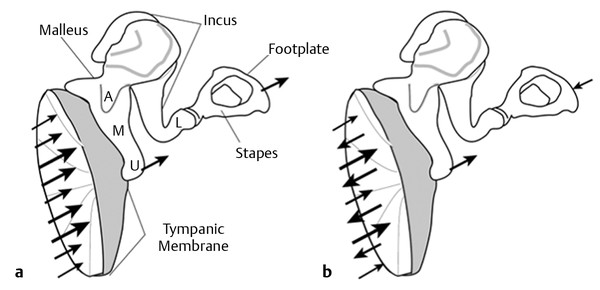
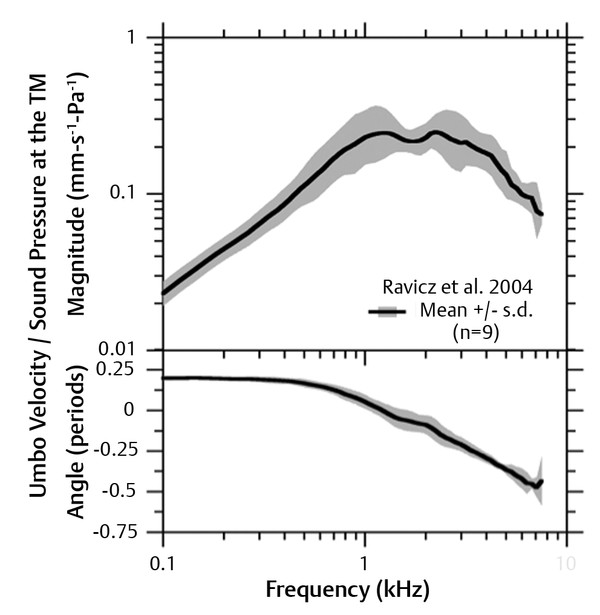
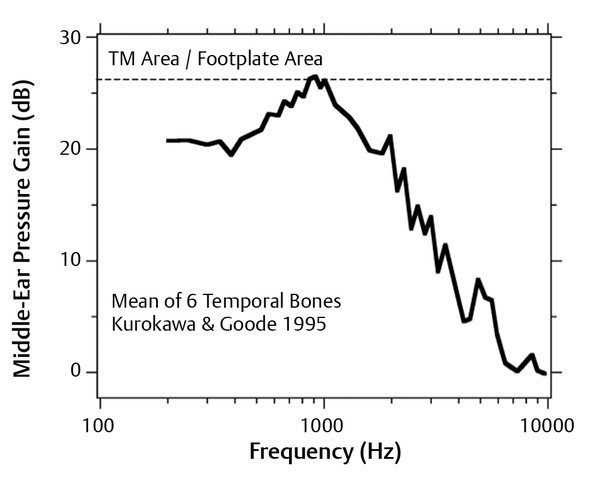
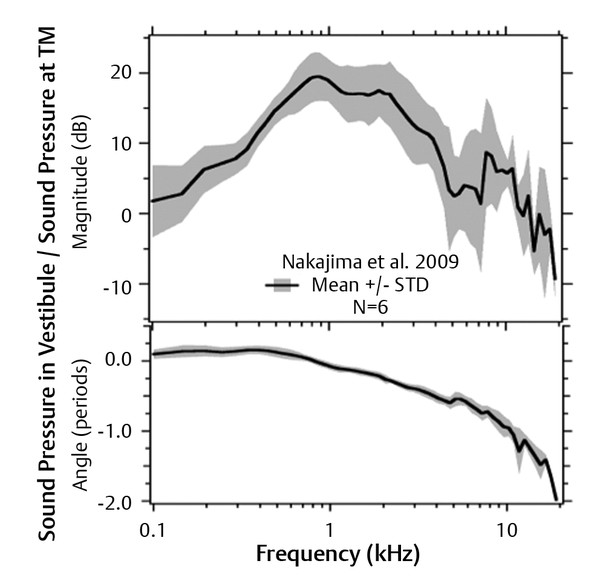
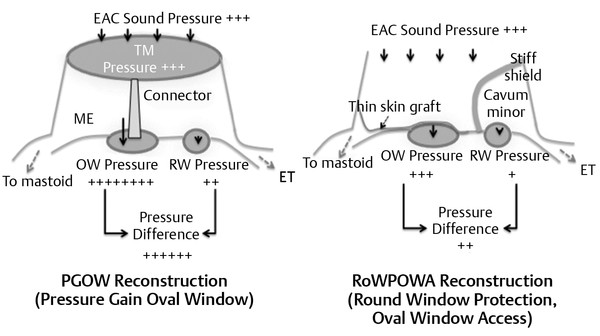
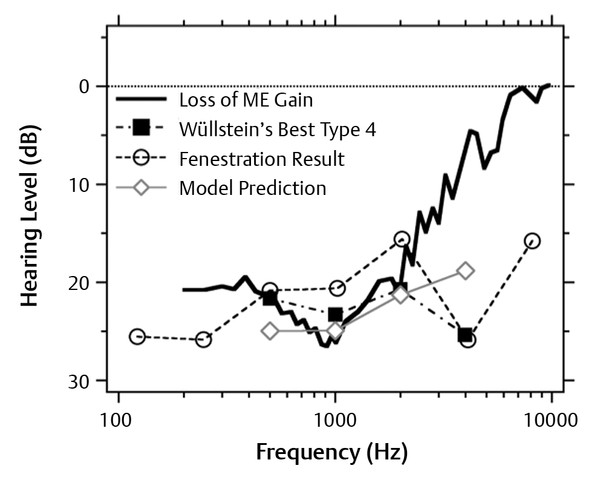
As every middle ear surgeon can attest, achieving good hearing results from middle ear reconstruction is difficult and unpredictable, with a myriad of factors impacting the outcomes. Published hearing results of middle ear reconstructions reveal an enormous range,1 and in general are far from satisfactory. A weighted average calculated from a series totaling 4,389 partial ossicular replacement prosthesis (PORP) reconstructions and 1,413 total ossicular replacement prosthesis (TORP) reconstructions shows air-bone gap closure (ABG) to within 20 dB occurring on average in only 55% of the PORP reconstructions and in 43% of the TORP reconstructions.1 This variance is not unexpected; there are a host of patient factors, including differing residual middle ear anatomy, type and extent of pathology, and patient healing, that affect reconstruction success. This is well recognized by various middle ear risk indexes, such as the Ossiculoplasty Outcomes Parameter Staging (OOPS) index by Dornhoffer and Gardner, which assigns prognostic value to drainage, mucosal fibrosis, revision surgery, and type of surgery.2 Variance in surgical factors, such as surgical techniques and philosophies, adds greatly to the diversity of outcomes. Finally, variability in prosthesis factors, such as its mechanical properties, compounds the diversity even further. There are literally hundreds of possible allograft and autograft prosthesis designs and shapes available, which compounds the spread in hearing results even further. Hence, even in the same ear with the same surgeon, different results may ensue due to differences in the original pathology, reconstruction technique, and the healing processes. This chapter will focus on the mechanical principles of hearing reconstruction, rather than espousing one particular viewpoint, recognizing that surgeons will vary their technique to suit their own patient population and the individual ear they happen to be facing. Although we will focus on the issues of middle ear mechanics and the optimization of the transfer of sound power from air to the inner ear, it must be remembered that in the real world, stabilization of the reconstruction and other healing issues play an equal, if not greater, role in clinical hearing results. It is well known that long-term ossiculoplasty results decline with time due to a host of mechanisms, including scarring, resorption of ossicles, prosthesis displacement by trauma or eardrum movements, and extrusion due to biological processes.3 Biocompatibility issues may dominate the inflammatory and scarring reaction around the prosthesis. Aeration of the middle ear air space is also a key issue given that decreased ventilation due to poor Eustachian tube function leads to fluid in the middle ear, retraction of the tympanic membrane (TM) onto the promontory, or abnormal static pressure within the middle ear, all of which reduce the middle ear movements produced by sound. In many ears, these factors will dominate the hearing results far more than the mechanical properties of the prosthesis used. None of these biological issues are addressed in this chapter. Rather, because clinical studies can be difficult to interpret due to multiple confounding variables, in this chapter we focus on data from temporal bone studies, where individual mechanical factors within the middle ear can be more easily manipulated and measured. Unless otherwise stated, the illustrated results are from fresh cadaveric temporal bones. We also focus on reconstructive surgeries in which the normal ossicular structure cannot be maintained and some kind of prosthetic reconstruction is needed. This can involve allograft prostheses, such as titanium or hydroxyapatite variants, or a sculpted homograft, such as an ossicle, bone chip, or cartilage. In this context, “prosthesis” refers to any connector between residual or reconstructed middle ear structure, rather than only referring to an allograft commercial prosthesis. The surgical recommendations and reconstruction classifications, when alluded to, are from the clinical author (Bance). We will briefly review the normal physiology and pathophysiology of the external and middle ear, and then discuss the mechanical factors involved in surgical reconstruction options and techniques. Sound first enters the auditory system at the pinna and propagates into the ear canal where it exerts dynamic pressure on the TM. The presence of the head, pinna, and ear canal all cause frequency-dependent changes to the amplitude and phase of the incident sound. Because the auditory system is insensitive to the absolute phase of the sound wave at either ear (although it is sensitive to phase differences between the two ears), it is customary to primarily emphasize the amplitude effects. The presence of the head increases the sound pressure on the incident side and decreases it on the opposite side, producing a “head shadow.” The degree of this effect is frequency-dependent. The wavelength is inversely proportional to the frequency, so higher frequencies have shorter wavelengths. When the head diameter is small compared with the sound wavelength (i.e., at lower frequencies), the sound wave moving towards one side of the head has time to pass around the head to the other side in a single half cycle without significant disturbance in the wave. As a result, the sound pressure seen on the two sides of the head is not much different. Hence, at low frequencies, both ears experience similar sound levels. As the wavelength approaches the size of the head, the wave incident on one side of the head cannot travel around to the contralateral side within a single half cycle. This leads to a build-up of sound pressure on the incident side that, in the limit of high frequency, doubles the amplitude of the incident sound wave. At the same time, the pressure on the opposite side drops with increasing frequency. Although the sound pressure on the incident side of the head rises smoothly with frequency, there is little drop in sound pressure on the contralateral side until around 2000 Hz, where the wavelength is 17 cm, roughly the width of the human head. The drop in contralateral sound pressure reaches about -15 dB at 6000 Hz, compared with low frequencies. Such behavior has been well studied by Teranishi and Shaw4,5 who, in experiments on live human subjects and head models, demonstrated a steady increase in the sound pressure on the incident side of the head reaching about 6 dB at 10 kHz relative to that at low frequencies. This effect can be seen in the curve labeled “Head” in ▶ Fig. 9.1, which rises smoothly to about 6 dB at high frequencies. When the sound is directed at the incident ear, the ratio of sound pressure level between the incident and contralateral sides of the head is only a few dB at 200 Hz, rising to roughly 20 dB at 10–12 kHz.6 Fig. 9.1 Pressure gain for a 45-degree horizontal azimuth source. The gain due to the head is based on a spherical head model, that of the concha and pinna on experiments on blocked ear canals, and that of the ear canal and total gain on measurement at the TM. (Modified with permission from Shaw EAG. The External Ear. In: Kiedel WD, Neff WD, eds. Auditory System. Berlin: Springer-Verlag; 1974. p. 455-490.) The pinna serves two main acoustical purposes. Given that it faces forward, it has a similar effect to the head in increasing the pressure of sound incident from the front and decreasing the pressure of sound incident from the back. Because it is much smaller than the head, the pinna’s directionality only affects higher frequency (shorter wavelength) sounds. This can be seen in the curve labeled “Pinna Flange” in ▶ Fig. 9.1, which exhibits essentially no gain until about 3000 Hz. The other effect of the pinna is that the cavities of the pinna, and primarily the concha, act as resonators for sound. A resonator is a structure that stores acoustical energy of selected frequencies, termed the resonant frequencies, allowing the sound pressure at those frequencies to build up to a high amplitude. The resonant frequency depends on the dimensions of the elements that store energy. Teranishi and Shaw5,7 showed that the response of the human concha and ear canal entrance can be approximated quite well by modeling a cylinder and surrounding flange, and that, when matched to the dimensions of the human ear, this model exhibits a resonant frequency that matches the average resonant frequency of human pinnas of 4700 Hz. This can be seen in the curve labeled “Concha” in ▶ Fig. 9.1. The typical gain in sound pressure from the concha as measured at the entrance of the external auditory meatus is approximately 10 dB, as shown in ▶ Fig. 9.2. Fig. 9.2 Pressure at the TM compared with pressure seen at a reflecting plate at the same location in the absence of an external ear as a function of source elevation direction. The most significant spectral changes occur in the 9–15 kHz band, which is where most of the elevation pinna cues occur. (Used with permission from Shaw EA and Teranishi R. Sound pressure generated in an external-ear replica and real human ears by a nearby point source. The Journal of the Acoustical Society of America. 1968;44(1):240-249.) A second phenomenon associated with the concha is the pinna notch, a sharply tuned minimum in the response of the auditory system typically in the 9–11 kHz range. It arises due to the destructive interference between sound that directly enters the ear canal and sound that reflects off the concha before entering the ear canal. When these two pathways for sound differ in length by half a wavelength, they will destructively interfere with each other. This happens when the dimension of the concha is a quarter of a wavelength (because sound traverses it twice on reflection). The concha linear dimension is about 8–10 mm, resulting in destructive interference in the range of 8500–10,500 Hz. Five other weaker pinna resonances also occur in the range of 10–15 kHz. These pinna resonances play an essential role in sound localization in the elevation plane because their strength depends strongly on the elevation of the sound source. Temporarily and successively blocking the cavities of the pinna results in a decrease in elevation localization acuity, with the largest drop in acuity occurring when the concha is blocked and smaller drops occurring when the fossa and scaphae are blocked.8 The ear canal is a tube averaging 2.5 cm in length in adults, with an average diameter of 7 mm and an average volume of 1 cm3. Acoustically it also forms a resonator. At specific frequencies, interference between the incoming sound and the waves reflected from the TM leads to an increase in the sound energy at the TM. This enhancement occurs when the length of the canal tube is 1/4, 3/4, 5/4, etc., of the wavelength of sound. From this simple quarter wave resonator model, the 2.5-cm length of the ear canal should generate a resonance at 3400 Hz. In fact, the resonance is somewhat lower, typically closer to 2500 Hz, due to imperfect reflections at the TM and the influence of the wide opening of the concha around the lateral end of the canal. This wide opening effectively lengthens the canal and lowers the resonant frequency. The typical gain due to the ear canal with the characteristic resonance can be seen in the curve in ▶ Fig. 9.1 labeled “Ear canal and ear drum.” The imperfect reflection of the sound at the TM is essential to hearing: if the reflection were perfect, no sound would travel to the middle ear. The TM presents a high stiffness and, hence, a large impedance at low frequencies that results in a strong reflection, but the TM’s impedance drops by a factor of four between 200 Hz and 2000 Hz. The reduced middle ear reflectance in the mid-range has the effect of reducing the ear canal pressure gain, lowering the resonance frequency and broadening the ear canal resonance. The TM impedance can be strongly affected by pathologies. Middle ear fluid creates a higher TM impedance by reducing the compliance of the middle ear cavity. This results in a stronger and more sharply tuned external ear resonance. Perforations in the middle ear reduce the impedance at the TM, allowing sound to travel directly into the middle ear. The resulting lower reflection reduces the ear canal gain and broadens the ear canal resonance. In canal wall-down mastoidectomies, the ear canal is opened to the mastoid cavity, and so the ear canal length is effectively increased. Increasing the ear canal’s length in this way measurably decreases the ear canal resonance frequency, and filling in the cavity can increase the resonance frequency to a value closer to that seen in the absence of a mastoid cavity. This effect was reported by Evans, Day and Browning who observed a 300-Hz decrease in ear canal resonance frequency after radical mastoidectomy in 12 patients.9 More recently, Jang studied ear canal resonances in populations of 40 normal ears, 20 mastoid cavities, and 40 filled in or obliterated cavities, observing mean ear canal resonance frequencies at 2950 Hz, 2350 Hz, and 2750 Hz, respectively.10 The measured acoustic response at the TM for the three populations is shown in ▶ Fig. 9.3. Fig. 9.3 Mean pressure gain at the eardrum for a population of normal patients (gray line), open mastoid patients (black line), and obliterated or filled mastoid patients (dotted line). (Used with permission from Jang CH. Changes in external ear resonance after mastoidectomy: open cavity mastoid versus obliterated mastoid cavity. Clinical otolaryngology and allied sciences. 2002;27(6):509-510.) Taken together, the effects of the head, pinna, ear canal, and TM act to increase the pressure seen at the TM by up to 22 dB compared with the pressure that would be seen at the same location if the head were not there (thick, solid curve in ▶ Fig. 9.1). The pressure enhancement peaks at about 2100 Hz and remains above 10 dB over a wide range, from 1500 Hz to 6000 Hz. It drops off slowly toward the lower frequencies, reaching 2 dB at 200 Hz. At higher frequencies, the response drops off sharply due to the pinna notch. Taken together, this means the EAC is a significant factor in generating pressure gain within the overall EAC/middle ear complex, and, at some frequencies, can provide more of the pressure gain than the middle ear does. The middle ear is made up of the TM, ossicles, and the middle ear air spaces. The TM and ossicles move in response to sound pressure in the ear canal, while the high compressibility of the air within the middle ear permits these motions. At frequencies below 1–2 kHz, the TM and ossicles move almost as a unit, where all parts of the TM and ossicles move in phase. This in-phase motion suggests the entire middle ear approximates a single acoustico-mechanical device when responding to low-frequency sound. At frequencies above 2 kHz, parts of the TM surface move out of phase with each other,11 the ossicles and their joints begin to bend,12 and it becomes necessary to consider the mechanics of the individual components of the middle ear rather than to treat them as a single structure. The difference between the low- and high-frequency action of the middle ear is schematized in ▶ Fig. 9.4, where the sizes of the different arrows indicate the magnitude of sound-driven motions and the directions of the arrows indicate in-phase or out-of-phase behavior. At frequencies less than 2 kHz (▶ Fig. 9.4a), the surface of the TM and the ossicles move with different magnitudes, but they all move in and out together. The different lengths of the arrows point out that the umbo moves less than the TM surface. At frequencies above 2 kHz, regions on the TM begin to move out of phase with each other as the TM surface appears to break up into different patterns of modal motions.11,13 There is also a difference in phase in the motion of the umbo and the stapes as the ossicles bend and the ossicular joints allow relative motions between the components of the chain. Fig. 9.4 (a,b) Schematics of the TM and ossicles illustrating the in-phase behavior of the middle ear at frequencies less than 2 kHz and the variations in phase that occur at higher frequencies. The function of the middle ear is to help match the difference in acoustic impedance between air and cochlear fluid, a process that provides a gain in sound pressure between the EAC and the oval window. This gain helps produce a sound pressure difference between the cochlear windows, which is the primary stimulus to the traveling wave and excitation of the cochlear partition. The TM is one of the primary elements in the transformation and coupling of sound energy from the ear canal to the oval window. The area of the TM is a primary determinant in its impedance transformation function,14,15 and its mechanical properties help shape the frequency response of the middle ear. At frequencies below 1 kHz, the input impedance at the normal TM is dominated by the stiffness of the TM and ossicular ligaments16; at frequencies between 2 and 8 kHz, the impedance appears as a combination of resistance (from damping within the inner ear17 and mass18). Therefore, in pathology and surgical reconstruction, changes in stiffness of the TM and oval window annular ligament primarily affect the transmission of low-frequency sounds, and alterations in ossicular mass should affect the high-frequency response of the ear.19 Some of these processes are observed in the sound-induced motion of the umbo. ▶ Fig. 9.5 illustrates the transfer function that describes the ratio of the velocity of the umbo to the sound pressure in the ear canal near the TM. At frequencies below 1 kHz, the increasing magnitude and ~ 0.2-period phase angle of the umbo motion is consistent with a stiffness-dominated impedance of the umbo. Between 2 and 4 kHz, the near-constant magnitude and phase between 0 and -0.2 is consistent with resistance and mass impedance effects. However, at higher frequencies, the phase angle drops and is more consistent with some kind of delay between the sound pressure and the resulting motion of the umbo, (e.g., from traveling waves or other sources). Fig. 9.5 Measurements of the sound-induced velocity of the umbo of the malleus normalized by the stimulus sound pressure within the ear canal near the TM made in fresh human temporal bones. The means ± the standard deviations from 9 ears are illustrated. (Data from Ravicz M, Rosowski J, Merchant S. Mechanisms of hearing loss resulting from middle-ear fluid. Hearing research. 2004;195:105-130.) While the TM moves in phase to sound at low frequencies, there are significant variations in the magnitude of motion across its surface, with the smallest motion occurring along the attachment of the malleus to the TM.11,20 At frequencies above 2 kHz, different parts of the TM begin to move out of phase, and the increasingly complicated patterns of TM surface motion suggest that, at sound frequencies above 6 to 8 kHz, much of the eardrum may be decoupled from the ossicles.21 However, others suggest tight coupling of the TM and malleus at high frequencies via the radial fibers within the TM.22 The three linked ossicles (the malleus, incus, and stapes) couple the TM to the oval window. At frequencies below 2 kHz, the ossicles act as a set of loosely coupled rigid bodies that rotate about an axis roughly passing through the posterior-incudal and anterior-malleal ligaments.14,23 The loose coupling of the ossicles comes from the action of the incudomalleal joint, which allows relative motions of the incus and malleus at most acoustic frequencies, with this slippage increasing above 2 kHz.24 Above 2 kHz, there is evidence of flexing of the ossicles themselves and more complicated motions of the ossicles.12 Although it is generally assumed the piston-like motions of the stapes are the most relevant for sound transmission to the inner ear, there is some evidence that when piston-like movements are reduced, other modes of stapes motion, such as rocking motions, can contribute to inner ear stimulation. This can happen at high frequencies.25 Such complicated motions of the footplate could also be excited by the eccentric forces that result from various ossicular reconstruction strategies. Air is a compressible fluid, and according to the ideal gas law, the larger the volume of fluid, the lower the pressure needed to compress the fluid. The normal volume of the adult human middle ear air spaces varies from 2 mL to 20 mL, with estimates of mean volume near 6 mL.26 The majority of this air is usually housed within the mastoid, with 1–2 mL in the tympanic cavity behind the TM.16 Regardless of the location of the air, the total air volume determines the compressibility of the middle ear air spaces at low frequencies. In healthy ears with air volumes greater than 2 mL, the air is so compressible that it has little effect on the middle ear input impedance and plays nearly no role in determining the magnitude of the sound-induced motion of the TM. Mastoid obliteration will not change the volume of air in an otherwise well-ventilated middle ear sufficiently to have any mechanical impact on its input impedance; however, the compressibility of residual air within the cavity can become significant in diseased or reconstructed ears.27,28 The air volume has to fall to very low levels (<10% of normal volume) to have any significant effect on middle ear function.27 The main mechanism the middle ear uses in matching the impedance of air and cochlear fluid is its action as a hydraulic lever, in which the small area of the bony stapes footplate acts as a piston coupled to the larger area of the TM. The ratio of these areas is the primary determinant of how well airborne sound energy in the ear canal is transformed to sound energy at the oval window. Although the bony stapes footplate acts as a well-defined output piston, the TM is far from an ideal piston head: it fails to move in phase at frequencies greater than 2 kHz, and the growth of out-of-phase vibrations across its surface reduces the effective area of the piston. This non-piston-like behavior may be an immediate result of the light and flaccid construction required to minimize the mass of the TM and permit the relatively large TM motions produced by sound. Associated with the transforming lever function is a middle ear gain, which in an ideal hydraulic level would be defined by the area of the input (TM) and output (stapes footplate) pistons.14,29 In humans, the area of the TM is about 66 mm2 and the area of the footplate is about 3.2 mm2.14 The resultant area ratio equals 20.6, which in dB is a ratio of 26.3 dB. To estimate this gain experimentally, Kurokawa and Goode30 measured the stapes motions that resulted from a stimulus sound pressure in the ear canal and from acoustic stimulation of the isolated oval window (i.e., with the middle ear removed). The ratio of the pressures required with and without the middle ear to produce identical motions of the stapes is a measure of the pressure gain of the middle ear (▶ Fig. 9.6). The estimated middle ear pressure gain is within 6 dB of the 26.3 dB area ratio for sounds of frequencies less than 2 kHz (indicating an efficient hydraulic lever), but the gain falls as frequency is increased above 2 kHz and is effectively zero around 6 kHz. Fig. 9.6 The mean of measurements in 6 temporal bones of the ratio of the sound pressure produced at the oval window compared with the sound pressure input in the ear canal. This Middle Ear Pressure Gain is compared with the gain predicted by an anatomically realistic TM-to-footplate area ratio. If the middle ear were an ideal transformer, the measured gain would be close to the anatomical area ratio and frequency-independent. Deviations from this ideal state occur because of the action of nonideal processes within the middle ear, which include the effective loss of the TM area as it breaks up into out-of-phase segments at higher frequencies, the need to overcome stiffness in the TM and the ossicular supports, the masses of the ossicles and inner ear fluids, the damping within the cochlea, the losses of sound energy that occur with relative motion across the ossicular joints, and losses due to bending of the ossicles. Although the middle ear pressure gain depends on the areas of the TM and the footplate, the relationship between this gain and the transfer of sound through the middle ear into the inner ear is complicated. Either a too-high gain or a too-low gain can lead to hearing loss. Consider what happens when replacing the stapes footplate with a piston of variable area: one can maximize the pressure gain at the interface of the replacement piston and the cochlear fluids by making the piston as small as possible; however, such a design would have two failings. First, as the piston area gets smaller, the volume displaced by motions of the replacement piston also decreases. Second, although the pressure at the interface point increases as the area decreases, the average pressure over the area of the whole oval window is unchanged. Indeed, estimates of the optimum piston area for stapes reconstruction suggest a piston area equal to the area of the normal footplate, with smaller and larger areas leading to decreases in middle ear sound transfer.28 The Kurokawa and Goode technique of comparing stapes motions produced by sound stimuli in the ear canal with those produced by sound stimuli presented directly to the lateral surface of the stapes after removing the TM, malleus, and incus gives one measure of middle ear gain. This estimate relates the sound pressure in the ear canal to the effective pressure that acts to move the stapes, the cochlear fluids, and the cochlear partition. However, some fraction of the pressure applied to the stapes is used to move the stapes and counteract the stiffness of the stapediovestibular joint, never reaching the inner ear. Another estimate of middle ear gain compares the sound pressure in the ear canal to the resultant sound pressure within the fluid of the cochlear vestibule. Such gain estimates exclude the stapes and its joint from the inner ear. Various authors have measured this pressure transfer function (Puria, Peake, and Rosowski,31 Aibara, Welsh, Puria S, and Goode,32 Nakajima, Dong, and Olson33). ▶ Fig. 9.733 shows that this sound pressure transfer ratio is bandpass and is of the largest magnitude between 1 and 3 kHz, with significant roll-offs above and below this range. It can also be noted that the primary differences between the data in ▶ Fig. 9.6 and ▶ Fig. 9.7 are at frequencies less than 0.5 kHz, the frequency range where the stiffness of the stapediovestibular joint most affects middle ear sound transfer.16 Fig. 9.7 Measures of the ratio of sound pressure in the vestibule to the sound pressure in the ear canal at the TM. The upper panel shows the magnitude of the pressure gain. The lower panel shows the difference in phase between the sound pressure in the vestibule and the sound pressure at the TM. (Data are from Nakajima HH, Dong W, Olson ES, Merchant SN, Ravicz ME, Rosowski JJ. Differential intracochlear sound pressure measurements in normal human temporal bones. Journal of the Association for Research in Otolaryngology: JARO. 2009;10(1):23-36.) A minor effect of the presence of the TM in a normal ear is that it reduces the sound pressure within the middle ear spaces relative to the sound pressure in the ear canal. This leads to an attenuation of the sound pressure at the round window that occurs simultaneously with the gain in sound pressure at the oval window. Voss, Rosowski, Merchant, and Peake34 have demonstrated that the pressure at the round window remains small compared with the oval window, even in ears with TM perforations, as long as the ossicular chain is normal and some contact exists between the ossicles and the remaining fraction of the TM. An important concept is that of acoustic versus ossicular coupling, put forward by Peak, Rosowski, and Lynch.35 The normal middle ear provides a pressure gain at the oval window of approximately 20 dB in the 0.1–3 kHz frequency band and partly shields the round window, producing a pressure difference between these two windows. Because the stimulus to the inner ear depends on the algebraic difference in sound pressure at the windows (not the dB difference), the attenuation of an already small sound pressure at the round window has little effect on the window-pressure difference in the normal ear. This route of coupling sound pressure to the inner ear has been termed ossicular coupling.35 If the middle ear is destroyed by disease, there is still a small pressure difference between the oval window and round window due to their spatial separation and protection of the round window, but this pressure difference is only about -40 dB of the EAC pressure. This can still drive the inner ear fluids, but at a much reduced level, about 50 dB or 60 dB below that of the ossicular coupling route. This method of hearing has been termed acoustic coupling35 and is commonly seen with damaged middle ears. With acoustic coupling, hearing will actually improve slightly with a TM perforation, as the sound pressure at the two windows, and, hence, their pressure difference, is increased.36 Although the previous section has focused on normal middle ear physiology, in diseased ears, there are numerous factors that can lead to hearing loss. These include TM perforations, fixations of the ossicles (either bony or by soft tissue), missing ossicles, and footplate fixations. We will focus not on stapedotomy-type reconstructions, but, rather, reconstructions of remaining middle ear structures. Reconstruction of the middle ear for hearing gain attempts to maximize, again, the pressure difference between the oval window and the round window. Practical ways to change the pressure differential between the oval window and round window and middle ear reconstruction with passive prostheses can essentially be divided into two groups. These are described below and illustrated in ▶ Fig. 9.8. Fig. 9.8 The difference in anatomical construction between the PGOW-type and RoWPOWA-type reconstructions. All PGOW reconstructions require coupling of the large surface area of the TM to the smaller surface area of the oval window with some kind of stiff connector, typically an ossicular prosthesis or residual stapes superstructure. The “+” signs qualitatively signify pressure magnitude but are not meant to be numerically accurate. ET, Eustachian tube. Pressure gain at the oval window (PGOW) reconstructions all attempt to reconstruct ossicular coupling by connecting a large-area TM to the smaller-area oval window to reconstitute the hydraulic lever pressure gain, and so they all require a vibrating TM. All the PGOW-type reconstructions require a structure to couple the TM to the oval window, either remaining ossicles (e.g., Wullstein type III) or, more commonly, some kind of connector such as an autograft or an artificial ossicular prosthesis. Therefore, in addition to the variability in the style of TM reconstruction, another source of variability in the PGOW-type reconstruction is the mechanical properties and placement of the ossicular prosthesis. Reconstruction mechanics research and clinical literature are easier to interpret and summarize if the specific contact points of the prosthesis within the middle ear, specifically the medial and lateral attachment points, are explicitly stated. Round window protection with oval window access (RoWPOWA) reconstructions attempt to maximize acoustic coupling by allowing unimpeded acoustic access to the oval window while shielding the round window from sound, typically by covering it with a stiff shield such as cartilage. Because no attempt is made to couple a mobile inner ear window to a freely mobile TM by an ossicular replacement, a vibrating TM is not needed. Classically, these are the Wullstein Type IV and V tympanoplasties. Such approaches require that the round window area has some air as a buffer around it, so that it can move, and, therefore, require some ventilation pathway to the Eustachian tube, typically by constructing a small inferiorly ventilated segment from the Eustachian tube to the round window, a cavum minor. Lateral canal fenestration follows mechanics similar to RoWPOWA and are included with this group. The Wullstein classifications37 (mostly RoWPOWA reconstructions) are listed in ▶ Table 9.1. ▶ Table 9.2 shows a classification scheme for middle ear reconstruction adapted from one used by one of the authors,38 the majority of which are PGOW-type reconstructions. The medial termination is specified first, as it is traditionally by the designation PORP and TORP, which implies reconstruction to the stapes head or to the footplate, respectively. Type I Essentially myringoplasty, with repair of perforation Type II Placing TM onto the remaining incus, in malleus necrosis; rarely used Type III Placing TM directly onto stapes superstructure Type IV Direct sound access to OW (usually grafted with split-thickness skin graft), round window protection with ventilated cavum minor Type Vb Open access to OW, footplate removed, round window protection with ventilated cavum minor Type Va Lateral canal fenestration, round window protection with ventilated cavum minor A. PGOW reconstruction In general, the lateral and medial and mid prosthesis interface / stabilizers should be specified, e.g., medial ± footplate shoe, lateral ± cartilage overlay, mid-shaft ± cartilage or other stabilizer. The most commonly used are in boldface. (I) Direct Connection TM to residual ossicles a) Direct connection incus onto TM (D-IOT-Wullstein type II) b) Direct connection stapes head onto TM (D-SHOT-Wullstein type III) (II) Connectors between TM and residual ossicles Connecting Acronym Current terminology or examples Stapes Head onto TM SHOT PORP Stapes Head onto Malleus SHOM PORP Stapes Head onto Incus SHOI e.g., cement, Applebaum Stapes Head onto both TM and Malleus SHOTM PORP Stapes Head onto Artificial or relocated Malleus SHOAM PORP to relocated malleus Stapes Footplate onto TM FOT TORP Stapes Footplate onto Malleus FOM TORP Stapes Footplate onto Incus FOI e.g., stapes piston on mobile footplate Stapes Footplate onto both TM and Malleus FOTM TORP Stapes Footplate onto Artificial or relocated Malleus FOAM e.g., TORP to relocated malleus Vestibule onto TM VOT TORP with stapedotomy Vestibule onto Malleus VOM Malleostapediopexy Vestibule onto Incus VOI Standard stapedotomy Vestibule onto Both TM and malleus VOB Vestibule onto Artificial or relocated Malleus VOAM Rarely used Incus onto TM IOM Rarely used Incus onto Malleus IOT e.g., cementing IM joint, rarely used B. RoWPOWA reconstruction RoWPOWA-FP: Stapes footplate access (Wullstein type IV) RoWPOWA-V: Inner ear access with removal of stapes footplate (Wullstein type Vb) RoWPOWA-HC: Inner ear access with lateral canal fenestration (Wullstein type Va) Middle ear reconstructions that fall into the RoWPOWA classification (Wullstein’s Type IV and V reconstructions39 and Lempert’s canal fenestration procedure40), make up a small part of the reconstructive surgeries performed today but were more numerous in the past. However, given the wide variety of results from PGOW procedures that reconstruct the TM and ossicles, these simpler procedures may be of use in selected circumstances. For example, the Type IV or V procedure may be useful in severely diseased ears where the ear canal wall has been taken down and the stapes superstructure has been compromised.41 With the Type IV and V reconstructions, the mobile footplate (Type IV) or fat graft (Type V) within the oval window is exteriorized to the ear canal whereas, in the fenestration procedure, a new window into the inner ear is exteriorized to the canal. When successful, these procedures isolate the mobile round window from sound pressure in the ear canal while maintaining aeration of the round window area by inclusion of the pro-tympanum behind the isolating graft shield in a ventilated cavum minor. The basis for these procedures is the pressure difference theory noted above, where the fundamental stimulus to the inner ear is a difference in sound pressure at two cochlear windows that produces a net flow of incompressible fluid between them. In the Type IV and V procedures, the two windows are the oval window, which is filled with either a mobile stapes footplate or a loose graft, and the round window. The fenestration procedure was used as a treatment for otosclerosis, where the footplate is no longer mobile, and a new window is cut into the lateral semicircular canal and covered with a thin skin graft.40,42 For any of these RoWPOWA procedures an ideal reconstruction would include (1) a mobile input window to the cochlea exteriorized to the external ear, (2) a mobile round window that is protected or shielded from the sound pressure in the ear canal by a stiff graft, and (3) an air-filled space between the round window and the shield that is maintained by a working Eustachian tube.43,44 If these three constraints are met, the sound pressure at the round window that results from ear canal sound stimulation is very small (approximately zero), and the window pressure difference then equals the ear canal stimulus pressure. However, all of these conditions can be difficult to meet. It is common to see scarring over the footplate after graft placement, and a very thin split-thickness skin graft is usually recommended. Providing ventilation to the cavum minor around the round window can also be a challenge in Eustachian tube dysfunction. In RoWPOWA reconstructions, essentially the loss in pressure at the oval window is the loss of the middle ear transformer pressure gain and, because the round window is protected, the external canal pressure drives the inner ear. As we have seen, Kurokawa and Goode45 estimated the middle ear gain to be 20–25 dB at frequencies less than 2 kHz (▶ Fig. 9.6), which is consistent with the observation of a residual 20–25 dB air-bone gap46 in the best of these RoWPOWA reconstructions (▶ Fig. 9.9).44 Fig. 9.9 A comparison of some of the best results of Type IV surgery. Shown are the mean of six cases. Data from Wüllstein H. The restoration of the function of the middle ear in chronic otitis media. Ann Otol Rhinol Laryngol. 1956;65:1020–1041. Wüllstein H. Results of tympanoplasty. Arch Otolaryng. 1960;71:478–485. Lempert J. Endaural fenestration of external semicircular canal for restoration of hearing in cases of otosclerosis. Arch Otolaryng. 1940;31:711–779. Lempert J. Fenestra non-ovalis: a new oval window for the improvement of hearing in cases of otosclerosis. Arch Otolaryng. 1941;34:880–912. Merchant S, Rosowski J, Ravicz M. Middle-ear mechanics of type IV and type V tympanoplasty. II. Clinical analysis and surgical implications. Am J Otol. 1995;16:565–575. Kurokawa H, Goode R. Sound pressure gain produced by the human middle ear. Am J Otol. 1995;113:349–355.
9.2 External Auditory Canal (EAC)
9.3 Normal Middle Ear Function
9.3.1 The Tympanic Membrane
9.3.2 The Ossicular Chain
9.3.3 The Middle Ear Air Spaces
9.3.4 Middle Ear Pressure Gain
Protection of the Round Window by the TM
Acoustic Coupling and Ossicular Coupling
9.4 Hearing Reconstruction of Diseased Middle Ears
9.4.1 Classification of Hearing Reconstruction Surgeries
9.4.2 RoWPOWA Reconstruction: Reconstruction with Ossicular Function
Stay updated, free articles. Join our Telegram channel

Full access? Get Clinical Tree


