Methods for Assessing the Effects of Pharmacologic Agents on Aqueous Humor Dynamics
Rachel Peck
Mieko Hayashi
Michael E. Yablonski
Joel S. Mindel
Douglas J. Rhee
BASIC PRINCIPLES
The steady-state intraocular pressure is determined by the rate of aqueous humor formation, the flow of fluid from the eye, and the episcleral venous pressure. All agents that affect the steady-state intraocular pressure must do so by affecting at least one of these three variables. Non-steady–state alterations can occur by transient changes in these variables as well as by a variety of other mechanisms.
STEADY-STATE ALTERATIONS OF INTRAOCULAR PRESSURE
AQUEOUS HUMOR FORMATION
Active and Passive Mechanisms of Formation
Aqueous humor is secreted into the posterior chamber by the nonpigmented ciliary epithelium. Aqueous humor production requires an active sodium-potassium adenosine triphosphatase similar to that found in other secretory epithelial tissues throughout the body.1,2,3,4 In addition, the enzyme carbonic anhydrase is intimately involved in the secretory mechanism.5,6,7,8 Passive flow of aqueous humor into the posterior chamber has also been postulated to account for a significant fraction of aqueous humor formation9; however, this seems unlikely. Passive flow would result from hydrostatic and osmotic pressures acting as driving forces. If passive formation were significant, an appreciable decrease in the rate of aqueous humor formation should occur when the intraocular pressure was raised. However, the baseline rate of aqueous humor formation in the primate, approximately 2.0 μL/min, decreases only 0.02 μL/min per millimeter of mercury (mm Hg) as intraocular pressure is raised.10 As pointed out by Bill,11 the protein colloid osmotic pressure of the interstitial fluid is 14 mm Hg. This would draw fluid from the posterior chamber into the ciliary processes. For passive fluid flow to occur in the opposite direction, the ciliary process hydrostatic pressure would have to exceed the intraocular pressure by more than 14 mm Hg.
Measurement of the Rate of Aqueous Humor Formation
Goldmann12 calculated the rate of aqueous humor flow through the anterior chamber by measuring the relationship between aqueous humor fluorescein concentration and plasma fluorescein concentration after intravenous administration of the dye. Subsequently, oral administration of fluorescein was used for this purpose.13,14 The chief disadvantage of both methods is that knowledge of the fluorescein concentration in the posterior chamber is required. This is difficult to determine. In addition, frequent measurements of the unbound plasma fluorescein concentration are necessary.
Jones and Maurice15 showed that after application of fluorescein to the cornea by iontophoresis it was possible to measure aqueous humor flow by monitoring the changes of fluorescein concentration in the corneal stroma and anterior chamber. Topical administration using fluorescein eye drops has also been effective.16 The typical time course of the fluorescein concentration in the corneal stroma and anterior chamber after topical administration is shown in Figure 1. In method I of Jones and Maurice,15 aqueous humor flow was calculated from the magnitude of the peak anterior chamber concentration and the time required to reach this peak. Because the exact time of the peak fluorescein concentration in the anterior chamber was difficult to determine, owing to the relative flatness of the curve, this method was seldom used. Method II of Jones and Maurice15 used data from those portions of the cornea stroma and anterior chamber fluorescein decay curves that were parallel. The magnitude of the anterior chamber aqueous humor flow, Fa, is a function of the anterior chamber volume, Va, the slope of the decay curve, A, and the ratio of the mass of fluorescein in the cornea to that in the anterior chamber, Mc/Ma, as shown in equation 1.
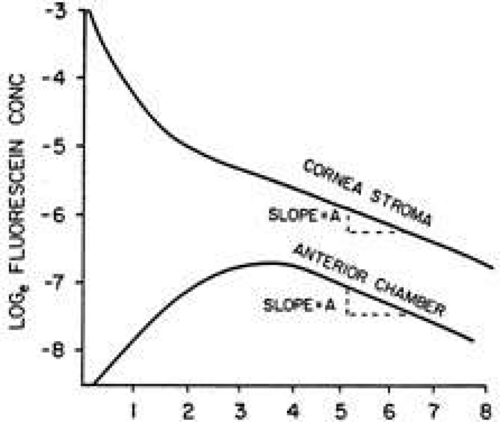 Fig. 1. Time course of fluorescein concentration in the corneal stroma and anterior chamber after topical administration. |
Fa = VaA[1 + Mc/Ma]
Mc = Vc Cc, where Vc is the corneal stroma volume and Cc is the corneal stroma fluorescein concentration. Similarly, Ma = Va Ca, where Ca is the anterior chamber concentration of fluorescein. Making these substitutions in equation 1 yields:
Fa = VaA[1 + VcCc/VaCa]
If the volumes of the cornea and anterior chamber are assumed to remain constant in the steady state, then Fa is a function of A, the steepness of the decay curve, and Cc/Ca, which is the ratio of fluorescein concentrations in the corneal stroma and aqueous humor. The logarithm of Cc/Ca is represented by the distance between the parallel decay curves (see Fig. 1). Equation 2 shows that the more rapid the rate of aqueous humor flow, Fa, the steeper will be the decay curves and the larger the magnitude of the distance between the two decay curves (i.e., Cc/Ca will increase). At the other extreme, if Fa becomes equal to zero, the fluorescein concentrations in the anterior chamber and corneal stroma will equalize by diffusion and decay curves will be flat (A = 0).
Equation 2 rests on the assumptions that (i) all fluorescein in the corneal stroma leaves by diffusion into the anterior chamber, (ii) the anterior chamber is a well-mixed compartment, and (iii) all anterior chamber fluorescein is removed by convective flow.15,16,17 These assumptions have been shown to be reasonably accurate.15,18 In addition, there is close agreement between the empirically measured changes in fluorescein concentration and the theoretical values predicted by the model.15,16,17,18
The chief advantage of the fluorophotometric method is that aqueous humor flow can be measured without invasive procedures. The normal physiology is altered in only two ways: (i) fluorescein is present in the eye and (ii) the eye is intermittently exposed to blue light. The blue light causes the dye in the corneal stroma and aqueous humor to fluoresce. This fluorescence is measured by the fluorophotometer and is directly proportional to the fluorescein concentration.
Invasive methods have been used to measure aqueous humor flow in experimental animals.10,19,20,21 These methods suffered from the obvious disadvantage that they could not be carried out without an obligatory insult to the eye.22 They usually measured the rate of change in the concentration of a tracer substance injected into the aqueous humor or measured the rate of flow from a reservoir into the cannulated anterior chamber as the infusion pressure was changed.11,20 Tracer molecules can also be used to determine the routes of flow from the anterior chamber; in this manner uveoscleral flow was first discovered.23
Tonography has been used to measure anterior chamber aqueous humor flow. The method is noninvasive. However, at best, tonography can only reveal the rate of flow across the trabecular meshwork (i.e., the pressure-dependent flow). Because tonography measures the change in aqueous humor flow caused by an increase in intraocular pressure, it yields no information regarding the magnitude of the pressure-independent flow of aqueous humor, usually referred to as uveoscleral outflow, Fu. Therefore, it is not possible to determine the rate of aqueous humor formation on the basis of tonography alone. As shown in equation 3, in the steady state, the rate of anterior chamber aqueous flow, Fa, equals the sum of trabecular outflow, Ftr, and uveoscleral outflow, Fu.
Fa = Ftr + Fu
AQUEOUS HUMOR OUTFLOW
Trabecular Meshwork Outflow
The inner wall of the canal of Schlemm and the juxtacanalicular tissue seem to be the sites of the major resistance to flow through the trabecular meshwork.24 Tonography is used to measure this resistance to the flow of aqueous humor. In its simplest form, tonography is accomplished by placing the Schiøtz tonometer on the cornea of the supine patient for 4 minutes and observing the change in intraocular pressure over the test period. Electronic tonography machines allow a continuous recording of the intraocular pressure.
The flow of aqueous humor into the canal of Schlemm seems to be a passive process and therefore obeys the general physical law relating passive flow, F, the hydrostatic pressure driving force, Δp, and the resistance to flow, R (equation 4).
ΔP = FR
When applied to the trabecular flow, it yields
IOP-PCS = FtrRtr
where the driving force is IOP – Pcs, the difference between the hydrostatic pressure of the anterior chamber, IOP, and that of the canal of Schlemm, Pcs. Ftr is the transtrabecular flow of aqueous humor, and Rtr is the resistance to flow between the anterior chamber and the canal of Schlemm. The inverse of Rtr is Ctr, the trabecular outflow facility.
Ctr = 1/Rtr
Combining equations 5 and 6 yields:
Ftr = Ctr(IOP–Pcs)
If in equation 7 IOP is changed by ΔIOP, while Ctr and Pcs remain constant, the trabecular meshwork flow will change by ΔFtr, as shown in equation 8.
Ctr = ΔFtr/ΔIOP
Thus, in order to measure the trabecular outflow facility, Ctr, one must only measure ΔFtr and ΔIOP.
In conventional tonography, ΔIOP is equal to the mean increase above the baseline intraocular pressure produced by the tonometer. Measurement of ΔFtr is based on the change in the volume of the globe during tonography. This change in volume of the globe is indirectly derived from the change in intraocular pressure that occurs during the 4-minute tonography period. The relationship between the volume of the globe and the intraocular pressure, although somewhat controversial, has been reasonably well worked out.25,26 The intraocular volume decrease determined by tonography is assumed to be equal to the magnitude of the flow of aqueous humor across the trabecular meshwork in excess of the normal rate of flow.
Overestimations of the trabecular meshwork flow, Ftr, could result if (i) part of the intraocular volume decrease during tonography were caused by increased flow of fluid leaving the eye by nontrabecular meshwork routes (e.g., if blood and extracellular fluid were squeezed out of the choroid) and (ii) the rate of aqueous humor secretion were decreased during tonography. These and possibly other sources of overestimation seem to occur. Overestimation errors are collectively referred to as pseudofacility. As shown by equation 9, the difference between the total outflow facility measured by tonography, Ctot, and the trabecular outflow facility, Ctr, equals the pseudofacility, Cps.27
Cps = Ctot – Ctr
Changes in outflow facility determined by tonography could be caused by either a change in Ctr, as is usually assumed, or a change in Cps, or both.
Attempts have been made to measure Cps in humans by measuring the relationship between an induced increase in episcleral venous pressure and the resultant increase in intraocular pressure.28,29 However, this method is fraught with potential artifacts and therefore is of limited usefulness.
An attempt to determine human Ctr noninvasively has been made by Yablonski and co-workers.30,31 They used fluorophotometry to measure ΔFtr after administration of a β-blocker and/or a carbonic anhydrase inhibitor. With the measurement of the concomitant ΔIOP, assumed to be entirely caused by decreased aqueous humor formation, Ctr was determined using equation 8. This method avoids the confounding influence of Cps and ocular rigidity; however, because of inherent variability, its main use is in studies of many subjects rather than of individuals.
Invasive methods of tonography have been used in experimental animals.22,32,33 These methods involve cannulation of the anterior chamber and thereby permit direct measurement of ΔFtr caused by ΔIOP without having to deduce volume changes from intraocular pressure changes. These methods also permit the injection of tracers into the anterior chamber and thus increase the capabilities of these studies; however, the invasive techniques also create artifacts caused by anesthesia, a variable inflammatory response, and penetration of the globe, that are not present in noninvasive procedures.22,34
The value of (IOP – Pcs) in equation 7 is the outflow pressure, the driving force for fluid flow into the canal of Schlemn. The value of Pcs is assumed to be nearly equal to the value of the episcleral venous pressure, which is approximately 10 mm Hg; therefore, a change in intraocular pressure from 16 mm Hg to 12 mm Hg represents a 25% decrease in intraocular pressure but a 67% decrease in outflow pressure. On the other hand, a decrease in intraocular pressure from 40 mm Hg to 30 mm Hg is also a 25% decrease in intraocular pressure but only a 33% decrease in outflow pressure. When studying drugs that affect the trabecular outflow, it is more meaningful to express changes in the steady-state condition as percent changes in outflow pressure rather than as percent changes in intraocular pressure.
Uveoscleral Outflow
In 1937, after the injection of indigo carmine dye into the anterior chambers of rabbits, von-Seidel noted staining in the sclera and uvea.35 Thirty years later in an experimental primate model, Bill36,37 identified the alternate (uveoscleral) outflow pathway with a description of the consecutive progression of radiolabeled aqueous humor from the anterior chamber through the interstitial spaces of the ciliary body muscle to the suprachoroidal space and though the sclera. Some fluid is removed by the ciliary body capillaries38 and a strong case has been made by Yablonski39 for the final route of uveoscleral flow to be largely into the uveal blood rather than entirely across the sclera. The basis for this hypothesis is the large protein colloid osmotic pressure difference between the uveal blood and aqueous humor which would act as a strong driving force for aqueous humor flow into the uveal capillaries. According to this hypothesis the term uveoscleral flow is a misnomer because most of the flow is not across the sclera. It has similarly been suggested that pressure-insensitive outflow is a better term.40 Nevertheless, we will continue to use the term uveoscleral outflow in this chapter in order to be consistent with the rest of the literature. Direct measurement of uveoscleral outflow involves the use of radiolabeled tracers, is invasive and requires a disturbance to the eye. Uveoscleral flow of tracer molecules injected into primate eyes accounted for 30% to 50% of the total aqueous humor egress.41 Bill42 identified twelve human eyes that were to undergo medically necessary enucleation for suspected and/or confirmed malignant melanoma. Prior to enucleation, Bill injected 131I-albumin into the eyes and, at carefully measured intervals, quantified the amount of radioactive tracer identified in the ocular tissues. The average amount of uveoscleral outflow was approximately 10%.
Data obtained using noninvasive indirect measurements suggest that uveoscleral outflow can vary significantly with changes in the pathophysiologic condition of the eye. In young, healthy human subjects, Townsend and Brubaker43 used tonography to determine that 36% of outflow occurred through the uveoscleral pathway. In a fluorophotometry study comparing the rates of uveoscleral outflow in young and elderly nonglaucomatous people, Toris et al44 calculated that the uveoscleral outflow accounts for 54% of the total outflow in the young, and 46% of the total outflow in elderly. The 54% of outflow that is uveoscleral in young humans (n = 51) is consistent with earlier data from tracer experiments in young monkeys.45 In contrast, fluorophotometry showed 23% of the aqueous passed through the uveoscleral pathway of ocular hypertensive patients.46
Eyes with primary open-angle glaucoma (n = 15) treated with maximally tolerated medical therapy have fluorophotometry measured uveoscleral flow rates that are 73% of total outflow,30 which suggests high resistance in the trabecular meshwork may result in the therapeutic redirection of aqueous to the uveoscleral pathway.
Episcleral Venous Pressure
In 1901 scientists postulated that the aqueous humor drains into the episcleral veins.47 This theory was substantiated 20 years later by Uribe-Troncoso48 and von Seidel49 with their independent descriptions of the movement of aqueous humor from the anterior chamber to the episcleral veins in rabbits. Aqueous humor was identified in the episcleral veins by Ascher.50,51,52
Although there are different methods to measure the episcleral venous pressure (Pev), all are rooted in the principle introduced by von Seidel53 that the intravascular pressure of the vein will be equal to the amount of external pressure necessary to elicit a change in the caliber of that vein. This theory assumes that vein walls have negligible rigidity and tension, and therefore, the vein will not become reduced in caliber until the extravascular pressure exceeds the intravascular pressure. Brubaker54 corroborated this assumption with the observation that episcleral venous pressures measured by external compression of the vein correlated with the venous pressures measured by vessel cannulation. Episcleral venous pressure may vary up to 1 mm Hg with changes in posture.55,56 Regardless, most studies conclude that Pev is normally 8 to 12 mm Hg in humans.57 In most forms of glaucoma, the episcleral venous pressure remains relatively stable.55,58,59
The factors influence obtaining accurate measurements of episcleral venous pressure in humans: (i) identifying the correct vessel, (ii) applying the measurement device at an appropriate position over the vessel, and (ii) the determination of the end point. To obtain the most accurate representation of the pressure of the canal of Schlemm, the episcleral venous pressure should be measured in an aqueous- containing vein. Aqueous veins originate at the limbus and are paler than the blood filled episcleral veins. Zeimer60 suggests placing the measurement device slightly distal to the junction of the aqueous and episcleral vein. If these vessels are difficult to visualize, the device can be placed 3 mm distal to the limbus. Proposed end points60,61,62,63 range from the first visible change in the vessel,55,64,65 either in color or shape, to the complete occlusion of the vessel.54 The controversy centers on how much of a change in vein appearance best represents just exceeding the episcleral venous pressure. In the same eye, different endpoints produce different results. The excess increase in external pressure required to reach the first detectible change in caliber of the vein has been reported to be 0.25 to 2 mm Hg.55,62 As much as 7 mm Hg64 more may be required to fully collapse the vein. The end point measured as either a 50% reduction in the color or width of the vessel is generally accepted as an appropriate choice.57
Stay updated, free articles. Join our Telegram channel

Full access? Get Clinical Tree


