Measuring Vision and Vision Loss
August Colenbrander
PART 1. INTRODUCTION: ASPECTS OF VISION LOSS
In epidemiology, as in individual health care, it is important to know both the cause and nature of a condition, and also the severity of its impact and of its functional consequences. In the case of ophthalmology, the question is how to assess how eye diseases and other conditions affect the complex entity that is called “vision.” This chapter discusses the accurate measurement of various aspects of vision and of visual functioning, with the ultimate objective of enhancing the patient’s quality of life (QOL).
ASPECTS OF VISION LOSS
Vision loss can be observed from many different points of view. Each point of view reveals a different aspect. Consider a patient with age-related macular degeneration (ARMD), who wants to make an appointment. The front desk will think about when to schedule her. The doctor will think about which treatment to select. The office manager may worry whether the insurance will pay. The daughter worries whether mother can still drive. These aspects are very different, but they all belong to the same clinical case. Each of these aspects tells us something about the subject, but also gives us insight in the point of view of the beholder.
Similarly, when considering visual functioning, we can perceive many different aspects of vision loss, depending on our point of view (Fig. 51.1).
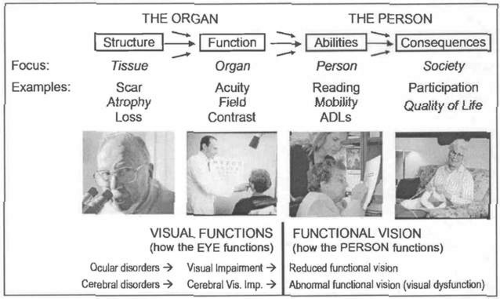 Figure 51.1. Aspects of visual functioning. Visual functioning can be approached from different points of view. Depending on our point of view, we will see different aspects (see text). The arrows indicate relationships between the aspects, but these relationships are not fixed. The oblique arrows indicate that other influences (including rehabilitation) can modify the relationships. Without this flexibility, adaptation and rehabilitation would not be possible. |
First, we may consider how various causes can result in structural changes, such as scarring, atrophy, or loss. Here the focus is on the tissue and the pathologist needs to examine these changes.
However, the structural changes in its components do not tell us how well the eye as a whole functions. We need to widen our view from the tissue to the organ. A clinician needs to measure aspects of organ function, such as visual acuity, visual field, contrast sensitivity, and so forth.
Yet, knowing how the eye functions, does not tell us how the person functions, so we need to widen our perspective again, this time to the person level. We need to consider tasks, such as reading, mobility, face recognition. Here, various vision rehabilitation professionals need to work with the patient.
Beyond that, we need to look at the person in a societal context. Do these changes have an impact on the person’s participation in society, causing job loss or a reduced quality of life? How can we be sure that the patient is satisfied, which should be the end goal of all our interventions?
It is useful to draw a line in the middle of Figure 51.1; on the left side, we speak of visual functions, which describe how the eyes and the visual system function; on the right side we speak of functional vision, which describes how the person functions. When organ functions are reduced, we speak of impairments. Most common are ocular visual impairments caused by ocular disorders; they constitute the traditional domain of ophthalmology. More recently, increased attention is being paid to cerebral disorders, which can cause cerebral visual impairment. In infants and children, the cause may be perinatal cerebral ischemia; in adults it may be traumatic brain injury; and in the elderly it may be the result of a stroke. Cerebral visual impairments can cause abnormal visual functioning, which can be captured under the term of visual dysfunction.
Various activities may cover more than one aspect. When we consider reading, the measurement of the threshold print size refers to organ function. Measures such as critical (or optimal) print size,1 reading speed (words per minute), and reading endurance (hours per day) describe abilities of the person. Reading enjoyment, finally, is an aspect of QOL.
Anatomic and Structural Changes
The first column of Figure 51.1[AC1] describes the underlying disorders or diseases. At the organ level, all forms of vision involve three distinct stages.
First is the optical stage, where the optical components of the eye deliver an image of the outside world to the retina. This stage can be disrupted by opacities or refractive errors. Dealing with these problems by prescribing glasses or by removing cataracts has for centuries been a mainstay of ophthalmic practice.
Next is the receptor stage, where receptors in the outer retina transform the image into neural impulses. Ophthalmoscopy and slit-lamp biomicroscopy have given ophthalmology tools to describe anatomic changes at this level in more detail than is possible for most other organ systems. This stage can be disrupted by various retinal diseases, which today demand an increasing proportion of the ophthalmologist’s time and attention.
Third is the neural processing, which starts in the inner retina and proceeds through the visual cortex to higher visual centers and eventually gives rise to functional vision and vision-related functioning.
Most of the ophthalmic literature, including this textbook, is devoted to the first two stages. Until recently, the third stage has often been overlooked. Each of these stages involves different anatomic structures and different functional mechanisms, which can create different problems and need different therapeutic approaches
Visual Functions
Visual functions describes functional changes at the organ level. Here again, ophthalmology has developed unique tools that can measure visual functions with great precision. The most commonly measured functions that have the greatest impact on general functioning are visual acuity and visual field, followed by contrast sensitivity. Many other functions, such as color vision, stereopsis, light and dark adaptation, and their psychophysical and electrophysiologic tests (electroretinogram [ERG], visual evoked potential [VEP]) are discussed in other chapters.
Reflecting that the organ function column is flanked by two other columns, organ function measurements can be used for two purposes: to assist in diagnosing the underlying disorder (to the left in Fig. 51.1) or to predict the functional consequences (to the right in Fig. 51.1). Different tests perform differently in this regard. Tests such as ERG and VEP are helpful in diagnosing the underlying condition, but are poor predictors of the functional consequences. Visual acuity loss can have many different causes; this means that it is a good screening test, but adds little to the differential diagnosis. Yet, whatever its cause, it can help in predicting the impact on activities of daily living (ADL). Similar differences exist for other tests: the Ishihara color test is good at diagnosing even minor red-green deficiencies for genetic studies, but overestimates the functional consequences. The D15 color test, on the other hand, was designed to detect only those defects that might have functional consequences. The discussion in this chapter will be mainly oriented toward functional consequences.
Functional Vision
Functional vision reaches beyond the description of organ function by describing the skills and abilities of the individual. It describes how well the individual is able to perform various ADL. This aspect has been described under different names. In the field of vision, the term functional vision is used. In International Classification of Impairments, Disabilities and Handicaps (ICIDH)2 loss (or lack) of ability was described as dis-ability. Its successor, International Classification of Functioning, Disability and Health (ICF)3 uses the term activities. Activities and abilities are two sides of the same coin, describing one without the other is meaningless.
Again, the columns on either side help to clarify different ways in which this aspect can be approached. On the left are the available resources (e.g., vision, touch, hearing); they define the ability aspect and are important when defining the means to be used in a rehabilitation plan. Should we facilitate reading with magnification (vision), with Braille (touch), or with talking books (hearing)? The activity aspect, to the right, relates to the societal goal of the action, to participation and QOL. This is important in defining the needs and objectives of the rehabilitation plan.
Societal and Economic Consequences
The last aspect in Figure 51.1 describes the societal and economic consequences for the individual caused by a loss of ability. In ICIDH, this aspect is described as handicap and measured in terms of loss of independence; in ICF, it is described under the heading participation, which points to interdependence in a societal context. Handicaps need not preclude participation. The story of Helen Keller is one example of how some people can achieve full participation despite extraordinary handicaps. This aspect is also described as quality of life.
Although ability describes what people can do, participation describes whether they actually do it. Participation can be described fairly objectively. Quality of life, on the other hand, refers to a highly subjective experience. QOL depends not only on individual factors, it also depends on factors in the environment.
Improving the participation and quality of life aspect is the ultimate goal of all medical and social interventions. Clearly links exist between the aspects: disorders may cause impairments, impairments may cause a loss of abilities, loss of abilities may cause a lack of participation. However, these links are not rigid. Medical and surgical interventions can reduce the impairment caused by a disorder. Assistive devices and special training may improve abilities in the face of a given impairment. Changes in the human and physical environment may increase participation, regardless of reduced abilities. The art of comprehensive rehabilitation is to manipulate each of these links so that a given disorder results in the least possible loss of participation and the best possible QOL. Comprehensive vision rehabilitation (Fig. 51.46)[AC2] involves much more than traditional low vision care. An orthopedist could not function without the help of physical therapists, prosthetists and others. Similarly, ophthalmologists must reach out to other professions to offer their patients comprehensive rehabilitation.
MEASUREMENT AND ASSESSMENT
The different functional aspects are measured and assessed in very different ways.
Under the aspect of visual functions (Fig. 51.2, left), we measure parameters that define how the eye functions. We do this by varying one parameter at a time in a simplified, artificial environment. Consider that the visibility of test objects depends on their size, contrast, and illumination. If we vary the size, while keeping contrast and illumination constant, we create a letter chart to measure visual acuity. If we vary the contrast, while keeping size and illumination constant, we create a contrast sensitivity test, such as the Pelli-Robson4 or Mars cards.5 If we vary the illumination, while keeping size and contrast constant, we perform a dark adaptation test. Each of these three different tests provides us with a threshold value for the measured stimulus parameter. The threshold criterion is generally defined as the response level that is 50% above guessing. Threshold measurements are chosen, not because threshold performance is the most relevant performance level for ADL, but because they enable more precise psychophysical calculations.
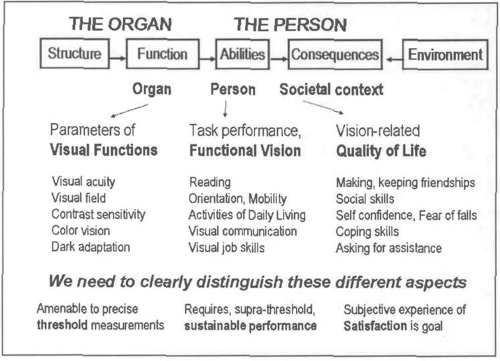 Figure 51.2. Assessment of visual functioning. The different aspects of visual functioning require different approaches for their assessment (see text). Their assessment should not be mixed. |
Under the aspect of functional vision (Fig. 51.2, center), we must assess how the person functions. To do this, we must focus our attention on visual skills and abilities, such as reading, orientation and mobility (O+M), and ADL. Such tasks always involve multiple parameters, which can vary independently and which cannot be manipulated separately. Measuring functional vision, therefore, is more complex than measuring visual functions. Also notice, we are no longer interested in threshold performance, but in sustainable, suprathreshold performance. When reading a book, print size, contrast, and illumination all need to be well above threshold, to provide a comfortable performance reserve.6
For visual functions, we measure the variable stimulus needed for a fixed response; for functional vision, we measure the variable performance for a fixed task, either objectively (timing, error rate) or subjectively (questionnaires).
Finally, we must consider the societal context, also described as “quality of life” (Fig. 51.2, right). For subjective judgments (e.g., making and keeping friendships, social skills, self confidence), the concept of measurement is even more difficult. When we move a New Yorker to a small rural community, and a rural farmer to the middle of Manhattan, both will complain that their quality of life has deteriorated. The ultimate goal can best be described with the word “satisfaction,” which describes the subjective balance between individual achievements and individual expectations.
Part 2 of this chapter will deal with the measurement of visual functions, (how the eye functions); part 3 will deal with the assessment of functional vision and QOL (how the person functions).
Among visual functions, visual acuity measurement is most prominent. Different visual acuity-related functions are measured on different scales. This can lead to confusion when each of these different scales is labeled with the same undifferentiated term “vision.”
There are two ways in which the scales differ. Some scales measure vision loss; on these scales higher numbers indicate poorer vision; other scales measure functioning; on these scales higher numbers indicate better vision. The other difference is between scales with an arithmetic (linear) progression (e.g., 0, 1, 2, 3, 4, 5) and scales with a geometric (logarithmic) progression (e.g., 1, 2, 4, 8, 16, 32). The first type is used to describe the performance of the eye (M-units, viewing distance, magnification requirement [MAR], visual acuity [VA]); the second type is used to estimate the performance of the person (logMAR, log(VA) = – logMAR, VAS). Figure 51.3 previews and compares various scales and measurement units that will be discussed.
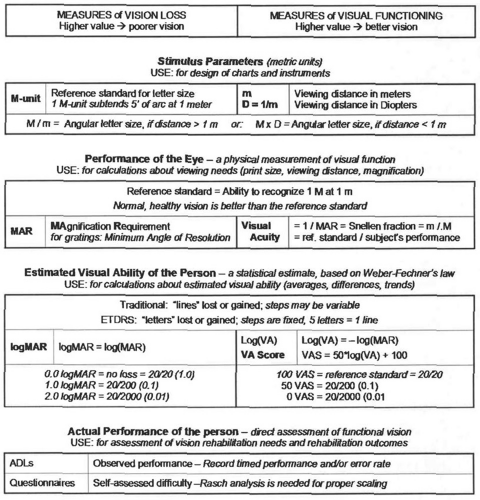 Figure 51.3. Visual acuity related scales of visual functioning. Visual acuity measurement starts with defining the stimulus parameters: symbol size and viewing distance. The reference standard for size was defined by Snellen; the name “M-unit” was coined by Sloan. The reference standard for distance is the meter and its reciprocal, the diopter. Given these parameters, we can describe how the eye functions by calculating the MAgnification Requirement (MAR) needed to bring the subject to the performance standard. MAR provides a scale of vision loss that can range up to very high numbers; its reciprocal, the visual acuity value, provides a scale of visual function limited to the range from 0 to 1.0 (the reference standard) and somewhat beyond. The MAR and visual acuity scales are useful for calculations of viewing distance, print size, and magnification need. From these linear measurement of visual function (how the eye functions), we can derive a statistical estimate of the person’s visual ability (functional vision, how the person may function). This is done by taking the logarithm of the measurements in accordance with Weber-Fechner’s law,42 which states that a proportional increase in stimulus intensity produces a linear increase in sensation. As with MAR, logMAR is a scale of vision loss; higher values indicate poorer performance; as with visual acuity, the visual acuity score (VAS) is a scale of visual functioning; higher values indicate better performance. 0 logMAR = standard vision; 0 VA = blindness. Statistical ability estimates can be used to average across a population, to determine the difference between groups or to detect trends. They are also useful for administrative use, but not for vision rehabilitation, because individual performance may be much better or much worse than the statistical average. To determine the need for rehabilitation and to assess its outcomes, direct assessment of actual individual performance is needed. This can be done through observations or through questions about the difficulties that are experienced. At this level, using visual acuity based scales is no longer meaningful. |
PART 2. MEASURING VISUAL FUNCTIONS
Visual Functions describe how the eye and the basic visual system function. They are measured, one parameter at a time, in an artificial test environment. In this chapter are discussed the parameters that are considered most relevant to functioning in the real world: visual acuity, visual field, and contrast sensitivity. Other functions, such as color vision, stereopsis, dark adaptation, and electrophysiologic functions, such as electroencephalogram (EEG), ERG, and VEP are discussed in other chapters.
PART 2-A. VISUAL ACUITY MEASUREMENT
BASIC CONCEPTS
The visual function that is measured most easily and most often is visual acuity. The clinical testing of visual acuity, based on letter recognition, using a letter chart or similar technique is discussed in this chapter. Other aspects, such as light detection, two-line separation, Vernier acuity, and other types of hyper acuity are discussed in other chapters.
Because letter chart acuity is measured so often, a common misconception is that visual acuity would define the quality of vision in general or even the ability to function visually. This is not true. Visual acuity is only one of many parameters that describe aspects of vision.
Letter chart testing compares the smallest line seen by the subject to a reference standard (i.e. the line that can just be seen by a person with “standard” vision. Letter chart testing thus determines the MAgnification requirement (MAR) for the recognition of detail; the reciprocal of this value is known as visual acuity (VA = 1/MAR). A subject, who needs characters or symbols that are twice as large, is said to have a visual acuity of 1/2 (20/40, 0.5). Conversely, a subject with a visual acuity of 1/5 (20/100, 0.2) needs letters that are five times larger.
The ability to recognize letters or other symbols depends on the size of their retinal image. That size depends on the ratio of the size of the object to its viewing distance. Visual acuity, therefore, defines the visual angle under which an object is seen, not its absolute size. When the size of a test object is made 10 times larger, and the viewing distance is also made 10 times longer, the visual angle remains the same. When a constant object is brought twice as close, its visual angle becomes twice as large.
Snellen fractions express this as (Fig. 51.6):[AC3]
He expressed the optotype sizes indirectly as “the distance at which they subtend 5 arc min.”
Letter recognition is a rather complex function; a normal test result requires proper functioning of all three stages of vision: a healthy optical system to produce a sharp retinal image, healthy retinal receptors to transform that image to neural impulses, and a healthy nervous system to analyze and recognize the image. Testing also requires the motor ability to respond. Many different disorders can thus result in poor test results. Because of this, visual acuity is a good screening test, but it is not a good diagnostic test. Other tests (e.g., ophthalmoscopy) are needed for the differential diagnosis. Furthermore, letter chart acuity only informs us about the tiny retinal area where the letter or symbol is projected; it does not tell us anything about the surrounding or peripheral retina.
We will discuss how the current charts evolved, and then consider the requirements for accurate measurement.
HISTORICAL DEVELOPMENTS
Reading tests have been used since before the Middle Ages to test the function of the eye. Major changes started to occur in the middle of the 19th century.
1843. In 1843 Kuechler, a German ophthalmologist in Darmstadt, wrote a treatise advocating the need for standardized vision tests.7 He developed a set of three charts, to avoid memorization. He was a decade too early, however, and his work was almost completely forgotten.
1850. Around 1850 started what would later be called the Golden Age of Ophthalmology. In 1850, Donders,8 from Utrecht, the Netherlands, (Fig. 51.4) visited William Bowman,9 of anatomic and histologic fame, at an international conference in London. There, he met Albrecht von Graefe,10 who would become the father of German clinical ophthalmology. Donders and von Graefe became lifelong friends. With Bowman and Hermann von Helmholtz,11 who invented the ophthalmoscope in 1851, they became the foursome that would lead ophthalmology to become the first organ-oriented specialty.
 Figure 51.4. Franciscus Cornelis Donders (1818-1889) grew up under difficult circumstances (his father died before he was 1 year of age) and received his first education in a village school, where the village schoolmaster triggered his lifelong intellectual inquisitiveness. He went on to university study and, at age 29, saw a special chair in Physiology created for him at the Medical School of Utrecht University, the total faculty of which had only four members at the time. He developed an interest in the physiology of the eye and after the experience quoted below, decided to devote his life to ophthalmology. He not only was an excellent scientist, he also had a strong social conscience. In 1852, after his return from London he privately founded an “Eye Infirmary for the Indigent,” which in 1858 became an independent foundation. Donder’s most renowned work would become his book “The Anomalies of Accommodation and Refraction,” in which he unraveled the difference between asthenopia and hyperopia and put the correction of refractive error on a scientific footing. Donders was a gifted teacher and explained his topics in ways understandable to practitioners. In 1850, he visited London, where he met Bowman and von Graefe. He later wrote, “I had just seen Jaeger [Friedrich, Eduard’s father] performing cataract surgery alternately with the left and the right hand, when a young man stormed into the room embracing his preceptor. It was Albrecht von Graefe. Jaeger thought that we would fit well together and we soon agreed. Those were memorable days. Von Graefe was my guide for all we heard in practical matters, and in scientific matters he listened eagerly to the smallest detail. We lived together for a month to separate as brothers. To have William Bowman and Albrecht von Graefe as friends became an incredible treasure on my life’s path.” |
1854. Thus, the scene had changed considerably when Eduard von Jaeger (Fig. 51.5), in Vienna, published a set of reading samples,12 initially as an appendix to his book about Cataract and Cataract Surgery.13 He labeled his reading samples with the catalogue numbers from the Vienna State Printing House. They became an immediate international success as a means for documenting functional vision and will be discussed in detail later[AC4].
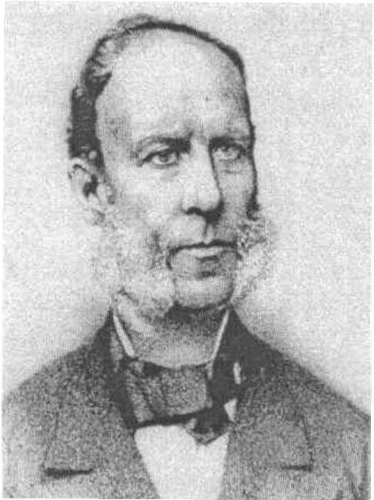 Figure 51.5. Eduard von Jaeger. Eduard Jaeger, Ritter von Jaxtthal (1818-1884) was born into a prominent family of Viennese ophthalmologists. His father, Friedrich, was one of the most distinguished ophthalmologists of his days; Donders met him in London in 1850. In addition to his reading samples, Eduard is known for an early Atlas of the Ocular Fundus. He was a strong advocate for the use of Helmholtz’s direct ophthalmoscope and spent many hours making very detailed drawings. He may have inherited his artistic talent from his mother, who was a recognized artist and daughter of another ophthalmologist. Because his reading samples had no external standard, except the catalogue of the Vienna State Printing House, others could only imitate them with locally available fonts. This explains the enormous variability among later imitations (Fig. 51.23). While Snellen’s emphasis was on measuring visual acuity, Jaeger emphasized reading ability; this may be one of the reasons why he steadfastly refused to add Snellen’s letter size notation to his reading samples. |
1861. Meanwhile, Donders was working on his epoch making studies on refraction and accommodation,14 in which he clarified the nature of hyperopia as a refractive error, rather than as a form of “asthenopia” (“weakness of the eyes”), bringing the prescription of glasses from trial and error at the county fair to a scientific routine.
For this work, Donders not only needed reading samples for presbyopes, but also distance targets to determine the refractive error of myopes and hyperopes. He had used some of the larger type samples from Jaeger’s publication as a distance target; however, he felt the need for a more scientific method and for a measurement unit to measure visual function. Using the term “visual acuity” to describe the “sharpness of vision,” he defined it as the ratio between a subject’s performance and a reference standard [see Basic Concepts][AC5]. In 1861,15 he proposed his formula (Fig. 51.6) and asked his coworker and later successor Herman Snellen to devise a measurement tool.
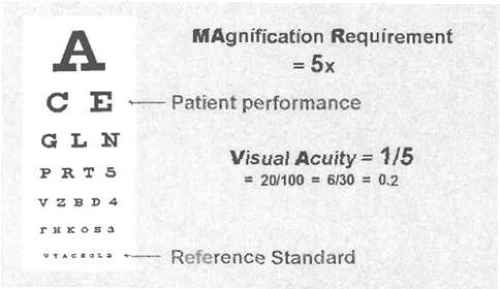 Figure 51.6. Donders’ formula. Donders compared the letter size just recognized by the patient to a reference standard, the size recognized by a standard person. The visual acuity is the reciprocal of this value. (Angular) Size seen by subject/Size of reference standard = MAgnification Requirement Visual Acuity = 1/MAgnification Requirement MAgnification Requirement: 2× Visual Acuity: 1/2 0.5 20/40 4× 1/4 0.25 20/80 10× 1/10 0.1 20/200 Note that his reference standard is based on a physical measurement (letter height 5 min of arc). This choice was partly inspired by the work of the English astronomer Robert Hooke, who, two centuries earlier120 had found that the human eye can separate double stars when they are 1 min of arc apart. Because Snellen chose an external, physical standard, others could accurately reproduce his charts. |
1862. The next year, 1862, Snellen (Fig. 51.7) published his letter chart.16 His most significant decision was not to use existing typefaces, but to design special targets for visual acuity measurement, which he called optotypes. He experimented with various targets designed on a 5 × 5 grid (Fig. 51.7, center). Eventually, he chose letters (Fig. 51.7, right). Some others also published charts based on Donders’ formula, but used existing typefaces rather than optotypes. Snellen’s chart prevailed and spread quickly around the world. One of the early big orders came from the British army, wanting to standardize the testing of recruits.
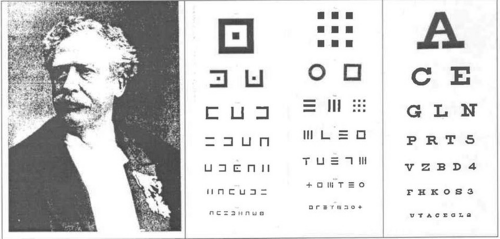 Figure 51.7. Herman Snellen and his charts. Donders had chosen Herman Snellen, Sr. (1834-1908) as the codirector for his eye infirmary. Snellen would later become his successor. Donders was a scientist and teacher, Snellen was practically oriented and was an excellent surgeon. The center images show two of Snellen’s experimental charts, preserved in the Museum of the University of Utrecht. On the right is his chart as published in 1862. Snellen advocated a fractional visual acuity notation V = d/D, in which d = actual viewing distance in any measurement unit, and D = distance at which the optotype subtends 5 min of arc. Louise Sloan introduced the name M-unit and changed the formula to V = m/M, to make use of the metric system explicit and avoid confusion with D = diopters. Today, actual Snellen fractions are rarely used and are most often replaced by Snellen equivalents (Fig. 51.18). See Figure 51.15 to compare the letter size progressions on Snellen’s charts to those used today. |
To implement Donders’ formula, Snellen defined as the reference standard, the ability to recognize one of his optotypes when it subtended 5 min of arc with a stroke width of 1 min of arc. Because Snellen chose an external, physical standard, others could accurately reproduce his charts.
On his charts, Snellen marked the letter size for each line (the distance at which the optotypes subtend 5′ of arc); this is the denominator of the Snellen fraction for that line. He left it to the user to supply the viewing distance as the numerator (Fig. 51.18).[AC6]
Donders and Snellen were well aware that their reference standard represented less than perfect vision and that normal, healthy eyes could do better. It is wrong, therefore, to refer to the reference standard of “20/20” (1.0) as “normal” vision, let alone as “perfect” vision. Indeed, the connection between normal vision and the reference standard is no closer than the connection between the standard American foot and the average length of “normal” American feet.
From his studies on refraction and accommodation and related topics, Donders knew that normal acuity decreases with age. While Snellen was preparing his chart, Donders commissioned a study by one of his doctoral students to document the changes with age,17 using prototypes of Snellen’s symbols. The study was published in 1862, the same year that Snellen published his chart. The similarity with more recent data (Fig. 51.8) is remarkable.
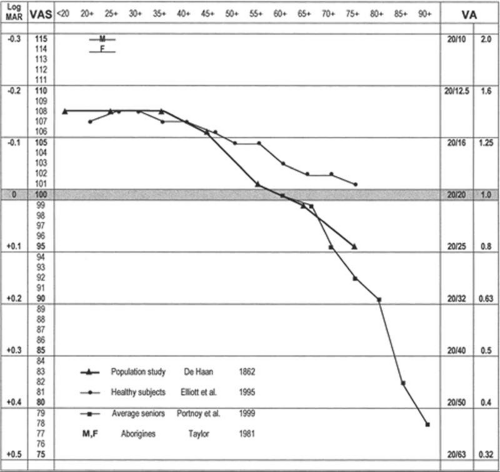 Figure 51.8. Visual acuity and age. This chart compares the relationship between visual acuity and age in various studies. The horizontal bands represent one-line intervals on a standard chart with logarithmic progression. The dark band represents the reference standard (20/20, 6/6, 1.0). The ▲ markers show the data from de Haan’s study in1862. The • markers show a recent meta-analysis of healthy subjects participating in various research protocols.121 The coincidence in the younger age groups is striking. In the older groups, the recent data show better visual acuity, because the research protocols rejected subjects with any pathology. The ▪ markers refer to a recent study of an unselected older population.122 The coincidence with the data from 1862 is, again, striking. No change occurred in the average acuity with age over a century and a half. The data show that until 60 or 70 years of age normal vision for Caucasians is substantially better than the reference standard. The “M” and “F” symbols near the top of the chart indicate even better visual acuities for male and female Australian aborigines.32 |
Since Snellen’s days few major improvements in visual acuity measurement have been made. Many tried to devise better optotypes, but, as Bennet remarked in an exhaustive review of historical developments,18 while preparing for the British standard of 1968,19 “the road of visual acuity measurement is littered with stillborn charts.” Some developments, however, are worth mentioning.
1868. John Green of St. Louis had traveled Europe after his training in Boston, and had spent some time with Donders and Snellen, where he wrote a small paper about the measurement of astigmatism. In 1868, he presented a new chart to the American Ophthalmological Society,20,21 modifying a prior proposal from 1867 (Fig. 51.9).
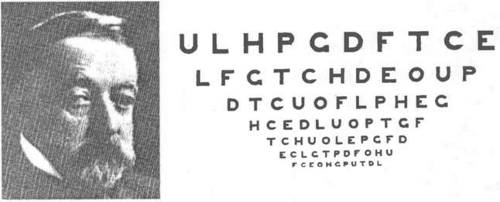 Figure 51.9. John Green and his chart. The lower lines of Green’s chart are shown. Note that he combined sans-serif letters and proportional spacing with a geometric progression, principles that a century later would be incorporated in international standards. Green – 1868 Current Standard (ETDRS) Proportional spacing Proportional spacing Sans-serif letters Sans-serif letters Up to 11 letters / line 5 letters each line Too early-forgotten International standard |
Green’s chart featured sans-serif letters (Snellen used letters with serifs), proportional spacing of the characters, and a geometric progression of letter sizes (10 steps = 10); on the smaller lines, he used a fixed number of letters per line, all features that are now part of standardized letter chart design (Fig. 51.9). He was a century too early; his proposals gained little acceptance. Green went back to letters with serifs, because letters without serifs were said to “look unfinished.” A century later, the British standard would choose sans-serif letters, because letters with serifs “look old fashioned.”
1875. Snellen originally calibrated his charts in Parisian feet. In the 1860s there were some 20 different measurement systems used in Europe. It is not surprising that the uniform Metric system22 was gaining ground. When the Treaty of the Meter was signed in 1875, Snellen changed the distance for his charts to 5 m, for adherents of the decimal system, or to 6 m for those who wanted to stay closer to 20 Parisian feet. Today, the 20-ft distance prevails in the United States; 6 m prevails in Britain, and a 5-M distance is commonly used in continental Europe.
1875. Because comparing the visual acuity values for different distances is awkward, when using Snellen’s fractional notation, Felix Monoyer of Lyons, France, proposed replacing the fractional notation with its decimal equivalent (e.g., 20/40 = 0.5, 6/12 = 0.5, 5/10 = 0.5).23 His decimal notation (Fig. 51.10) made it simple to compare visual acuity values, regardless of the original measurement distance and is commonly used in Europe.
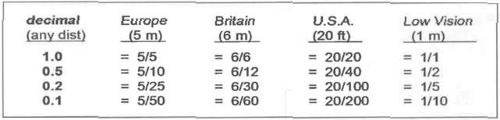 Figure 51.10. Decimal and other visual acuity notations. In true Snellen fractions, the numerator indicates the test distance: 5 m is commonly used in Europe, 6 m in Britain, and 20 ft in the United States. For patients with low vision, a 1-m distance is recommended to extend the measurement range. When Snellen equivalents are used, the numerator is a standard value, regardless of the test distance. Decimal equivalents are common in Europe, 20/20 equivalents in the United States. See Figure 51.18 for a more extensive listing. |
1888. Edmund Landolt had worked with Snellen in Utrecht and later became professor of ophthalmology in Paris. In 1874 Snellen and Landolt had cooperated in publishing a major chapter on “optometrology,”24 the science of measuring vision. Recognizing that not all of Snellen’s optotypes were equally recognizable, Landolt, in 1888, proposed his broken ring symbol, which has only one element of detail and varies only in its orientation.25 Landolt’s Cs (Fig. 51.11) would become the preferred visual acuity measurement symbol for laboratory experiments, but gained only limited acceptance in clinical use.
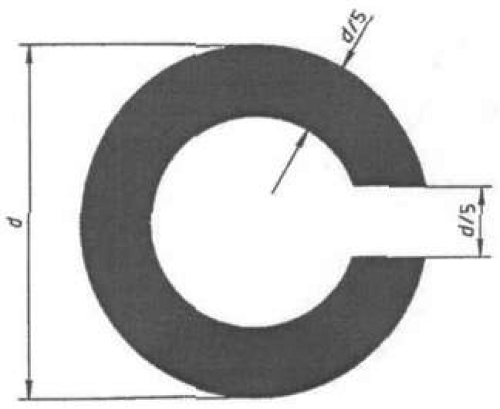 Figure 51.11. Landolt’s broken ring. Landolt’s “C” or broken ring is designed on Snellen’s 5 × 5 grid and has only one element of detail, the gap, which is 1 unit wide. It can be presented in four or in eight positions. |
Relatively little happened in the period that followed. Efforts at standardization were made, such as a standard proclaimed by the International Council of Ophthalmology in 1909,26 but such documents were filed and never gained a wide following. That clinicians did not feel an urgent need for standardization can be explained by the fact that the most common letter chart uses do not require it. For refractive correction, any set of targets will do, because the only question is “better or worse?” For screening, the distinction between “within normal limits” and “not within normal limits” is the most important. Snellen’s reference standard at the lower limit of normal vision is well positioned for screening purposes. For screening, the difference between 20/100 (0.2), 20/200 (0.1) and 20/400 (0.05) is unimportant; they all indicate a marked vision loss.
After World War II, the interest in low vision rehabilitation was gaining ground. It was recognized that most of those considered “industrially blind” actually had some level of useable vision. In 1953, the first low vision services were opened in New York at the Industrial Home for the Blind and at the New York Lighthouse. For rehabilitation purposes, the difference between 20/100, 20/200 and 20/400, which was unimportant for screening, became very important, because the patient with 20/200 needs twice as much magnification as the patient with 20/100 and the patient with 20/400 needs twice as much again. It is not surprising then, that major refinements in clinical visual acuity measurement came from clinicians involved in low vision rehabilitation.
1959. In 1959, Louise Sloan, the founder of the Low Vision Service at the Wilmer Eye Institute of Johns Hopkins University designed a new optotype set of ten letters27 (Fig. 51.12). She chose sans-serif letters, while maintaining Snellen’s 5 × 5 grid. She recognized that not all letters were equally recognizable and therefore proposed to use all ten letters on each line. This causes long lines, with many letter sizes requiring more than one physical line.
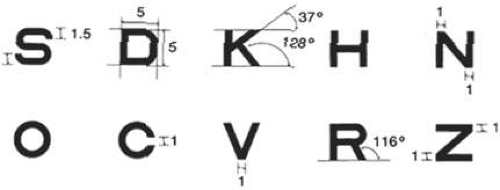 Figure 51.12. Sloan’s optotypes. Sloan designed a series of letters without serifs that are widely used in the United States. They were designed on Snellen’s 5 × 5 grid. Although the difficulty of individual letters varies, the average difficulty approximates that of Landolt C’s. |
Sloan also introduced the term “M-unit.” Snellen had defined visual acuity as:
V = d/D where d = test distance and D = “distance at which the letter subtends 5 min or arc.”
To make this definition less verbose and to avoid confusion with D = diopters, Sloan proposed:
V = m/M where m = test distance in meters and M = letter size in M-units.
1 M-unit subtends 5′ at 1 m (1.454 mm, about 1/16 in). Sloan’s M is thus equivalent to Snellen’s D, provided that the measurements are made in meters.
1974. In the 1960s, the World Health Organization (WHO) had surveyed national definitions of “legal blindness” and found that 65 countries used as many different definitions. In 1974, the World Health Assembly approved the 9th Revision of the International Classification of Diseases (ICD-9).28 In it, the old dichotomy between “legally sighted” and “legally blind” was abandoned for a series of ranges of vision loss. In the same year, the International Council of Ophthalmology (ICO)29 adopted the same ranges, extended them to include normal vision, and used the named ranges used in this chapter and in the International Classification of Diseases. 9th Revision: Clinical Modification (ICD-9-CM)30 (the United States extension of the WHO’s ICD-9) (Fig. 51.18).
1976. In 1976, Ian Bailey and Jan Lovie (then at the Kooyong Low Vision Service in Melbourne) published a new chart,31 featuring a novel layout with five letters on each row and spacing between letters and rows equal to the letter size. This layout standardized the crowding effect and the number of errors that could be made on each line. Thus, the letter size became the only variable between the acuity levels. Their charts have the shape of an inverted triangle and are much wider at the top than the traditional rectangular charts. Like Sloan, they followed a geometric progression of letter sizes.
That same year, Hugh Taylor, also in Melbourne, used these design principles for an illiterate E chart,32 used to study the visual acuity of Australian Aborigines. He found that, as a group, Australian Aborigines had significantly better visual acuity than Europeans (Fig. 51.8). This is another reason not to regard 20/20 visual acuity as normal or as perfect vision.
1982. Based on the above work, the National Eye Institute chose the Bailey-Lovie layout, implemented with Sloan letters, to establish a standardized method of visual acuity measurement for the Early Treatment of Diabetic Retinopathy Study (ETDRS).33 These charts were used in all subsequent clinical studies, and did much to familiarize the profession with the new layout and with the logarithmic progression (Fig. 51.13). Data from the ETDRS were later used for a revised set of charts where all lines have the same average difficulty.34 Because the Sloan letters (designed on Snellen’s 5 × 5 grid) are wider than the British letters (designed on a 4 × 5 grid) used by Bailey and Lovie, the ETDRS chart was designed for a 4-m distance, not the 6 m used by Bailey and Lovie.
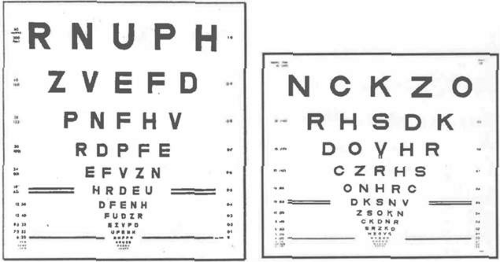 Figure 51.13. Bailey-Lovie and Early Treatment of Diabetic Retinopathy Study (ETDRS) charts. The ETDRS chart (right) implemented the layout of the Bailey-Lovie chart (left) with Sloan letters (Fig. 51.11). The Bailey-Lovie chart has 4 × 5 letters and goes to 60 M for use at 6 m; the ETDRS chart has 5 × 5 Sloan letters and goes to 40M for use at 4 m. Both follow the same logarithmic progression (Fig. 51.8). |
1984. The International Council of Ophthalmology approved a “Visual Acuity Measurement Standard,” which also incorporates the above features.35
2002. The International Council of Ophthalmology explicitly recommends the ETDRS protocol as the international standard in a report on “Aspects and Ranges of Vision Loss” that also asks attention to the aspects of vision loss beyond visual acuity.36
CONSIDERATIONS FOR LETTER CHART TESTING
Having discussed the historical developments, we turn to several aspects that need to be considered for letter chart design. This discussion will not be strictly limited to letters or to charts, but will consider all methods for presenting letters or other symbols at distances of 1 m (3 ft) or more.
Letter recognition, on which clinical visual acuity measurement is based, is a rather complex function, which involves optical, retinal, neural, and cognitive factors. The functional significance of visual acuity is best understood as the reciprocal of the MAgnification Requirement. The term MAR is best known for its logarithm (logMAR), which will be discussed later. The acronym MAR can be explained in different ways. It is often interpreted as Minimum Angle of Resolution. This term, although widely used, has two problems. Resolution refers mainly to the clarity of the retinal image (i.e., to the optical part of the process), whereas the reference to angle is more applicable to gratings than to letters, where shape, rather than just stroke width, affects the recognizability. Our interpretation of MAR as MAgnification Requirement emphasizes the functional significance, whether the cause is optical, retinal, or cerebral.
The MAR simply is the ratio of the smallest line the subject can see to the smallest line a person with standard vision can see (i.e., the 20/20 line). When measuring, it is important to keep all other, possibly confounding, stimulus parameters well above threshold. We will discuss cognitive factors, the choice of test distance, letter size progression, success criterion, contrast and illumination, visual acuity notation, and the choice of test symbols.
Cognitive Factors
The effect of cognitive factors should be minimized. For most adults, letter recognition is trivially easy. In cases where it is not (infants, preschool children, illiterate adults, stroke victims), we need to use other methods. We may consider grating detection or picture recognition. It is important to realize that these are different tasks, which may have different magnification requirements. Finally, the ability to respond may play a role. For some developmentally delayed individuals, the motor concept of directionality that is required to respond to tumbling Es may be a limiting factor. Comparing the results of tests with different modalities may provide some insight into such confounding factors. In elderly patients with a stroke and macular degeneration, the question may arise whether inability to read is the result of the macular degeneration or of the stroke. Better performance with larger print may point to an optical or retinal cause; if the confusion persists, this may point to the stroke. In the following discussions it will be assumed that cognitive and motor factors are indeed trivial.
Choice of Test Distance for General Practice
Most patients seen in ordinary practice have visual acuities in the range from normal to moderately impaired vision (MAR <5, VA >1/5, >20/100). Traditional chart designs reflect this emphasis on screening and on refractive use. In the near-normal range, the steps between letter sizes are small, for lower acuities they become larger; for acuities worse than 20/200 (0.1), vague statements such as “count fingers” and “hand motions” are used.
Because the magnification requirement is an angular measure, it can be measured at any distance, provided that the viewing distance is properly accounted for in the Snellen formula.
Snellen originally chose a test distance of 20 Parisian feet. Distance testing was chosen because it relaxes accommodation and because the optical difference with infinity may be ignored. Remember, the stimulus for the development of the letter chart came from Donders’ work on refraction. A long viewing distance also reduces the effect of any movements the subject may make. After the introduction of the metric system, many went to 5 m (convenient with the decimal system), others chose 6 m because it is close to 20 ft.
In 1973, Hofstetter proposed a 4-M test distance37 for use in smaller rooms. Sloan liked the 4-M distance because it made for easy conversion to a 40-cm reading distance. The ETDRS charts adopted it because charts with the Bailey-Lovie layout would have to be substantially wider if designed for 5 or 6 m. For visual acuity measurement, a 4-m distance is as valid as any other distance. However, at 4 m, the accommodative demand is 0.25 diopters (D) and can no longer be ignored. The alternative for small rooms is the use of mirrors.
For young children, a test distance of 3 m (10 ft) is often recommended, because it is easier for holding their attention. For this group, acuity measurement is the most important application; because of their ample accommodative ability, cyclopegic retinoscopy is the preferred mode for accurate refraction.
The above distances hold for printer charts, which have to be designed for a specific distance. The widespread use of projector charts, which can be adjusted for any distance, has been a strong factor for changing from the use of true Snellen fractions to Snellen equivalents (Fig. 51.18).
Choice of Test Distance for Low Vision
A much smaller group of patients has visual acuities in the low vision range (MAR >3, VA <1/3, <20/60). Snellen recognized that the steps for lower acuity values were rather large on his chart and recommended bringing the chart closer. A 2-M distance is sometimes used for this group by bringing a 4-M ETDRS chart half as close. At these short distances, small movements of the patient become significant. It is therefore more desirable to move even closer, to 1 m (40 in), where the test distance can be accurately controlled with a cord attached to the chart.38 Without a cord, a movement of only 10 cm (4 in) at 1 m would introduce a 10% error (half a visual acuity line) (Fig. 51-14).
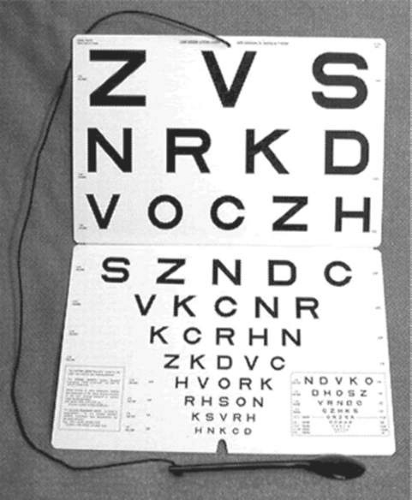 Figure 51.14. Low vision letter chart with cord for 1 m. This chart, designed for measurement at 1 m, allows accurate measurement of visual acuities from 1/50 (20/1000, 0.02) to 1/1 (20/20, 1.0). This is not only important for patients with low vision, but also for follow-up of various conditions; vague statements, such as “count fingers” or hand movements are no longer needed. A 1-m cord is attached to accurately maintain the viewing distance. |
Many patients with low vision have been found to have improper correction for refractive error; a subjective refraction for this group is difficult, because the question “better or worse” looses significance when the patient cannot see the letters on a chart at 20 ft. Bringing the chart to 1 m provides a far greater measurement range; being able to see several lines on a 1-M chart is encouraging to patients and provides better responses for subjective refraction. Presbyopic patients need a 1 D correction for the 1-M distance. This is easier to provide than a 1/3 D correction for a 3 m (10 ft) distance.39,40
The greater measurement range also means that vague terms such as “count fingers” or “hand movements” can be eliminated. Measuring at 1 m has the additional advantage that the Snellen fraction is as simple as possible (1/…) and can be converted easily to an equivalent for any other distance by multiplying numerator and denominator by the same number (e.g., 1/20 = 20/400 = 5/100 = 6/120 = 0.05). Because visual acuity is defined as the reciprocal of the magnification requirement, the denominator of the 1-M Snellen fraction indicates the magnification requirement, which is a good starting point for the prescription of magnifiers. This relationship is often referred to as Kestenbaum’s rule,41 stating that the magnification needed for reading of newsprint (1 M) should be at least the reciprocal of the visual acuity value (e.g., 20/100 requires at least 100/20 = 5, 20/200 requires at least 200/20 = 10).
Choice of Letter Size Progression
Snellen’s original charts (Fig. 51.7) had small steps for the normal range and larger steps for the lower ranges. Introduction of the decimal acuity notation23 led to charts with visual acuity steps in 0.1 increments. On these charts, the steps at the top of the scale (bottom of the chart), such as 0.9-1.0-1.1, are too small to be practical; at the other end, the reverse is true. Only a logarithmic scale (Fig. 51.15) span the full range is evenly.
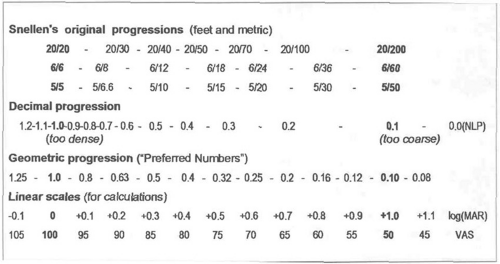 Figure 51.15. Various letter size progressions. On a geometric (often called logarithmic) scale each step represents the same ratio (e.g., 2-4-8-16-32); on a linear scale each step represents the same increment (e.g., 2-4-6-8-10). Only a geometric progression can span a wide range of values with equal steps throughout. The logarithms of a geometric scale yield a linear scale with equal increments throughout. Examples are the log(MAR) scale and the visual acuity score (VAS) scale (Fig. 51.18). |
Snellen advocated reducing the viewing distance to improve measurement for lower acuities. Use of a logarithmic scale, which maintains the same accuracy at all levels, was first proposed by Green (1868)20,21; it was advocated by many subsequent researchers, including Sloan and Bailey-Lovie, but did not gain wider recognition until its adoption in the ETDRS protocol, which has become the de facto world-wide standard.
Use of a logarithmic (geometric) progression of stimuli is in accordance with Weber-Fechner’s law,42 which states that geometric (proportional) increments in stimulus give rise to linear increments in sensation. Westheimer43 has shown that this also holds for visual acuity. Massof and Fletcher44 showed that it also applies to the relation between visual acuity and visual (dis)ability (Fig. 51.16).
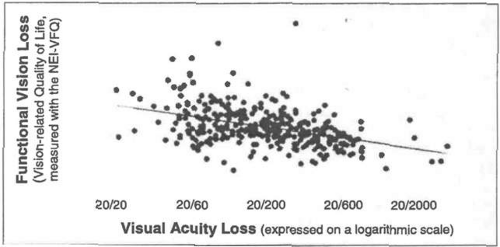 Figure 51.16. Visual acuity and quality of life. The diagram demonstrates that there is a linear relationship between functional vision (National Eye Institute Visual Function Questionnaire [NEI-VFQ]) after Rasch analysis) and visual acuity on a logarithmic scale. The diagram also shows that no natural breakpoint in this relationship exists and that the spread of functional vision ratings is much larger than the amount explained by the acuity loss alone. |
Various geometric progressions are possible. The one that fits best with the decimal system is one in which 10 steps equal 10. This is the sequence used by Green and by Sloan, Bailey-Lovie, and the ETDRS. It is known as the “Preferred Numbers” series (Fig. 51.17).
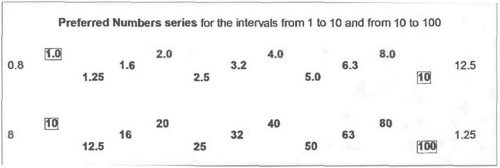 Figure 51.17. Preferred numbers. Many different geometric progressions are possible. The one that fits best with the decimal system is know as the preferred numbers series. Its step size is 10v10, so that 10 steps equal exactly 10. Thus, when the series is extended from 1 to 10 to 100 to 1,000 and so on, the same digits repeat in each of these intervals with only a shift in the decimal marker. The series is widely used in industrial standards and is the subject of an international standard itself123; it also is the series used by Green, by Sloan and for the Early Treatment of Diabetic Retinopathy Study (ETDRS) charts. For general use, the preferred numbers series is advantageous because with minimal rounding (<1%), its terms can be represented by simple numbers; each step equals approximately 1.25 (a 4:5 ratio), most three-step intervals equal 2 (1 octave) and 10 steps equal exactly 10. In the diagram below, the numbers for each interval have been spread over three lines to demonstrate that of the three-step intervals only two (from 32 to 63 and from 63 to125) are slightly less than 2, and to show the shift in the decimal marker between intervals. For visual acuity measurement, an additional advantage is that the product or quotient of two preferred numbers is again a preferred number. Thus, for any acuity measurement, if the letter size and the viewing distance are expressed in preferred numbers, the resulting values for the visual acuity value, the magnification requirement (MAR = 1/V) and the viewing distance in diopters (D = 1/m = reading add or accommodation requirement) will also be preferred numbers. This greatly facilitates the various calculations, as can be seen in Figure 51.18. Visual acuity charts specifically based on this feature were published by M.C. Colenbrander in 1937124 and 1955.125 |
Choice of Contrast and Illumination
Contrast and illumination both influence visual acuity. At normal illumination levels for an office or school, the influence is minimal. Most printed visual acuity charts have contrasts of 80% or better; visual acuity is usually not affected until contrast drops below 40% Weber (20% Michelson). When contrast is reduced to a level where it does affect visual acuity, the test becomes a contrast sensitivity[AC7] test, which is discussed later in this chapter.
Front lighting is the most common way to illuminate printed charts. Care should be taken that no glare and no bright spots or dim spots are on the chart. For most patients, a high illumination level is advantageous. However, for patients with conditions, such as albinism or rod dystrophy, it should be possible to reduce the illumination, which may result in a significant increase in visual acuity.
Back lighting of a translucent chart on a light box gives the most even and most reproducible illumination. The usual backlit ETDRS chart has an illumination level of about 200 cd/m2. For more portable applications, as in school testing, smaller rear illumination cabinets are available also.
Projector charts in a dim or darkened room are the preferred presentation mode in professional offices. For these charts, stray room light may significantly affect the test. If that is the case, measurements made in different rooms with different amounts of stray light may no longer be comparable. In the United States the average projector chart has a luminance of about 85 cd/m2; European charts are generally brighter, up to 300 cd/m2. The lower luminance has the advantage that the pupil may be wider, so that refractive errors may be more obvious; the brighter charts have the advantage that they suffer less from stray light. In most situations, the difference is negligible. The ICO Visual Acuity Measurement Standard35 recommends a range that includes both the lower and the higher values.
Projector charts are convenient for routine eye examinations; however, for vision rehabilitation, where the goal is to predict the everyday performance of patients, a lighted, printed chart in a lighted room is preferred, because it is closer to normal conditions.
Presentation on a computer screen is gaining ground. This method is less sensitive to stray light and allows easy switching between different optotypes as well as control over parameters such as crowding, contrast and brightness. The earliest implementations were the E-HOTV system45 and the E-ETDRS system.46 Both use single letter presentation with crowding bars. Newer systems offer more varied presentation modes.
Choice of Visual Acuity Notation
The result of the visual acuity measurement may be recorded in a variety of ways. It should be noted here that, although some may refer to the “Snellen system” as being different from the “ETDRS or logMAR system,” the two measure exactly the same visual acuity value, but report it on a different scale. This can be compared with the Fahrenheit and Centigrade scales, which measure the same temperature, but report it on different scales.
True Snellen Fractions
Snellen preferred a true Snellen fraction, in which the numerator indicates the actual test distance and the denominator indicates the actual size of the letter seen. The advantage of this notation is that it indicates the actual test conditions. The disadvantage is that it becomes awkward to compare visual acuity values that are measured under different conditions. This is especially true since the advent of projector charts where the viewing distance is dictated by the geometry of the room and the projector magnification is adjusted to accommodate fractional viewing distances.
Snellen Equivalents
To overcome this difficulty, Snellen equivalents are used. In Europe, the decimal equivalent23 of the Snellen value is used most often. This notation is clear, because there is no numerator or denominator. The notation becomes confusing when the decimal notation is converted back to a pseudo-Snellen fraction (e.g., 5/25 (0.2 (2/10); the 2/10 fraction would suggest that the subject saw a 10 M letter at 2 m, instead of a 25 M letter at 5 .
The United States notation uses a 20-ft fraction as a Snellen equivalent. If two examination lanes have viewing distances of 18 ft and 21 ft, respectively, the true Snellen fractions for standard acuity would be 18/18 or 21/21. Instead, the visual acuity is recorded as 20/20 in both cases. Thus, seeing “20” as the numerator of a visual acuity fraction rarely implies that the actual measurement was made at 20 ft.
In Britain and related countries, the 6/6 notation is similarly used as a Snellen equivalent.
Visual angle notation was used by Louise Sloan. It refers to the visual angle of the stroke width of 5 × 5 letters. This angular value is the same as the MAR, which was discussed earlier.
LogMAR notation was introduced by Bailey.31 As the name implies, it is the logarithm of the MAR value, thus converting a geometric sequence of letter sizes to a linear scale of perception. It provides a more scientific equivalent for the traditional clinical statement of “lines lost” or “lines gained” and has gained widespread use in psychophysical studies and for statistical calculations.
On an ETDRS-type chart, each line interval is equivalent to 0.1 logMAR; therefore +1.0 logMAR means 10 lines lost or 20/200 (0.1) and +2.0 logMAR means 20 lines lost or 20/2000 (0.01). Because higher logMAR values indicate poorer vision, the logMAR notation should be considered a notation of vision loss, rather than a notation of visual acuity. A 0 logMAR = no loss = standard vision, whereas 0 VA = NLP = blindness.
Since Bailey used the logMAR notation with a geometric progression of letter sizes, the term “logMAR chart” is often used to imply a geometric progression. However, the MAR and logMAR notations can be used with any letter size progression.
Visual Acuity Score (VAS)47 and Visual Acuity Rating (VAR)48 are two names given to a more user-friendly alternative to the logMAR scale. As with the logMAR scale, it converts the geometric progression of visual acuity values to a linear scale. However, the VAS scale is more intuitive, because it is a scale of visual functioning, where higher numbers indicate better vision. For VAS or VAR, the reference standard (20/20, 1.0) is rated as “100,” a 10-line loss (20/200, 0.1) is rated as “50,” and a 20-line loss (20/2000, 0.01) is rated as “0.” Although this 0 value is not total blindness, MAR = 100, it hardly is a measure of detail vision anymore. On ETDRS type charts, where each line has five letters, the VAS can be interpreted as a count of the total number of letters read, starting from 20/2000 (0.01).
Similar letter-count scores are used in many studies and population surveys; however, they are often anchored arbitrarily; the original ETDRS score was anchored at 40 M at 1 m (20/800) = 0, so that 20/20 = 85. VAS and VAR are anchored so that the reference standard equals 100. (Fig. 51.18) compares these different notations.
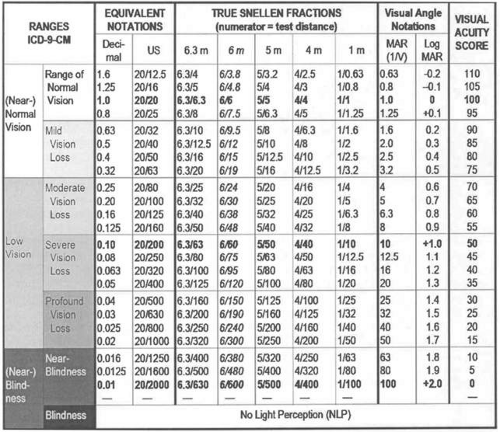 Figure 51.18. Various equivalent visual acuity notations. The table compares the different visual acuity notations discussed in the text. Note that the MAgnification Requirement (MAR) and logMAR scales indicate vision loss (higher values indicate poorer vision); the visual acuity score (VAS) scale indicates functioning (higher values indicate better vision). The progression of visual acuity values follows the “preferred numbers” series (Fig. 51.17). Note that when the viewing distances also follow this series (1, 4, 5 or 6.3 m; 20 ft), the required letter sizes (numerator of the Snellen fraction) are also preferred numbers. When the chart is designed for 6 m (5% less then a preferred number), the required letter sizes also have to be reduced by 5% and are no longer preferred numbers. For chart design, the exact numbers, as shown in this table, should be followed. For clinical naming, it is acceptable to round 32 to 30, 63 to 60, and so on. The error involved is 5% or 1/5 line interval, and corresponds to 1 letter seen or not seen on a standard chart, a difference much smaller than the measurement accuracy of clinical measurement. |
Which Notation to Use?
For everyday clinical practice, the direct visual acuity values are most useful (Fig. 51.3). They allow simple calculations about viewing distance, letter size, and magnification need: for example, an eye with 20/20 acuity can, by definition, just see a 1 M letter (1.5 mm) at 1 m; a road sign with letters that are 100 larger (100 M, 150 mm, 6 in) can therefore be seen at 100 that distance (100 m, 300 ft). A person with 20/40 (1/2) acuity can see the same letters at half the distance (1/2 × 100 m = 50 m, 150 ft); to read normal print the person with 20/40 acuity needs 2 magnification.
Today, true Snellen fractions, in which the numerator indicates the actual testing distance, are rarely used anymore. Snellen equivalent notations are preferred, because they can be compared regardless of the testing distance used. Decimal notation (Europe), United States fractions (20/…), and British fractions (6/…) are the notations with which most people are familiar.
For graphical displays with a very limited acuity range, any scale might be used. However, for displays that cover a wider range, a scale based on a logarithmic scale (log(VA), logMAR, VAS or “lines”) is preferable.
For statistical calculations using log(VA), logMAR or VAS is the only option. The difference between using a linear and a geometric scale for calculations can best be shown with an example:
What is the average of 20/20 and 20/200?
Using VAS, the average of VAS 100 (20/20) and VAS 50 (20/200) is VAS 75 (20/63).
Averaging the decimal values (1.0 and 0.1), the average = 0.55 (20/40 +) would be too high.
Averaging the denominators of 20/20 and 20/200, the average = 20/110 would be too low.
The table in Figure 51.18 clearly shows that the first answer is the most appropriate.
What not to use? In most offices, the viewing distance is never varied. This means that each line can be labeled with the visual acuity value for that distance. On many charts, this has led to omission of the actual letter size, as it was always listed on Snellen’s charts. When the chart is used at any other distance, determining the acuity value without knowing the letter size involves some calculations. The lack of letter size designations has led to the habit of using visual acuity notations to describe letter sizes. This is erroneous, because any letter size can reflect any acuity value, depending on the viewing distance (Fig. 51.22).[AC8]
Choice of Criterion and Rounding of Values
The recorded visual acuity value can also be influenced by the choice of the completion criterion and by rounding. Most clinicians will record visual acuity in line-increments and consider a line read if more than half of the letters are read correctly (e.g., three of five on an ETDRS type chart). A suffix such as -1 or +2 is often added to indicate one letter missed or two letters read on the next line. On older charts, where the line intervals and the number of letters per line may vary, these suffixes have no constant meaning. At the top of most traditional charts (Fig. 51.7), +1 would be 3 ETDRS lines; for Green’s bottom lines of 11 letters (Fig. 51.9), +5 would still be less than half a line. Thus, when averaging visual acuity values across patients or over time, these suffixes should be ignored.
On ETDRS-type charts, the line intervals and the number of letters per line are fixed and the value of each additional letter read may be assumed to be equal. This provides the opportunity to record the test results in letter increments rather than in line increments. Such letter-count scores are used in many research studies; on the VAS scale, each letter read increases the score by 1 point. In this case, the suffixes -, –, + and ++ are recommended.49 (Fig. 51-19) Omitting the suffix will automatically round to the appropriate Snellen equivalent; use of these suffixes is preferred over the use of interpolated values, which convey a sense of spurious accuracy.
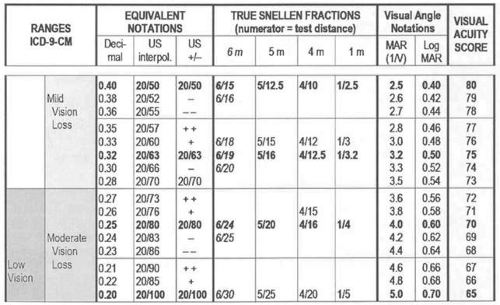 Figure 51.19. Rounding of visual acuity values. The question is sometimes asked “is 20/63 worse than 20/60?” The answer is that they are equivalent within the measurement error. They differ by only 1 visual acuity score (VAS) point (one letter), which is 5 smaller than the 95% confidence interval for clinical measurement error (one line). To bring the accuracy down to 1 letter, one would have to average 52 = 25 measurements. The following table represents a small segment of the table in Figure 51.18; it is expanded from 1 line (5 letters) per row to 1 visual acuity score (VAS) point (one letter) per row. The bold values indicate the line values for a strict logarithmic progression; the horizontal bands indicate line intervals. Because of the rule that a line is considered read if more than half of the characters (3 of 5) are correctly identified, all values within a band should be considered equivalent for clinical recording and may be rounded to the same value. Thus, all values from 20/63 ++ to 20/63 – – (20/57 to 20/70) may be rounded to 20/63; this includes the more traditional value 20/60. A rule that says “better than 20/60” should be mathematically interpreted as better than 20/56 (>0.35); a rule that says “worse than 20/60” should be mathematically interpreted as worse than 20/71 (<0.28). All traditional values are close (1 letter) to a logarithmic value. The only exceptions are 20/70 and the decimal values 0.7 and 0.9, which represent half steps. The 20/70 value is a remnant of Snellen’s original chart (Fig. 51.15), which had no lines for 20/60 and 20/80, but went from 20/50 to 20/70 to 20/100 and 20/200. Also note that to indicate letter count steps, the notation with + and – suffixes (in the US column) is easier to understand than the use of interpolated numerical values, as shown in the US interpol. column and in the decimal column); they suggest spurious accuracy. |
It should be noted that, although the letter-count score improves the precision with which the result is recorded, it does not improve the accuracy of the underlying measurement method. On any measurement scale, a one-point difference may or may not be significant; a change from “2” to “3” might indicate an insignificant change from 2.4 to 2.6 or a significant change from 1.6 to 3.4. Because the accuracy of common one-time clinical measurements is about one-line interval, the results may as well be rounded to the nearest line. The use of a letter count score is advantageous, however, when sequential measurements are compared to detect a possible trend.
Another factor that may affect the score is whether subjects are encouraged to guess. Because different subjects may vary in their willingness to guess, forcing all to guess (a “forced choice” paradigm) will produce more homogeneous results.
When a subject cannot read a line on a chart, some clinicians will present an isolated line or an isolated letter. This makes the task easier and can improve the visual acuity score. Be aware that using different presentation modes at different times reduces the comparability of the scores.
To make sure that the actual threshold is reported, the chart should be presented close enough so that there is at least one line the subject can see, or far enough so that there is at least one line the subject cannot see. Terminating testing at the 20/20 level is a mistake, because Snellen chose the reference value of 20/20 (1.0) so that most healthy eyes can do better (Fig. 51.8).
Choice of Test Symbols
Most visual acuity charts utilize letters. For the patient, this choice gives a sense of immediate validity, because the primary objective of most patients is to read. For the practitioner, errors are easy to spot, because most practitioners know their chart by heart. Use of letters, however, is warranted only if the assumption can be made that letter recognition is trivially easy. The ETDRS charts use the Sloan letter set (Fig. 51.12), which has made this the preferred set for many studies. Many other letter sets exist, including sets for non-Roman alphabets.
For less literate adults, the use of a number chart may be more appropriate. Number charts can also be used for deaf patient who use sign language, because they can respond by holding up the appropriate number of fingers.
An alternative is the use of various symbol sets.
Internationally Used Symbol Sets
Landolt Cs25 (Fig. 51.11) have become the symbols of choice for many scientific measurements. They are much less frequently used in a clinical setting. When used in a chart format, it is harder to detect errors, unless the observer points to the symbol. However, pointing, as with single presentation, affects the difficulty of the test.
The 1984 Visual Acuity Measurement Standard of the International Council of Ophthalmology35 recommended that letter charts in non-Roman alphabets (e.g., Cyrillic, Arabic, Hindi, Kanji, Hebrew) be calibrated against Landolt Cs for equal recognizability. Because the ETDRS chart has become a de facto standard, calibrating against an ETDRS chart is another option.
Tumbling Es are probably the symbols most often used for the testing of children. They are also widely used in developing countries and in countries where the Roman alphabet is not used. Tumbling Es and Landolt Cs require a sense of laterality, which can be a stumbling block for young and for developmentally delayed children. They can be presented in a chart format or as single symbols. When comparing findings, it should be remembered that presentation as single symbols is an easier test than presentation in a chart format.
Symbol Sets Often Used in the United States
The HOTV test uses the four letters H, O, T and V as symbols with distinctive shapes that can be recognized even by preliterate children; these letters were chosen because they do not require a sense of laterality.50 For children who are shy or have difficulty naming symbols, matching cards can be used where the child only needs to point at the matching symbol.
For illiterate patients and preschool children, pictures can be used. It is difficult, however, to judge the equivalence of letters and various pictures and a child’s performance may depend on familiarity with the objects. Most pictures cannot be designed on Snellen’s 5 × 5 grid.
Patti Pics form a set of five stylized pictures, designed on the 5 × 5 Snellen grid, that provide a middle ground between letters and pictures.51 They are left-right symmetric and require little naming ability. They have been calibrated for equal recognizability with Sloan letters. As a result, no shift in visual acuity is observed when a child graduates from Patti Pics to letters. They can also be used for adults who are not familiar with the Roman alphabet.
LEA symbols were devised by Lea Hyvärinen.52 The set has only four symbols that have narrower lines than Snellen symbols. They are widely used for pediatric testing and are available in a variety of formats, from game formats for the very young to letter chart formats. Because they are somewhat easier than Sloan letters, there may be a difference when children make the transition from symbols to letters53 (Fig. 51.20).
Stay updated, free articles. Join our Telegram channel

Full access? Get Clinical Tree


