Purpose
To study the effects of surface ablation with mitomycin C (MMC) on keratocyte population.
Design
Prospective, nonrandomized, interventional, comparative case series.
Methods
Thirty two eyes treated with surface ablation with 0.02% MMC were compared with nontreated eyes at Vissum Santa Hortensia, Madrid, Spain. Keratocyte density was measured with the Heidelberg Retina Tomograph II (Rostock Cornea Module) 3, 15, and 36 to 42 months after the surgery in the anterior, mid, and posterior stroma, and compared with control eyes.
Results
Three months postoperatively, we found a lower stromal bed density compared to controls (16 993 ± 8001 vs 29 660 ± 5904 cells/mm 3 , P = .0001), while there was a significantly higher cell density in the mid (30 783 ± 9300 vs 18 505 ± 1996 cells/mm 3 , P = .0001) and deep stroma (30 268 ± 8321 vs 18 438 ± 2139 cells/mm 3 , P = .0001). Three years after the surgery, the cellularity in the stromal bed had not significantly changed from the 3-month follow-up, but the density in the mid (18 889 ± 3474 cells/mm 3 ) and posterior stroma (18 992 ± 3402 cells/mm 3 ) had decreased to show no difference from controls. The mean cell density between the anterior, mid, and posterior stroma was not significantly different from controls 15 months and 3 years after the surgery.
Conclusion
Our study suggests that there is a reorganization of the stromal cell population soon after surface ablation with MMC, with a decrease in the stromal bed compensated initially with an increase in the mid and posterior stroma. Corneal cellularity tends to normalize over time, and 3 years postoperatively the mean cell density throughout the cornea seems to maintain normal values.
Mitomycin C (MMC) has allowed for the revival of excimer laser surface ablation techniques. The MMC reduces the myofibroblast repopulation after laser surface ablation and, therefore, reduces the risk of postoperative corneal haze. It is used prophylactically in primary procedures and therapeutically to treat pre-existing haze.
The keratocytes are the target of the MMC anti-haze mechanism, since this drug inhibits their activation, proliferation, and differentiation into myofibroblasts. This antimitotic effect led to fear of a possible long-term depletion of the keratocyte population, and the few studies dealing with this subject show contradictory results. A previous report of our group showed a redistribution of the cells throughout the corneal stroma 3 months after surface ablation with MMC, with a decrease in the anterior layers compensated by an increase in the posterior layers. However, the short follow-up did not allow us to establish whether those changes were permanent.
Therefore, we decided to follow that cohort of patients up to at least 36 months after surface ablation with MMC and compare it with nonoperated healthy control eyes.
Patients and Methods
We performed a prospective study of consecutive eyes that underwent laser-assisted subepithelial keratectomy (LASEK) to correct a myopic error (with or without astigmatism) and that received intraoperative MMC prophylactically because of an ablation depth greater than 50 μm. When both eyes of the same patient fulfilled the inclusion criteria, only 1 eye (the right eye) was included for analysis.
We excluded patients with unstable refraction, keratoconus suspects, cases with previous ocular surgery, and those with a systemic disease that could alter the wound healing process, such as diabetes or connective tissue disorders. A group of normal subjects with nonoperated healthy corneas were also analyzed, and served as controls.
Surgical Technique
All procedures were performed by 2 surgeons (M.A.T., L.B.-L.), using the same Esiris Schwind excimer laser (Schwind Eye Tech Solutions, Kleinostheim, Germany) using a photorefractive keratectomy (PRK) nomogram and a conventional treatment.
All surgeries were performed under topical anesthesia (lidocaine 2%). We used 20% alcohol solution for 40 seconds to help peel back the epithelial flap. After laser ablation, a 7-mm round cellulose sponge soaked in MMC 0.02% was applied for 30 seconds over the ablated stroma. The stroma then was rinsed copiously with balanced salt solution (BSS) and the epithelial flap was repositioned and covered with a therapeutic soft contact lens (Acuvue Oasys; Johnson & Johnson Vision Care, Inc, Jacksonville, Florida, USA). Antibiotic drops (ciprofloxacin 3 mg/mL) and nonsteroidal anti-inflammatory drops (ketorolac trometamol 5 mg/mL) were applied.
Postoperative Follow-up
Medications consisted of topical antibiotic (ciprofloxacin 3 mg/mL) and steroid (fluorometholone alcohol 2.5 mg/mL) drops 4 times daily during the first week postoperatively. The steroid drops were then tapered and stopped 1 month after the surgery. The therapeutic contact lens was removed once re-epithelialization was complete, 5 to 7 days after surgery.
Examinations were scheduled at 1 day; 1 week; 1, 3, and 15 months; and 3 years (36 to 42 months) postoperatively. Confocal microscopy was performed at the 3- and 15-month and 3-year postoperative visits.
In Vivo Confocal Microscopy
Laser scanning in vivo confocal microscopy was performed using the Heidelberg Retina Tomograph II (HRTII) with the Rostock Cornea Module (RCM). This microscope uses a 670-nm red wavelength diode laser source. A 60× objective water immersion lens with a numerical aperture of 0.9 (Olympus, Tokyo, Japan) was used. The dimensions of the images obtained using this lens are 400 × 400 μm, and the manufacturer quotes the transverse resolution and optical section thickness of 1 μm and 4 μm respectively. The RCM uses an entirely digital capture system. The RCM can automatically scan through 80 μm of the cornea, at any depth, capturing 30 frames/second, but in order to obtain a scan of the whole cornea the microscope needs to be manually advanced through the full thickness of the cornea.
The method of examination was as follows: each eye was anesthetized with 1% tetracaine chlorhydrate (Alcon Cusí Lab, Barcelona, Spain). Viscotears (Carbomer 980, 0.2%; Novartis, North Ryde, Australia) was used as a coupling agent between the applanating lens cap and the cornea. Three scans through the whole cornea were recorded from each eye, and the one with fewer motion artefacts was then selected for analysis. All scans were performed by the same trained examiner.
Keratocyte Density Measurement
Only 1 observer, always the same, manually selected the cell nuclei in each digital image covering 400 × 400 μm of cornea. Objects that touched the bottom and left boundaries of this area were counted, whereas objects that crossed the top or right edges were not counted. The computer then provided the value of the keratocyte density expressed as cells/mm 2 . Volumetric density was estimated using the formula: D = N/A∂, where N is the number of cells identified in the area A, and ∂ is the optical section thickness. This optical section thickness ∂, or depth of field, was estimated following the method described by McLaren and associates by the distance that the scanner moved from the gradual appearance of a cell to the gradual disappearance of that cell. The number of frames in which a cell would have been counted was multiplied by the average distance between frames. In our microscope, this method yielded a depth of field of 15.63 ± 1.82 μm.
We also checked this depth of field using the other method described by the same group, by measuring the full width at half maximum intensity of a scan through a bright reflective surface. We obtained a scan with the HRTII-RCM through the surface of a glass microscope slide, with a distance between frames of 2 μm; the mean intensity of the returned signal was plotted and the full width at half maximum intensity determined. This method yielded a depth of field of 13.6 μm.
At each determined depth of study, 3 images were analyzed: the one that most exactly corresponded to the determined depth and the images just anterior and posterior, with a difference between them of less than 20 μm. Cells were counted in the 3 images and the mean was obtained.
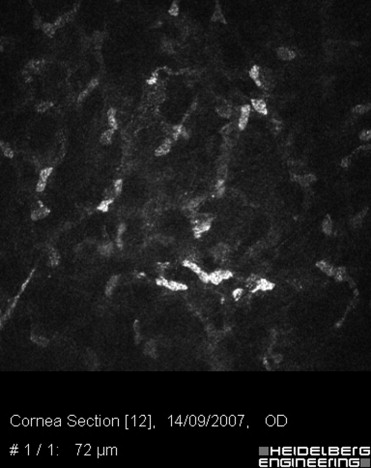
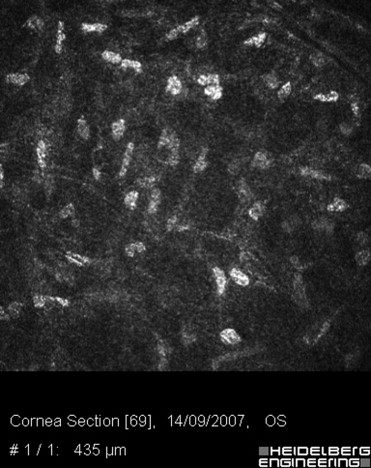
Images were analyzed at the following depths: 1) anterior stroma–stromal bed in operated eyes (first image of the keratocytes under the epithelium) ( Figure 1 ); 2) mid stroma (200 μm above the endothelium); and 3) deep stroma (50 μm above the endothelium) ( Figure 2 ).
From the scans obtained 36 to 42 months postoperatively (3-year follow-up), we decided to also examine deeper layers within the anterior stroma, in order to have more information regarding the anterior stromal population after surgery, not only the one limited to the stromal bed. Therefore, we measured stromal cell density at 25 μm and 75 μm under the epithelium and compared it to the same layers in control eyes. With these measurements, the average between anterior stroma (considered as the mean density between the 25- and 75-μm-deep layers), mid stroma, and posterior stroma was calculated and compared to control eyes.
Statistical Analysis
The Statview+Graphics (Abacus Concept Inc, Cupertino, California, USA) was used for data analysis. The normality of the data distribution was checked using the Bonferroni test. Statistical comparisons were done using the ANOVA test and the unpaired Student t test, when appropriate, using the Bonferroni correction for multiple comparisons . P ≤ .05 was considered statistically significant. Continuous data are expressed as the mean ± standard deviation.
Results
To the initial cohort previously published, we added 8 more eyes in order to have 32 in each group. Table 1 shows the preoperative data of both groups. At the 15-month follow-up, all the patients were available for examination (100%), whereas 5 patients did not come for the 3-year postoperative visit (thus 27 eyes were available, 84.37%).
| Control n = 32 | LASEK+MMC n = 32 | P Value | |
|---|---|---|---|
| Age | 28.5 ± 3.2 (22 to 34) | 30.7 ± 4.8 (24 to 48) | .2 |
| Sphere (D) | −2.25 ± 2.6 (0 to −8.5) | −4.04 ± 2.9 (0 to −9.5) | .04 |
| Cylinder (D) | −0.31 ± 0.5 (0 to −2.0) | −1.21 ± 1.14 (0 to −4.0) | .0002 |
The comparison of cell densities ( Table 2 ) showed a reorganization of the cells within the corneal stroma 3 months after surgery (as previously described ) with a statistically significantly lower cell density in the most anterior stromal layer compared to controls, but compensated with a significantly higher density in mid and deep layers ( Figure 3 ). The comparison between the average densities (calculated as the mean between the anterior, mid, and deep stromal layer densities in each group) showed a statistically significantly higher cell population compared to controls ( Figure 3 ).
| Controls n = 32 | 3 Months Post LASEK+MMC n = 32 | 15 Months Post LASEK+MMC n = 32 | 3 Years Post LASEK+MMC n = 27 | P Value | Statistically Significant Comparisons a | |
|---|---|---|---|---|---|---|
| Stromal bed (cells/mm 3 ) | 29 660.71 ± 5904.80 | 16 993.75 ± 8001.78 | 19 408.31 ± 3615.54 | 15 662.2 ± 2839.1 | .0001 | Controls vs 3m/15m/3y |
| (20 333.33 to 42 666.66) | (6800.000 to 36 933.33) | (12 000.00 to 29 733.33) | (11 000.0 to 21 844.0) | |||
| Mid stroma (cells/mm 3 ) | 18 505.95 ± 1996.06 | 30 783.33 ± 9300.00 | 22 055.16 ± 3834.56 | 18 889.5 ± 3474.0 | .0001 | Controls vs 3m; 3m vs 15m/3y |
| (14 800 to 21 533.33) | (13 933.33 to 47 400.00) | (16 533.33 to 32 733.33) | (12 266.66 to 27 933.33) | |||
| Posterior stroma (cells/mm 3 ) | 18 438.09 ± 2139.68 | 30 268.75 ± 8321.95 | 21 271.52 ± 4434.22 | 18 992.6 ± 3402.4 | .0001 | Controls vs 3m; 3m vs 15m/3y |
| (13 666.66 to 22 800) | (17 333.33 to 43 600.00) | (14 133.33 to 35 400.00) | (14 000 to 31 066.66) | |||
| Average (anterior-mid-posterior) | 22 201.58 ± 2730.72 | 26 015.27 ± 7193.52 | 20 911.66 ± 3508.27 | 17 848.16 ± 2653.06 | .0001 | Controls vs 3m/3y; 3m vs 15m/3y; 15m vs 3y |
| (16 711.111 to 28 444.444) | (15 755.55 to 38 600.00) | (14 533.33 to 32 622.22) | (13 822.22 to 26 474.0) |
a Comparisons that showed statistical significance are indicated; the ones not indicated were not statistically significant.
Stay updated, free articles. Join our Telegram channel

Full access? Get Clinical Tree


