Purpose
To determine whether a recovery of the microstructures of the foveal photoreceptors after macular hole closure is correlated with best-corrected visual acuity (BCVA).
Design
Retrospective, consecutive, observational case series.
Methods
setting: Single-center academic practice. study population: Forty-one eyes of 41 patients with surgically closed macular holes. observational procedures: The presence and intactness of the cone outer segment tips (COST) line were determined by spectral-domain optical coherence tomography and compared with the presence of the inner segment/outer segment (IS/OS) junction and the external limiting membrane (ELM) at 1, 3, 6, 9, and 12 months after the macular hole surgery. main outcome measure: The correlation between the integrity of the foveal photoreceptor microstructures and the BCVA.
Results
A distinct COST line was first seen at 6 months after the surgery. A distinct or irregular COST line was observed only in eyes with an intact IS/OS junction and ELM. Eyes with a distinct or irregular COST line had significantly better BCVA than those with a disrupted COST line in eyes with an intact IS/OS junction and ELM at 12 months ( P = .030). The BCVA was ≥20/25 at 12 months in 91% of the eyes with a distinct or irregular COST line but in only 44% of the eyes without a COST line ( P = .015).
Conclusions
The significant correlation between the BCVA and a distinct or irregular COST line after successful macular hole surgery indicates that the recovery of foveal cone microstructure is associated with good postoperative BCVA.
An idiopathic macular hole can be successfully closed by vitreous surgery with recovery of good vision. However, the degree of visual recovery varies, and some cases do not recover good vision despite the closure of the macular hole. In addition, the duration for the visual recovery varies considerably and can be long. The factors that are related to the recovery of vision postoperatively have not been determined.
Spectral-domain optical coherence tomography (SD-OCT) has allowed investigators to evaluate the microstructures of the photoreceptors noninvasively in eyes with different types of retinal diseases, including those with idiopathic macular holes. Several studies have shown that the restoration of the photoreceptor inner segment/outer segment (IS/OS) junction was significantly correlated with the recovery of visual acuity after surgery. This significant correlation has also been found in cases of epiretinal membrane, diabetic macular edema, rhegmatogenous retinal detachment, retinal vein occlusion, and age-related macular degeneration. It was suggested that the presence of a continuous IS/OS line was a sign of well-restored photoreceptor cells, and a continuous external limiting membrane (ELM) was a sign of intact photoreceptor cell bodies and Müller cells. These findings indicated that both the ELM and IS/OS junction can recover but the IS/OS junction rarely recovered without a recovery of the ELM.
High-speed, ultrahigh-resolution optical coherence tomography (UHR-OCT) has been used to acquire, measure, and map the outer retinal morphology including the topographic distribution of cones and rods in the macula. A bright back-reflecting line located between the IS/OS junction and retinal pigment epithelium in the UHR-OCT images has been identified as the boundary of the cone outer segment tips (COST). The relationship between visual acuity and the integrity of the foveal COST line detected by commercially available SD-OCTs has been reported in cases of occult macular dystrophy. We performed a preliminary study of 37 eyes of 37 normal subjects, and a distinct COST line was detected in over 94% of the Cirrus SD-OCT images with the 5-line raster mode (unpublished data).
We hypothesized that the postoperative recovery of visual acuity is dependent on the restoration of the foveal COST line. To test this hypothesis, we determined the correlation between the best-corrected visual acuity (BCVA) and the integrity of the foveal COST line, the IS/OS junction, and the ELM in the SD-OCT images.
Patients and Methods
The medical records of 58 eyes of 58 consecutive patients with surgically closed macular holes were reviewed. All of the patients had undergone surgery from March 11, 2008 to August 13, 2009 at the Kyorin Eye Center, and all were diagnosed with either a stage 2, 3, or 4 idiopathic macular hole according to the Gass classification. The preoperative data recorded included age, sex, right or left eye, axial length, stage of macular hole, the apical diameter of the macular hole before the operation determined by SD-OCT, and Snellen BCVA. The apical diameter was defined as the minimum distance at the neurosensory retinal defect at the fovea in the vertical and horizontal images.
All of the patients had comprehensive ophthalmologic examinations preoperatively and 1, 3, 6, 9, and 12 months postoperatively. The examinations included BCVA, binocular indirect ophthalmoscopy, non-contact lens slit-lamp biomicroscopy, fundus photography, and fundus autofluorescence imaging by a confocal scanning laser ophthalmoscope (Heidelberg Retina Angiograph 2; Heidelberg Engineering, Heidelberg, Germany).
The SD-OCT examination was performed on all patients on the same day as the clinical examinations. The SD-OCT images were evaluated to determine the integrity of the ELM, IS/OS junction, and the COST line.
All surgeries were performed after the patients received a detailed explanation of the surgical and SD-OCT procedures. The main outcome measures were the 12-month-postoperative BCVA and the condition of the foveal microstructures in the SD-OCT images.
The surgery was performed by one of 3 retina specialists (T.H., M.I., A.H.). A standard 3-port pars plana vitrectomy was used to close the macular hole under 2% lidocaine retrobulbar anesthesia. An intravitreal injection of triamcinolone acetonide (Kenacort-A; Bristol Pharmaceuticals KK, Tokyo, Japan) or indocyanine green (Santen Pharmacy, Osaka, Japan) was used to make the vitreous gel and internal limiting membrane more visible. Core vitrectomy was performed with the creation of a posterior vitreous detachment if one was not present, and the internal limiting membrane was removed in all cases. All cataractous lenses were removed by phacoemulsification with an implantation of an intraocular lens. The lens was also extracted from all patients >55 years. Room air or nonexpansive 20% sulfur hexafluoride was used to tamponade the retina, and patients were instructed to maintain a facedown position for 3 to 4 days postoperatively.
Anatomic success was defined as the presence of a flat or closed macular hole at 1 month postoperatively confirmed by biomicroscopy and SD-OCT and the absence of autofluorescence at the site of the macular hole.
Microstructural images of the fovea were obtained by the SD-OCT (OCT4000; Cirrus HD-OCT, Carl Zeiss Meditec Inc, Dublin, California, USA). The entire macular area was scanned, and high-quality images of 6-mm scans were obtained with the 5-line raster mode. We used the horizontal or vertical 6-mm scans to evaluate the IS/OS junction, ELM, and COST lines. Three experienced investigators (Y.I., M.I., T.R.) were masked to the patients’ information, including the postoperative period and the BCVA, when evaluating the SD-OCT images.
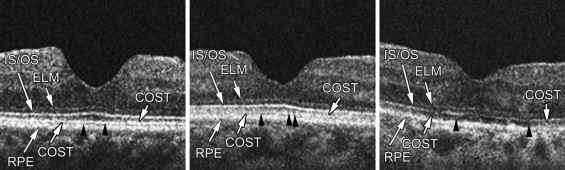
A recovered foveal microstructure in the photoreceptor layer was defined as a recovery of the continuous back-reflecting lines corresponding to the COST line, IS/OS junction, and the ELM line. The COST line at the fovea was classified into 3 grades according to the integrity of the foveal microstructures: distinct and continuous COST line, present but irregular and disrupted line (distinct COST line and irregular COST line was defined as COST+), and absent COST line (COST-) ( Figure 1 ). The grade of COST line was compared to the integrity of the IS/OS junction and ELM lines: both IS/OS junction and ELM intact (IS/OS+/ELM+), IS/OS junction absent but ELM intact (IS/OS-/ELM+), and both IS/OS junction and ELM absent (IS/OS-/ELM-). In addition, the correlations between eyes with COST+ and the postoperative BCVA and between eyes with COST+ and the IS/OS+/ELM+ at postoperative 12 months were calculated.
The axial length was measured with the OA1000 (TOMEY Corp, Nagoya, Japan) preoperatively. For statistical analysis, decimal BCVA was converted to the logarithm of minimal angle of resolution (logMAR).
To compare 2 groups, continuous data were analyzed using Student t tests, but Welch’s t tests were used in cases of unequal variances. For multiple comparisons of 3 groups, continuous data were analyzed using 1-way analysis of variance, and Kruskal-Wallis tests were used when the data were not normally distributed. Forward stepwise regression analysis was performed to investigate the relationships between postoperative foveal microstructures and visual acuity at 12 months. The status of the ELM was not analyzed from the explanatory variables because the ELM of all cases was well restored at 12 months after surgery. Multivariate analysis was also used to determine whether the age, sex, symptom duration, and preoperative BCVA were significantly associated with the COST status at postoperative 12 months.
Results
Of the original 58 eyes, 9 eyes were excluded because of the presence of other retinal diseases including a treated rhegmatogenous retinal detachment, diabetic retinopathy, and high myopia with an axial length > 27.0 mm, or refractive error < −8.0 diopters (D). Eight other eyes were excluded because they were followed for less than 6 months postoperatively. In the end, 41 eyes of 41 patients (15 men, 26 women) met the study criteria for the data analyses.
The preoperative baseline characteristics of the 41 eyes are summarized in Table 1 . The mean age of the patients was 65.8 ± 7.2 years, with a range of 47–80 years. The average refractive error of the 38 phakic eyes was −1.5 D, with a range from −7.0 D to +3.5 D. The mean preoperative decimal BCVA was 0.27 (Snellen equivalent, 20/80; 0.57 logMAR units). The mean postoperative follow-up time was 11.0 months, with a range from 6 to 16 months. The interval between the onset of visual symptoms and the macular hole surgery ranged from 1 to 18 months, with a median of 4.6 months. The mean axial length of 39 of the eyes was 23.6 mm, with a range from 21.2 to 26.8 mm. The preoperative stage of the macular hole was stage 2 in 11 eyes (27%), stage 3 in 25 eyes (61%), and stage 4 in 5 eyes (12%).
| Numbers of eyes (patients) | 41 (41) |
| Age (y), mean ± SD (range) | 65.8 ± 7.2 (47–80) |
| Sex, no. (%) | |
| Male | 15 (37%) |
| Female | 26 (63%) |
| Eye, no. (%) | |
| Right | 20 (49%) |
| Left | 21 (51%) |
| Axial length (mm), mean ± SD | 23.6 ± 1.2 |
| Preoperative BCVA (logMAR), mean ± SD | 0.57 ± 0.24 |
| Sympton duration (months), mean ± SD (range) | 4.6 ± 4.0 (1–18) |
| Preoperative stage, no. (%) | |
| Stage 2 | 11 (27%) |
| Stage 3 | 25 (61%) |
| Stage 4 | 5 (12%) |
| Preoperative diameter of the hole (μm), mean ± SD (range) | 325 ± 172 (136–946) |
| Intravitreal gas tamponade during PPV, no. (%) | |
| Air | 16 (39%) |
| Sulfur hexafluoride | 25 (61%) |
| Combination of cataract surgery, no. (%) | 36 (88%) |
The mean postoperative decimal BCVA was 0.50 (0.30 logMAR units) at 1 month, 0.62 (0.20 logMAR units) at 3 months, 0.65 (0.19 logMAR units) at 6 months, 0.75 (0.12 logMAR units) at 9 months, and 0.78 (0.11 logMAR units) at 12 months. Each postoperative BCVA was significantly better than the baseline BCVA ( P < .0001, Student t tests).
Spectral-Domain Optical Coherence Tomography of Fovea
The integrity of the COST line was determined by SD-OCT ( Figure 2 ). At 1 month, an irregular COST line was seen in 2 eyes (5%) and COST- in 35 (95%) of the 37 eyes examined. At 3 months, an irregular COST line was seen in 5 eyes (16%) and COST- in 26 (84%) of 31 eyes. An eye with COST+ was first seen at 6 months along with an irregular COST line in 3 eyes (11%), and COST- in 23 (85%) of 27 eyes. At 9 months, a distinct COST line was seen in 2 eyes (8%), an irregular COST line in 3 eyes (13%), and COST- in 19 (79%) of the 24 eyes examined. At 12 months, a distinct COST line was seen in 5 eyes (17%), an irregular COST line in 6 eyes (21%), and COST- was seen in 18 (62%) of 29 eyes. The incidence of a distinct COST line gradually increased but the first appearance of a distinct COST line was later than that of IS/OS+.
The integrity of the IS/OS junction and the ELM was determined in a similar fashion. Thirty-seven eyes were examined 1 month after surgery, and IS/OS+/ELM+ was detected in 7 eyes (19%), IS/OS-/ELM+ in 9 eyes (24%), and IS/OS-/ELM- in 21 eyes (57%). The incidence of eyes with IS/OS+/ELM+ gradually increased and that of IS/OS-/ELM- gradually decreased during the postoperative period. Twenty-nine eyes were examined at 12 months, and IS/OS+/ELM+ was seen in 23 eyes (79%) and IS/OS-/ELM+ in 6 eyes (21%). Eyes with IS/OS-/ELM- were not detected at 12 months after the surgery. Eyes with IS/OS+/ELM- were not seen at any postoperative period as reported.
The SD-OCT findings showed that the COST line appeared only after the IS/OS junction and ELM had recovered ( Figure 3 ), although the COST line did not fully recover even after the IS/OS junction and ELM had recovered in some patients ( Figure 4 ).
Relationship Between Spectral-Domain Optical Coherence Tomographic Findings and Visual Acuity
The relationship between the presence of a COST line and the postoperative BCVA was determined ( Figure 5 ). The BCVA of eyes with an irregular COST line was significantly better than that of eyes with COST- at 3, 6, and 9 months after the surgery. The eyes with a distinct COST line had significantly better BCVA than eyes with an irregular COST line or COST- at 12 months after the surgery.
Ten of 11 eyes with a postoperative BCVA ≥ 20/25 at 12 months had a distinct COST or irregular COST line (COST+), which was significantly more than the 8 of 18 eyes with COST- ( P = .015, Fisher exact probability test). The incidence of BCVA ≥ 20/25 in eyes with a distinct COST line was also significantly higher than that with COST- ( P = .038), although the incidence of BCVA ≥ 20/25 in eyes with an irregular COST was not significantly different from that with COST- ( P = .188). In eyes with well-restored IS/OS junction and ELM lines (IS/OS+/ELM+) at 12 months, the eyes with COST+ had significantly better BCVA than that of eyes with COST- ( Figure 6 , P = .030, Welch’s t test). Eyes with a distinct or irregular COST line were observed only in eyes with IS/OS+/ELM+, and none of the eyes had a distinct or irregular COST line in the eyes with IS/OS-/ELM+ or IS/OS-/ELM-. These findings indicated that a recovery of the COST line after macular hole surgery was most likely responsible for the improvement of the BCVA.
Stay updated, free articles. Join our Telegram channel

Full access? Get Clinical Tree


