Purpose
To test the hypothesis that the evaluation of retinal structure can have diagnostic value in differentiating between incomplete congenital stationary night blindness (CSNB2) and retinitis pigmentosa (RP). To compare retinal thickness differences between patients with CSNB2 and myopic controls.
Design
Prospective cross-sectional study.
Methods
Ten eyes of 5 patients diagnosed with CSNB2 (4 X-linked recessive, 1 autosomal recessive) and 6 eyes of 3 patients with RP (2 autosomal dominant, 1 autosomal recessive) were evaluated with spectral-domain optical coherence tomography (SD OCT) and fundus autofluorescence (FAF). Diagnoses of CSNB2 and RP were confirmed by full-field electroretinography (ERG). Manual segmentation of retinal layers, aided by a computer program, was performed by 2 professional segmenters on SD OCT images of all CSNB2 patients and 4 age-similar, normal myopic controls. Seven patients were screened for mutations with congenital stationary night blindness and RP genotyping arrays.
Results
Patients with CSNB2 had specific findings on SD OCT and FAF that were distinct from those found in RP. CSNB2 patients showed qualitatively normal SD OCT results with preserved photoreceptor inner segment/outer segment junction, whereas this junction was lost in RP patients. In addition, CSNB2 patients had normal FAF images, whereas patients with RP demonstrated a ring of increased autofluorescence around the macula. On SD OCT segmentation, the inner and outer retinal layers of both X-linked recessive and autosomal recessive CSNB2 patients were thinner compared with those of normal myopic controls, with means generally outside of normal 95% confidence intervals. The only layers that demonstrated similar thickness between CSNB2 patients and the controls were the retinal nerve fiber layer and, temporal to the fovea, the combined outer segment layer and retinal pigment epithelium. A proband and his 2 affected brothers from a family segregating X-linked recessive CSNB2 had a mutation, p.R614X, in the gene encoding calcium channel, α 1F subunit.
Conclusions
CSNB2 patients (X-linked recessive and autosomal recessive) had significantly thinner retinas than myopic controls. However, they demonstrated qualitatively normal SD OCT and FAF images, and therefore can be differentiated from RP patients with these techniques. Although ERG testing remains the gold standard for the diagnosis of these conditions, FAF and SD OCT systems are more widely available to community ophthalmologists, offer shorter acquisition times, and, unlike ERG, can be performed on the same day as the initial clinic visit. Therefore, as a supplement to ERG and genetic testing, we advocate the use of FAF and SD OCT in the examination of patients with CSNB2 and RP.
Congenital stationary night blindness (CSNB) refers to a group of disorders characterized by night blindness and nonprogressive retinal dysfunction. Onset of disease occurs in infancy, and patients often have accompanying symptoms of nystagmus and strabismus. Best-corrected visual acuity often is reduced, with myopic and sometimes hyperopic refractive errors, and with astigmatism as well.
CSNB has been classified into complete and incomplete (CSNB2) types, based on electroretinogram (ERG) findings and clinical characteristics. In the complete form, full-field ERG testing reveals normal to mildly subnormal cone function and complete absence of rod function. Mutations in the NYX gene have been found to be responsible for the condition. In contrast, patients with the incomplete form have greater disturbances of cone function, but they maintain some rod function. X-linked recessive CSNB2 (CSNB2A; Mendelian Inheritance in Man no. 300071) and autosomal recessive CSNB2 (CSNB2B; Mendelian Inheritance in Man no. 610427) inheritance patterns have been reported, with the CSNB2A subtype linked to mutations in the gene encoding a voltage-gated calcium channel, alpha 1F subunit (CACNA1F), and the CSNB2B subtype linked to mutations in the gene encoding calcium-binding protein 4 (CABP4). Both complete CSNB and CSNB2 demonstrate the classic negative ERG pattern, or Schubert Bornschein type, in which the b-wave is smaller than the a-wave during maximal response.
Retinitis pigmentosa (RP) refers to a diverse group of disorders characterized by night blindness and progressive retinal dysfunction. Visual loss first occurs peripherally and then progresses inward toward the macula. ERG findings demonstrate global photoreceptor dysfunction, with rods more greatly affected than cones. X-linked recessive, autosomal dominant, and autosomal recessive inheritance patterns have been described previously. More than 45 genes have been implicated in RP, contributing to the vast heterogeneity of phenotypes in this set of disorders.
Novel imaging techniques and genetic analysis provide greater understanding of ophthalmic diseases. With fundus autofluorescence (FAF) imaging, an abnormal hyperautofluorescent ring surrounding the fovea has been demonstrated in 59% to 94% of RP patients. Spectral-domain optical coherence tomography (SD OCT) has revealed loss of the inner segment/outer segment (IS/OS) junction and generalized decrease in retinal thickness across the width of the hyperautofluorescent ring in RP patients. (From our own analysis of more than 100 RP patients, we believe that the incidence of the hyperautofluorescent ring in RP is far closer to 94% than 59% with regard to patients who have at least some preserved IS/OS junction).
The objectives of this study were to describe the qualitative SD OCT features in CSNB2, to compare SD OCT quantitative thickness data between CSNB2 patients and normal myopic controls, to describe FAF features in CSNB2, and to compare the FAF and SD OCT appearances of CSNB2 and RP. We also report the phenotypes of a CSNB2A family carrying a nonsense mutation, p.R614X, in the gene encoding CACNA1F.
Methods
This prospective, cross-sectional study included 10 eyes of 5 patients diagnosed with CSNB2 (4 X-linked recessive [CSNB2A], 1 autosomal recessive [CSNB2B]), 6 eyes of 3 patients diagnosed with RP (2 autosomal dominant, 1 autosomal recessive), and 8 eyes of 4 age-similar normal myopic controls with spherical equivalents between −2.50 and −5.50 diopters. Three of the 5 patients with CSNB2 were brothers from the same family; all other patients were unrelated. The clinical diagnosis of CSNB2 and RP was established by retina specialists and confirmed by full-field scotopic and photopic ERGs performed according to the International Society for Clinical Electrophysiology of Vision standards.
Fundus Autofluorescence
FAF imaging was performed with a confocal scanning laser ophthalmoscope (OCT-SLO Spectralis/Heidelberg Retina Angiograph 2; Heidelberg Engineering, Heidelberg, Germany) after pupil dilation with topical 0.5% tropicamide and 2.5% phenylephrine. FAF imaging was performed using a 30 × 30-degree field of view at a resolution of 1536 × 1536 pixels. An optically pumped solid-state laser (488 nm) was used for excitation, and a 495-nm barrier filter was used to modulate the blue argon excitation light. Standard procedure was followed for the acquisition of FAF images, including focus of the retinal image in the infrared reflection mode at 820 nm, further focus and sensitivity adjustment at 488 nm, and acquisition of at least 9 single 30 × 30-degree FAF images encompassing the entire macular area with at least a portion of the optic disc. The 9 single images were averaged computationally to produce a single frame with improved signal-to-noise ratio.
Spectral-Domain Optical Coherence Tomography
SD OCT was performed with the OCT-SLO Spectralis (Heidelberg Engineering, Heidelberg, Germany) on CSNB2 and RP patients, as well as on myopic controls. This equipment allows for simultaneous OCT scans and FAF imaging and subsequent image superimposition. OCT imaging was acquired by a broadband 870-nm superluminescent diode that scanned the retina at 40 000 A-scans per second, with an optical axial depth resolution of 7 μm. The standard protocol included at least 25 OCT scans averaged to reduce the signal-to-noise ratio by a factor of 5. The scans included at least 1 9-mm horizontal line scan through the fovea.
SD OCT images also were obtained from patients and controls using the Cirrus Spectral-Domain OCT (Carl Zeiss Meditec, Inc, Dublin, California, USA). The acquisition protocol consisted of a 5-line raster scan and a macular cube 512 × 128 scan pattern in which a 6 × 6-mm region of the retina was scanned (a total of 65 536 sampled points) within a scan time of 2.4 seconds.
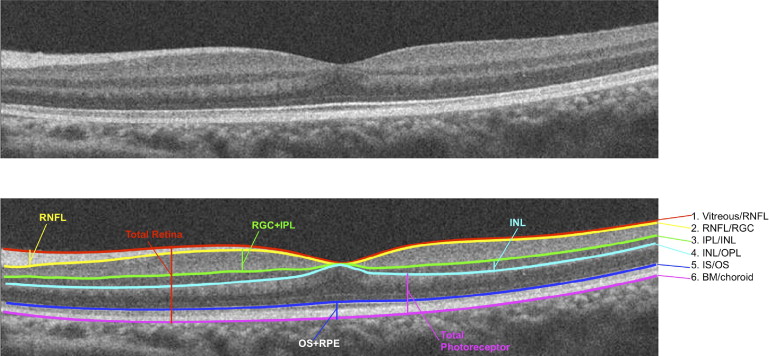
To determine retinal layer thicknesses of CSNB2 patients and myopic controls on SD OCT, manual segmentation aided by a computer program was performed by 2 experienced segmenters (M.A.L., R.R.), as previously described. The results presented below are the averages of these 2 segmenters. All line scans were flattened before thickness analysis to ensure that results were not affected by the curvature of the scans. Six borders were segmented, as shown in Figure 1 , and the thicknesses of the following layers were determined: retinal nerve fiber layer (RNFL); retinal ganglion cell layer plus inner plexiform layer (RGC + IPL); inner nuclear layer (INL); total receptor; photoreceptor outer segments plus retinal pigment epithelium (OS + RPE), and total retina. The layers were segmented as follows: RNFL (vitreous/RNFL minus RNFL/RGC), RGC + IPL (RNFL/RGC minus IPL/INL), INL (IPL/INL minus INL/outer plexiform layer), total receptor (INL/outer plexiform layer minus Bruch membrane/choroid), OS + RPE (IS/OS minus Bruch membrane/choroid), and total retina (vitreous/RNFL minus Bruch membrane/choroid border).
Five CSNB2 patients and 4 age-similar myopic controls imaged with the Cirrus OCT were included in the final segmentation analysis. An additional 10 myopic controls were analyzed during the study; however, because they were imaged only with the Spectralis OCT, these controls were excluded from final analysis for the sake of consistency.
Electroretinography
Full-field ERGs (Diagnosys LLC, Lowell, Massachusetts, USA) were recorded from both eyes with DTL electrodes according to the International Society for Clinical Electrophysiology of Vision standard in both scotopic and photopic states to assess retinal function. The amplitudes and implicit times obtained from both eyes of each patient were compared with age-matched normal values, in which lower limits were calculated for 2 standard deviations.
Genetic Analyses
DNA was extracted from whole blood with the QIAamp DNA Blood Maxi Kit 51194 (Qiagen, Inc, Valencia, California, USA). Four CSNB patients were screened with the CSNB APEX array at Asper Biotech, Inc (Tartu, Estonia; www.asperophthalmics.com ), and the identified variants were confirmed by direct sequencing. All RP patients were screened with APEX dominant and recessive RP arrays, depending of their mode of inheritance. No RP-associated mutations were detected by the array screening.
Results
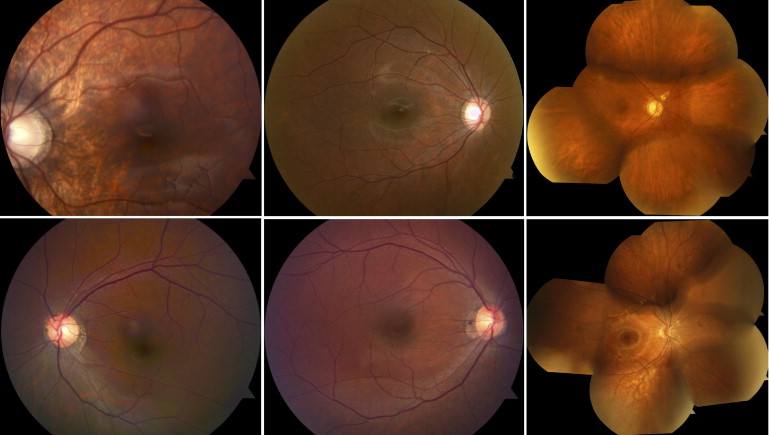
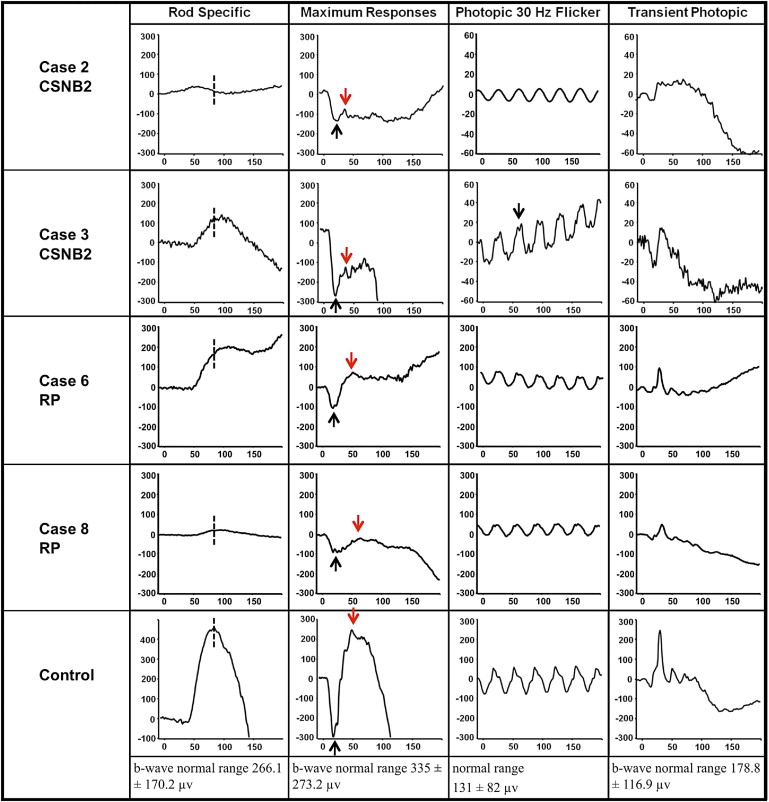
The clinical characteristics of the 8 patients are summarized in the Table . Five patients had CSNB2 (4 X-linked recessive [CSNB2A] and 1 autosomal recessive [CSNB2B]), and 3 patients had RP (2 autosomal dominant, 1 autosomal recessive). Snellen best-corrected visual acuity for patients with CSNB2 ranged from 20/40 to 20/70, and patients ranged in age from 6 to 69 years of age. Each of the 3 patients with RP had Snellen best-corrected visual acuity of 20/20 ( Table ). Fundus photographs from all of these patients looked unremarkable, with the exception of myopic changes ( Figure 2 ). All CSNB2 patients demonstrated an electronegative response on maximal full-field scotopic ERG. All RP eyes exhibited severely diminished full-field scotopic electroretinography responses, and photopic responses were decreased in amplitude and delayed in implicit time compared with those of age-matched normal controls. Representative ERG waveforms of 2 CSNB2 patients, 2 RP patients, and 1 normal control are shown in Figure 3 . Compared with controls, all 4 patients demonstrated abnormal rod-specific responses. Patients 3 and 8 had delayed rod-specific implicit peak times, Patient 2 had an extinguished rod-specific response, and Patient 6 showed a characteristic photomyoclonic artifact. On maximal response, Patients 2 and 3 with CSNB2 clearly demonstrated electronegative ERG responses, whereas Patients 6 and 8 with RP had normal maximal b-wave-to-a-wave ratios. Photopic 30-Hz flicker testing revealed a double-peak pattern in Patient 3, characteristic of CSNB2. The first patient (Patient 2, CSNB2B) lost the characteristic double-peak waveform because of narrow band filtering and movement artifact.
| Patient No. | Diagnosis | Age (y) | Sex | BCVA | |
|---|---|---|---|---|---|
| Right Eye | Left Eye | ||||
| 1 | CSNB2A | 6 | M | 20/70 | 20/60 |
| 2 | CSNB2A | 11 | M | 20/40-2 | 20/40-2 |
| 3 | CSNB2A | 9 | M | 20/40 | 20/40 |
| 4 | CSNB2A | 12 | M | 20/60 | 20/60 |
| 5 | CSNB2B | 69 | M | 20/70 | 20/60 |
| 6 | RP | 7 | M | 20/20 | 20/20 |
| 7 | RP | 10 | M | 20/20 | 20/20 |
| 8 | RP | 30 | M | 20/20 | 20/20 |
Three CSNB2 patients were siblings from the same family; they all possessed a nonsense mutation, p.R614X, in the gene encoding CACNA1F. No nystagmus was noted in this family.
On FAF imaging, all 6 study eyes with RP demonstrated a hyperautofluorescent ring that was not evident on fundus biomicroscopy. The autofluorescence appeared normal within the ring for all of these eyes. Other than 1 CSNB2 patient who demonstrated bilateral peripapillary hypoautofluorescence consistent with myopic changes, eyes with CSNB2 demonstrated no abnormal FAF features. Figure 4 compares the autofluorescence findings of CSNB2 patients in the first row with those of RP patients in the second row. No hyperautofluorescent rings are visible in the CSNB2 images, but rings are seen clearly in each of the RP images. The size of this ring varied in the 3 patients—the smallest ring was visible in the parafoveal region (Patient 7, Figure 4 ), whereas the largest ring was visible just beyond the vascular arcades (Patient 8, Figure 4 ). The outer boundary of each hyperautofluorescent ring is indicated by a yellow arrow.
We compared SD OCT findings in the regions of hyperautofluorescence in RP with SD OCT features in CSNB2 patients. In all eyes with RP, there was loss of the ONL, ELM, and IS/OS junction across the width of the hyperautofluorescent ring. In the zone of normal autofluorescence within the ring, the retinal morphologic features appeared normal in all 6 RP eyes, with intact ONL, ELM, and IS/OS junction ( Figure 5 ). In contrast to RP patients, all CSNB2 patients had normal-appearing retinas on SD OCT and FAF, without qualitative loss of the ONL, ELM, or IS/OS junction ( Figure 6 ).
Stay updated, free articles. Join our Telegram channel

Full access? Get Clinical Tree


