Indocyanine Green Videoangiography: Principles, Technique, and Complications
Christina M. Klais
Michael D. Ober
Nicole E. Gross
Jason S. Slakter
Since its introduction in the 1960s, intravenous fluorescein angiography has played a crucial role in the diagnosis and treatment of a variety of retinal diseases.1 It provides excellent spatial and temporal resolution of the retinal circulation with a high degree of fluorescence efficiency and minimal penetration of the retinal pigment epithelium (RPE). In most eyes, the melanin pigment within the RPE is sufficient to provide contrast for imaging intensely fluorescent retinal capillaries. Unfortunately, there are certain limitations to this technique, particularly with respect to imaging the choroidal circulation secondary to poor transmission of fluorescence through ocular media opacifications, fundus pigmentation, and pathologic manifestations such as serosanguineous fluid and lipid exudation.
The relatively poor fluorescence efficiency of the indocyanine green (ICG) molecule and its limited ability to produce high-resolution images on infrared film initially restricted its angiographic application; however, ICG has subsequently been found to have several advantages over sodium fluorescein, especially in imaging choroidal vasculature. The emergence of high-resolution infrared digital imaging systems, specifically designed for ICG and a growing awareness of choroidal vascular lesions, has led to a resurgence of interest in ICG angiography.2,3 The applications of ICG angiography continue to grow in number; the full extent of its capabilities is not yet known.
HISTORY
Initially used in the photographic industry, ICG was introduced into medicine in 1957.4 Its first application in medicine was in measuring cardiac output.5 ICG was later used as a method of measuring hepatic blood flow and function.6 In 1969, the first attempts at using ICG angiography were performed by Kogure and Choromokos studying cerebral circulation in a dog.7 The next year, Kogure et al. reported on intra-arterial ICG absorption of the choroid in monkeys.8 The first human ICG angiogram was of the carotid artery by David and collegues.9
In 1971, Hochheimer modified the system for ICG angiography by changing the color film that had been used previously to black-and-white infrared film.10 In 1972, Flower and Hochheimer performed the first intravenous ICG angiography to image the human choroid.11 In the next years, Flower and coworkers began a series of studies on primates and human to evaluate the potential usefulness of ICG angiography in the investigation of the normal and pathologic eye.12,13,14,15 They refined the procedure with recommendations for the concentration of the dye and method of injection. Flower also modified the transmission and emission filters to improve the resolution of the choroidal vessels. They eventually found that infrared film lacked the sensitivity to adequately capture low-intensity ICG fluorescence, which limited the clinical usefulness of ICG angiography.
The resolution of ICG angiography was improved in the mid 1980s by Hayashi and coworkers, who developed improved filter combinations with sufficient sensitivity for near-infrared wavelength.16 They were instrumental in the transition from film to videotape by introducing videoangiography.17,18,19 Although the sensitivity of the video camera system was a vast improvement, its inability to study individual images and the potential light toxicity using a 300-watt halogen bulb restricted the duration and quality of the technique.
In 1989, Destro and Puliafito performed ICG angiography with a system very similar to that described by Hayashi.20 Imaging was improved by better filter combinations, but images were still stored and later analyzed using videotape recording. In the same year, the use of scanning laser ophthalmoscope for ICG videoangiography was introduced by Scheider and Schroedel.21 In 1992, Guyer introduced the use of a 1024×1024-line digital imaging system to produce high-resolution ICG angiography.2 Images were digitized, displayed on a high-resolution monitor, and stored on an optical disc, but the system lacked flash synchronization with the video camera. Finally, Yannuzzi and coworkers described a 1024-line resolution system that was synthesized with the appropriate flash synchronization and image storage capability, permitting high-resolution, long-duration ICG angiography.3
CHEMICAL PROPERTIES
ICG is a sterile, water-soluble tricarbocyanine dye with the empirical formula C43H47N2NaO6S2and molecular weight of 775 daltons.14 Chemically, it is an anhydro-3,3,3′,3′-tetramethyl-1-1′-di-(4-sulfobutyl)-4,5,4′,5-dibenzoindotricyanine hydroxide sodium salt with both lipophilic and hydrophilic characteristics (Fig. 1).
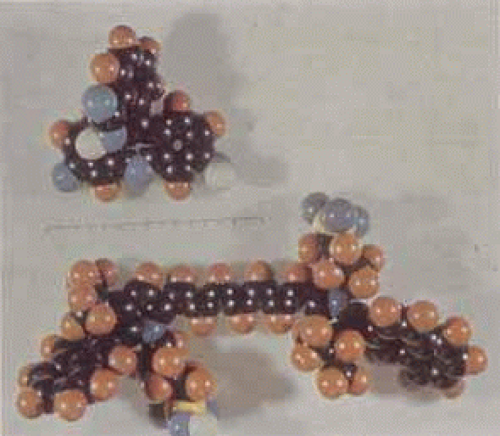 Fig. 1 Structural model of sodium fluorescein (top) and indocyanine green (bottom) molecules. Although the indocyanine green (ICG) is somewhat larger than the fluorescein molecule, it is actually the high protein-binding efficiency to large molecules such as albumin that limits its leakage during ICG angiography. |
ICG is the product of a complex, synthetic process. Sodium iodine is incorporated to create an ICG lyophilisate that can be dissolved in water. Once dissolved, ICG tends to precipitate at high concentration or when mixed in physiologic saline. It is supplied with a solvent consisting of sterile water at pH 5.5–6.5. The aqueous ICG dye solution can decay at a rate of approximately 10% in 10 hours and should be used within this time.22 The final product contains no more than 5% sodium iodine.
OPTICAL PROPERTIES
ICG absorbs light in the near-infrared range of 790 to 805 nm.23 The emission spectrum ranges from 770 to 880 nm, peaking at 835 nm. Both absorption and emission spectra are shifted toward shorter wavelength when ICG is in an aqueous solution, whereas the overall intensity of the fluorescence is diminished.
Whereas fundus photography and fluorescein angiography do not provide detailed images of the choroidal circulation, the physical characteristics of ICG allow for visualization of the dye through overlying melanin and xanthophyll.24 It has been demonstrated that the retinal pigment epithelium and choroid absorbs 59% to 75% of blue-green light (500 nm) used in fluorescein angiography, but only 21% to 38% of near-infrared light (800 nm) used in ICG angiography. The activity of ICG in the near-infrared light also allows visualization through serosanguineous fluid, shallow hemorrhage, pigment, and lipid exudate, which, even in small amounts, block visualization of sodium fluorescein (Fig. 2). Enhanced imaging of conditions such as choroidal neovascularization (Fig. 3) and pigment epithelium detachment is the result (Fig. 4).
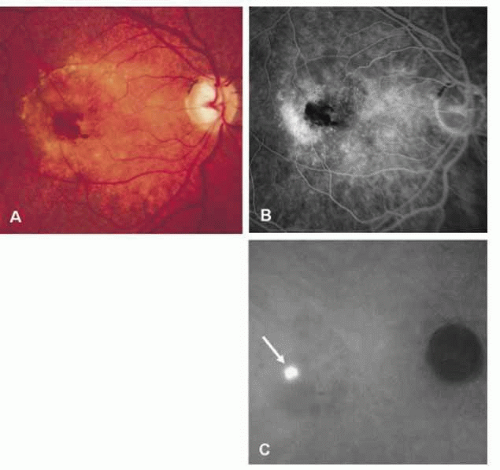 Fig. 2 A, Clinical photograph demonstrates subretinal and intraretinal hemorrhages as well as detachment of the retinal pigment epithelium and the neurosensory retina in a patient with neovascular age-related macular degeneration. B, Late-phase fluorescein angiogram reveals blocked fluorescence from the hemorrhages and indistinct leakage. C, A late-phase ICG angiogram demonstrates a well-defined hyperfluorescence or so-called focal hot spot (arrow) representing a retinal angiomatous proliferation. This lesion is well visualized through the area of hemorrhage because of good penetration of the infrared light used in ICG angiography.
Stay updated, free articles. Join our Telegram channel
Full access? Get Clinical Tree
 Get Clinical Tree app for offline access

|