Heidelberg Retina Tomography
Albert S. Khouri
Robert D. Fechtner
Murray Fingeret
Historical Background
Glaucoma has long been defined by the structural and functional changes that result from this family of optic neuropathies. Structural examination of the optic nerve and retinal nerve fiber layer (RNFL) are essential components of initial evaluation and subsequent follow-up. Until recent times, recording of these examinations depended on description, drawings, or photographs. Evaluation of the optic nerve to diagnose disease or detect progression remained a subjective process performed by the clinician.
There are significant limitations in the subjective evaluation of the optic disc and RNFL, which stimulated the development of more accurate and reproducible techniques that would quantify the size and shape of the optic nerve and surrounding retinal tissue. The first stages were begun almost 2 decades ago as investigational instruments, with the evolved clinical tools such as confocal scanning laser ophthalmoscopy (cSLO) or confocal scanning laser polarimetry now used to complement the glaucoma examination. In large part, advances in imaging are due to advances that have taken place in computer hardware, software, and digital image acquisition. Developments in these areas have allowed the accurate capture, storage, retrieval, and analysis of optic nerve topography. Several textbooks are available that overview in detail the principles of confocal scanning ophthalmoscopy and Heidelberg retina tomography.1,2,3
Evolution of the Heidelberg Retina Tomograph
cSLO was introduced in 1986 with the Laser Tomographic Scanner (Heidelberg Instruments, GmbH, Heidelberg, Germany), which was used principally as a research tool and served as the prototype for the current generation of instruments. This was a complex instrument to operate, but basic validation studies were performed to support further development of this technology.
The Heidelberg Retina Tomograph (HRT; Heidelberg Engineering GmbH, Heidelberg, Germany) is the most widely used application of cSLO. HRT 1 was the first-generation instrument, used both clinically and in research settings and designed for the acquisition of three-dimensional images of the nerve head and posterior pole. The HRT provides rapid, reproducible topographic measurements of the size and shape of the disc, neuroretinal rim, and optic cup along with measurements of the peripapillary retina and RNFL. Most validation research, including accuracy and reproducibility studies, were performed with the HRT 1. The HRT 2 was the first clinically practical instrument for optic nerve topography examination and became widely accepted in clinical practice. The HRT 3 was introduced in fall 2005 and incorporated advances in software and hardware yet maintained a stable platform to allow analyses on data acquired with previous generations of HRT. Image acquisition with HRT 3 is similar to the HRT 2, with improvements in the monitoring and feedback of quality control. The HRT 3 hardware changes make the device more portable; it can be run by using a laptop computer. New software allows for additional analyses based on three-dimensional–shaped models of the optic nerve head in addition to new asymmetry and progression (topographic change analysis [TCA]) tools. The normative database is larger than HRT 2, with three different ethnic-specific databases available.
Confocal Scanning Laser Ophthalmoscopy: How Does Heidelberg Retina Tomography Work?
The principle of confocal imaging is to illuminate the optic nerve and retina through a single pinhole and to image this point source on the object of interest. The light returns through the imaging optics and passes through a pinhole in a plane conjugate to the point of interest. Only light that returns from the point of interest can pass through the pinhole and be detected. This results in an image being returned from a single focal plane. Light from any point not in that focal plane will be greatly attenuated (Fig. 1).
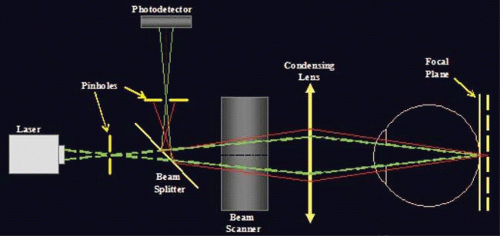 Figure 1. A schematic representation of confocal scanning ophthalmoscopy. A laser source illuminates the optic nerve, with only light returning from the point of interest passing through the pinhole and reaching the photodetector. |
To image a plane rather than a point, an array of points in that plane must be scanned point by point. In a cSLO system, the illuminating light spot can be rapidly moved (scanned), resulting in a focal plane of data points or an optical section. For the HRT 2 and 3, this imaging plane is 150 × 150. The horizontal (x) and vertical (y) scanning is conducted by using oscillating mirrors. Depth (z) is controlled (i.e., the focal plane is changed) by moving the objective lens. A transfer function is used to establish the location along the z-axis of maximum reflectivity. This is defined to be the height at that coordinate and is used to generate the topography image (Fig. 2).
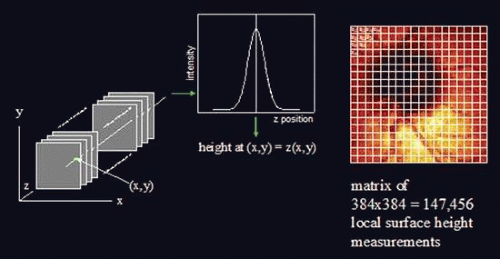 Figure 2. For the HRT 2 and 3, the horizontal (x) and vertical (y) scanning is conducted by using oscillating mirrors. Depth (z) represents the focal plane and is controlled by moving the objective lens (left). A transfer function is used to establish the location along the z-axis of maximum reflectivity (middle). This is defined to be the height at that coordinate and is used to generate the topography image (right). |
Historical Validation: Accuracy and Reproducibility
A plastic model was developed for accuracy studies, which has limitations when trying to generalize these results to living tissue. It provided, at best, an approximation of expected accuracy in a living eye.4,5 In 1998, Yucel and colleagues6 compared histologically measured RNFL density in ten monkey eyes to values obtained with the HRT in the same eyes. They found that multiple HRT measures significantly correlated with the optic nerve fiber number counts. In particular, they showed that both RNFL thickness values and RNFL cross-sectional area correlated strongly with the nerve fiber counts (Spearman r-value of 0.71 and 0.75, respectively).
While accuracy may be more important when trying to categorize eyes as normal or abnormal, the detection of change depends more heavily on the reproducibility (ability to obtain the same measurement consistently). Several studies have looked at mean standard deviation of all pixels across several images as a measure of reproducibility. Reproducibility of the HRT 1 in normal, glaucoma suspect, and glaucoma eyes was tested and estimated consistently at approximately 20 to 30 μm. Test–retest variability for condensed pixels (4 × 4) pooled across three sequential images was studied, and mean standard deviation equivalents were 25.94 μm and 31.20 μm for normal and glaucomatous eyes, respectively.7,8 One of the limitations of using mean standard deviation to evaluate reproducibility is that each image contains a large number of pixels from the relatively flat retina and only a minority of pixels from the area of interest, the optic nerve. Reproducibility has been shown to be poorer in the highly contoured areas of greatest interest and the sloping regions of the neuroretinal rim. Reproducibility of specific parameters derived from these instruments have also been studied.7,9 Reproducibility was not affected by pupil size, supporting the validity of obtaining images through undilated pupils.10,11 In general, the lowest variability was found in retinal areas with flat slopes away from blood vessels. The highest variability was found along the cup border and at blood vessels.8 A change in refractive error of more than two diopters was found to induce a significant change in measured topography, thus affecting reproducibility.12
The Heidelberg Retina Tomograph 2
While the original HRT instrument provided the operator with control over many of the imaging variables, it required a very experienced operator to obtain good-quality images. Clinicians who were trying to utilize this device in practice recognized the need for a more user-friendly and semiautomated platform, introduced as the HRT 2.
A rapid-scanning laser diode (670 nm, class 1 laser system) is used as the illumination source. The intensity of the laser is 100 times lower than the luminance of a digital fundus flash camera. Images can be obtained with light intensities as little as one thousandth of typical fundus flash illumination. The optical resolution is limited by the optics of the eye to about 10 μm transversely and 300 μm longitudinally. However, longitudinal measurements can be determined more accurately than this. If the serial optical sections are spaced closely, the height measurement can be determined from the plane of maximum reflectivity.
The HRT 2 generates a robust data set by using an image that has 384 × 384 pixels found in each of 16-64 optical sections; the data set is >147,000 independent local height measurements from >2 million data points. When one considers that automated threshold perimetry generates from 55 to 72 discreet values, it is clear that powerful analysis strategies are needed to best interpret the data. There are many approaches to data analysis. For example, data can be reviewed by pixel, region, or a derived parameter such as neuroretinal rim area.
Once images are acquired and processed, the topography standard deviation is calculated. A standard deviation <20 μ indicates excellent image quality. An image with a standard deviation >40 μ should be interpreted with caution. A contour line that outlines the optic disc margin must be drawn by an operator, which results in the computation of the stereometric parameters, Classification of the eye and comparison with previous examinations (when available) can then be performed.
The Heidelberg Retina Tomograph 3
Several advances were introduced in fall 2005 with the HRT 3. Hardware advances make the unit more portable. Software advances include the glaucoma probability score (GPS) and new asymmetry and progression analyses. The database on HRT 3 has been expanded and is stratified by ethnic groups. Three ethnic-specific databases are available that can be selected for patients of white, black, or Indian descent. Other ethnic databases are in development. Quality control checks were enhanced to provide real-time image feedback during acquisition for focus, illumination, and disc centering, among others. As of the time of this writing, there have been very few independent evaluations of the software published in the peer-reviewed literature.
As mentioned previously, the HRT 2 software calculates topographic parameters once the optic disc margins are outlined by an operator. The latest HRT 3 software (version 3.0) can perform analyses with or without a contour line, called the glaucoma probability score. With the GPS, an automated analysis is provided that combines three-dimensional modeling of the entire topographic image. The constructed three-dimensional models of optic nerve head shape do not require placement of a contour line manually and do not require a reference plane for analysis. The resultant morphologic parameters are analyzed by machine learning classifiers.
Clinical Operation
Once the patient is positioned in front of the instrument, the optic disc is brought into focus (fine focus can be gauged with a color-coded indicator on the computer screen). The HRT 2 automatically performs a prescan through the disc to determine the depth range of the individual’s optic nerve. Using this information, the fine focus and scan depth are automatically adjusted to ensure that the entire cup depth is scanned. Each two-dimensional optical section takes about 0.025 seconds, and a complete scan of 2 mm depth can be performed in about 1 second. A typical imaging session, including a prescan and three confocal scans, is usually obtained within 7 seconds.
Examination can be performed undilated or dilated. The HRT 2 or 3 automatically obtains three scans, with quality control measures to detect inadequate scans due to blinking or fixation shifts, and repeats any faulty scan to ensure that three adequate scans are obtained during the imaging session. The three scans are then automatically aligned, and an average is calculated to create the mean topography image. This also enables an assessment of the variability of the images for a given eye at a given visit. Dilation is not needed if the pupil is 3 to 4 mm in diameter and the media are clear. Older individuals, especially those with cataracts, are more likely to require dilation before imaging. Image quality degrades typically with ringlike artifacts or in subjects with dry eye (or if the eye remains open for a long time during an imaging session). Once the images have been captured and before the system can compute topographic parameters, the operator must mark the margins of the optic nerve boundaries (some analyses can be performed with the HRT 3 instrument without marking the optic nerve boundaries). Once three points are identified, a circle appears that links them together. Anywhere from four to six points are typically used to create the contour line, which is then used for calculation of the stereometric parameters and Moorfields regression analysis (MRA). This outlining process has been controversial and is a well-recognized source of interobserver variability because different observers do not always agree where the disc margins should be placed. The process of outlining the optic disc thus introduces an element of uncontrolled variability.13,14,15 Different landmarks may be used to make contour line placement more exact. These include the appearance of the scleral ring, the bending of vessels at the disk margin, and the location of peripapillary atrophy as well as clues from the interactive height profile (Fig. 3A–C). The nasal border of the disc may be more challenging to identify because of masking by blood vessels. The three-dimensional interactive display aids in proper placement of the contour points (Fig. 4). It is often helpful to draw the contour line after viewing the three-dimensional image or a stereoscopic optic nerve image.
Stay updated, free articles. Join our Telegram channel

Full access? Get Clinical Tree


