Fundus Autofluorescence in Cone and Cone-Rod Dystrophies

Fundus Autofluorescence in Cone and Cone-Rod Dystrophies
Michel Michaelides
INTRODUCTION
The cone dystrophies (COD) and cone-rod dystrophies (CORD) are a heterogeneous group of disorders in terms of both clinical features and underlying genetic basis. They are characterized by reduced central vision, color vision abnormalities, visual field loss, and a variable degree of nystagmus and photophobia. There is absent or severely impaired cone function on electroretinography (ERG) and psychophysical testing. Patients with CORD develop additional rod system abnormalities that lead to night-blindness later in the disease process.
Disorders of cone function can be usefully divided into stationary (cone dysfunction syndromes) and progressive (COD and CORD) disorders (1,2). The stationary cone dysfunction syndromes often present shortly after birth or in infancy. Progressive cone dystrophies usually present in childhood or early adulthood, with many patients developing rod photoreceptor involvement later in life, thereby leading to considerable overlap between progressive COD and CORD. In this chapter the term CORD is used to describe those disorders in which subjects have significant secondary involvement of the rod system at an early stage, in contrast to progressive COD, in which rod involvement, if present, occurs late in the disease process.
COD and CORD can be inherited as autosomal dominant (AD), autosomal recessive (AR), or X-linked (XL) recessive traits. When an inheritance pattern can be reliably established, it is most commonly AD (3,4). Mutations in 14 genes have been described to date, with mutations in peripherin/RDS, ABCA4, and RPGR being the most common causes of AD, AR, and XL COD and CORD, respectively (2,5).
This chapter will concentrate only on progressive disorders, including COD and CORD, since data on fundus autofluorescence (AF) imaging in the various stationary cone dysfunction syndromes are, to date, very limited (6).
MOLECULAR BASIS
The molecular basis of COD and CORD is complex because of their genetic heterogeneity. The molecular basis of some of the most common forms of COD and CORD is discussed below (see Fundus Autofluorescence subsection).
CLINICAL FEATURES
Patients with COD are not usually symptomatic until late childhood or early adulthood. The age of onset of visual loss and the rate and degree of progression is variable; however, visual acuity usually deteriorates over time to the level of 20/200-counting fingers. Photophobia is often a prominent early symptom. Individuals with CORD will, in addition, complain of night-blindness. The retinal dystrophy is usually isolated but may be associated with systemic abnormalities (2).
FIGURE 11B.1. Color fundus photograph (left) and AF image (right) in a patient with cone dystrophy and bull’s-eye maculopathy.
In COD, fundus examination may show a typical bull’s-eye appearance (Fig. 11B.1). However, in some cases there may only be minor macular retinal pigment epithelium (RPE) disturbance. The optic discs show a variable degree of temporal pallor. The retinal periphery is usually normal. In CORD, fundus examination may show a bull’s-eye appearance in the early stages, with macular atrophy developing over time. Peripheral RPE atrophy, retinal pigmentation, arteriolar attenuation, and optic disc pallor can be seen in the late stages of the disease, similarly to the rod-cone dystrophies (see Chapter 11A). The sign of the “dark choroid” may be seen on fluorescein angiography (7). A tapetal-like sheen, which may change in appearance on dark adaptation (the Mizuo-Nakamura phenomenon), has been described in association with XLCORD (8).
DIAGNOSTIC TESTS
Electrophysiology
In COD or in the early stages of CORD, ERG shows normal rod responses but significantly abnormal cone responses. The 30Hz flicker ERG is usually of increased implicit time, but rarely the implicit time is normal and amplitude reduction is the only abnormality (Table 11B.1) (9,10). In CORD, both rod and cone thresholds are elevated on psychophysical testing and the ERG shows reduced rod and cone amplitudes, with the cone ERGs being more abnormal than the rod ERGs. A negative ERG can be also observed in some patients (Table 11B.1). An unusual form of CORD with abnormal cone function and supernormal rod responses has been also described (11,12). Obligate carriers of XL COD and CORD may show evidence of cone dysfunction on electrophysiological or psychophysical testing (13, 14, 15).
Imaging Studies
Fluorescein angiography, indocyanine green angiography, and optical coherence tomography do not, to date, have a significant role in the evaluation of patients with COD and CORD.
TABLE 11B.1 Genetics, Age of Onset, Fundus Features, Autofluorescence, and Electrophysiological Abnormalities in Cone and Cone-Rod Dystrophies

Gene Defect (inheritance)

Age of Onset

Phenotype

Fundus Changes

AF

PERG

ERG

GUCA1A (AD)

3rd-5th decade

COD, CORD

ranges from mild macular RPE disturbance to RPE atrophy, with normal peripheral retina

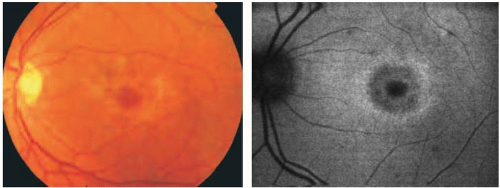
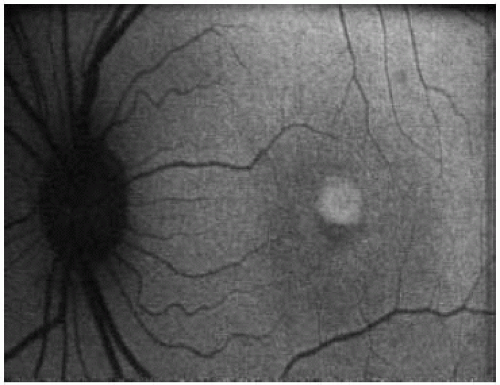
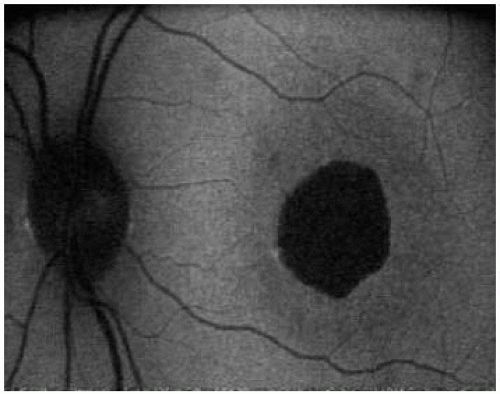
focal increased AF at the macula; perifoveal rings of increased AF; reduced AF in areas of atrophy

severely reduced or undetectable

severely reduced amplitude of single flash and flicker with minimal or no 30Hz flicker implicit time shift; in CORD, additional reduction in rod responses

GUCY2D (AD)

1st, 2nd decade

CORD

macular and peripheral atrophy

increased foveal in areas of atrophy AF; reduced AF in areas of atrophy

severely reduced or undetectable

reduced cone and rod responses;* “negative ERG”

Peripherin (AD)

2nd, 3rd decade

CORD

macular RPE mottling, macular atrophy, peripheral retinal atrophy and areas of peripheral RPE hyperpigmentation

“speckled” AF

reduced responses

reduced cone and rod responses

CRX (AD)

1st decade

CORD

macular and later peripheral retinal degeneration

reduced AF in areas of atrophy, “speckled” AF in the midperipheral retina

reduced responses

reduced cone and rod responses; “negative ERG”

RIMS 1 (AD)

2nd-5th decade

CORD

ranges from mild macular RPE disturbance to atrophy and pigmentation

reduced AF at the center of the macula surrounded by a ring of increased AF

absent or severely reduced

reduced cone and rod responses, often normal 30Hz flicker implicit time

ABCA4 (AR)

1st-3rd decade

COD, CORD

macular atrophy, bull’s eye appearance, peripheral pigmentary changes in advanced disease

reduced AF at the center of the macula surrounded by a ring of increased AF; reduced AF only

absent or severely reduced

severely reduced cone responses; in CORD, additional reduction in rod responses

KCNV2 (AR)

1st, 2nd decade

COD

RPE disturbance at the macula

most commonly reduced AF at the center of the macula surrounded by a ring of increased AF

absent or severely reduced

reduced rod b-wave amplitude with low intensity stimulus; often higher than normal with high flash energies, cone responses severely reduced

RPGR (X-linked)

5th decade

COD

macular atrophy

perifoveal ring of increased AF

absent or severely reduced

reduced cone responses

RPGR (X-linked)

2nd-4th decade

CORD

range from mild macular RPE disturbance to extensive atrophy and hyperpigmentation

reduced macular AF, reduced AF surrounded by a ring of increased AF

absent or severely reduced

reduced cone and rod responses

AF, autofluorescence; ERG, full-field electroretinogram; PERG, pattern electroretinogram; RPE, retinal pigment epithelium;* , ERG is usually nonrecordable by the fourth decade of life;, attenuation of retinal blood vessels and peripheral retinal atrophy can occasionally be observed.

See text for detailed description of AF findings. In CORD, ERG reveals greater reductions in cone than in rod responses, AD, autosomal dominant, AR, autosomal recessive.

Fundus Autofluorescence
Fundus AF imaging has been used to assist in the diagnosis, to aid detailed description of the phenotype, and to provide insights into the natural history and underlying pathophysiology of COD and CORD.
COD and CORD are classified below based on their mode of inheritance and their causative genes (only those for which well-documented AF data are available will be discussed in this section). Fundus AF features will be described herein. The clinical, electrophysiological, and AF findings are summarized in Table 11B.1.
Fundus Autofluorescence Findings in Autosomal Dominant Disease
To date, seven genes have been associated with AD disease. AF data are available for COD and CORD caused by mutations in GUCA1A, GUCY2D, Peripherin/RDS, CRX, and RIMS1, as described below.
COD and CORD Associated with GUCA1A
Photophobia, reduced central vision, and generalized dyschromatopsia, with no evidence of nystagmus, are usually observed. In some subjects, RPE changes may be subtle, especially in the early stages of the disease. In these patients, AF imaging is helpful in confirming the macular abnormality by identifying localized area(s) of increased macular AF (Fig. 11B.2) (9,16). In some individuals, perifoveal rings of increased AF have been described that are similar to those observed in retinitis pigmentosa (see Chapter 11, Retinitis Pigmentosa subsection) (9); these rings are increasingly recognized as features of COD and CORD (17,18). In older subjects with macular atrophy, corresponding areas of decreased AF are seen (Fig. 11B.3).
The gene GUCA1A encodes the phototransduction protein guanylate cyclase activating protein-1 (GCAP1). Mutant GCAP1 protein activates retinal guanylate cyclase1 (RetGC1) at low Ca2+ concentrations but fails to inactivate it at high Ca2+ concentrations, thereby leading to a constant activation of RetGC1 in photoreceptors, even at the high Ca2+ concentrations of the dark-adapted state (Fig. 11B.4). The consequent dysregulation of intracellular Ca2+ and cGMP levels is believed to lead to cell death.
CORD Associated with GUCY2D
Moderate myopia is common, with photophobia and pendular nystagmus seen in affected individuals, who experience the major visual reduction in the second or third decade of life (19, 20, 21). Initially there is only absent tritan color discrimination, but this progresses to complete loss of color vision over time.
FIGURE 11B.2. AD-COD and CORD (GUCA1A). Fundus AF image showing localized increased macular AF.
FIGURE 11B.3. AD-COD and CORD (GUCA1A). Fundus AF image showing decreased macular AF.
The earliest AF abnormality is increased AF at the fovea, suggesting that this is the site of initial dysfunction (21). A markedly reduced AF signal is detected at the site of macular atrophy, indicating loss of photoreceptor cells, or at least their outer segments. In the later stages, subjects have an annulus of increased AF surrounding areas of central atrophy (see below). Increased AF at the edge of atrophy is likely to indicate an area destined to become atrophic (17,18).
Families with AD-CORD associated with single GUCY2D missense mutations have a much milder phenotype (only mild rod involvement) than subjects with complex mutations (moderate to severe rod loss) (19, 20, 21, 22, 23).

Only gold members can continue reading. Log In or Register to continue

Stay updated, free articles. Join our Telegram channel

Aug 29, 2016 | Posted by in OPHTHALMOLOGY | Comments Off on Fundus Autofluorescence in Cone and Cone-Rod Dystrophies

Full access? Get Clinical Tree

Get Clinical Tree app for offline access