The Normal Distribution of Fundus Autofluorescence
Theodore R. Smith
This chapter concentrates on the image of the normal fundus itself and its analysis. In particular, it first discusses images obtained from the most widely used and available systems, the Heidelberg Retinal Angiograph (HRA; Heidelberg Engineering, Dossenheim, Germany) and its latest model, the HRA2. These confocal scanning laser ophthalmoscopes (cSLOs) use an excitation wavelength of 488 nm and a barrier filter of 500 nm to provide fundus autofluorescence (AF) imaging in vivo (see also Chapter 5) (1,2). A discussion on the variations in such images when acquired with longer-wavelength excitation systems follows.
AF images acquired by the HRA consist of 30-degree field-of-view laser scans, 512 × 512 pixels in size, centered on the macula. The resolution of the HRA2 is 768 × 768 pixels. As explained in Chapter 5, several scans with a relatively low signal-to-noise ratio are registered and then averaged to improve the signal-to-noise ratio. The resulting image is then histogram-stretched by the HRA software to increase contrast for viewing. These details serve to remind us that the final images are not pixel-by-pixel representations of absolute AF levels, such as would be obtained by spectrophotometry; rather, they show the relative AF intensities of neighboring pixels. Further, just as in fundus photography, even the relative intensities of widely separated pixels are affected by intrinsic variability in the acquisition process. In other words, illumination may vary gradually from one portion of a photograph or AF scan to another, with a resulting effect on measured intensities that is purely photographic, not physiologic. Nonetheless, a wealth of qualitative information may be gleaned from these images, properly interpreted, as reviewed throughout this book. Furthermore, it is possible, as will be discussed in this chapter, to take these qualitative data back to quantitative interpretation by demonstrating that (i) a large portion of the variability observed in the background AF of a normal AF image has a smooth and regular structure, (ii) this structure can be mapped by an appropriate mathematical model, and (iii) this model of a normal AF image naturally provides a framework for the interpretation and quantification of AF abnormalities as variations from the normal model.
NORMAL DISTRIBUTION OF FUNDUS AUTOFLUORESCENCE
In vivo spectrophotometric recording of fundus AF was described by Delori et al. (3), who showed that AF arose predominantly from lipofuscin in the retinal pigment epithelium (RPE; see Chapter 3). Thus, the intensity of fundus AF mostly parallels the amount and distribution of lipofuscin (subject to exceptions noted further below). Lipofuscin is derived, in large part, from phagocytosis of outer segment discs containing bisretinoid by-products of light absorption (see Chapters 1 and 2). The emission of lipofuscin has a broad band ranging from 500 nm to 750 nm (3) (see Chapter 3).
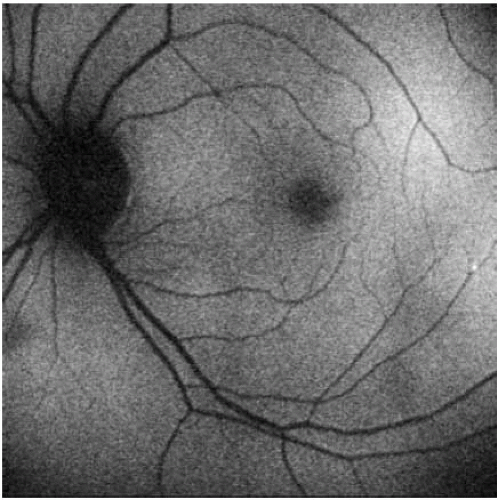 FIGURE 9.1. Normal fundus AF pattern from the HRA. The optic disc and retinal blood vessels are dark. The background pattern is mildly variable, with lighter and darker areas throughout, and with greatest intensity roughly surrounding the fovea. The central macula is particularly dark due to absorption of the blue excitation light by luteal pigments. There is a tiny “speck” of increased AF temporally, which probably represents a small druse in this normal 54-year-old woman. |
In the normal fundus AF pattern, diffuse AF is most intense between 5 and 15 degrees from the fovea. However, mild variability throughout the fundus is the rule in a normal AF image, with lighter and darker areas due at least in part to the image acquisition process, much as can be seen in a normal fundus photograph (Fig. 9.1). The optic disc and retinal blood vessels have a low (dark) autofluorescent signal, and the blood vessels mask the RPE beneath them. However, these findings are not determined by the AF of lipofuscin alone, a fact that complicates their interpretation. One of the complicating factors is the absorption of the 488 nm blue light by macular pigments, especially the carotenoids lutein and zeaxanthin (see also Chapter 3) (4,5). On fundus photographs and under visual observation, these pigments are characterized by strong yellow coloration (6). Their absorption is greatest in the center of the macula. This absorption markedly diminishes the foveal AF signal (Fig. 9.1), which would otherwise approximate the remainder of the macular background. There is also some absorption of the 488 nm light by melanin granules located in the RPE (7). Further, cone photopigments will be incompletely bleached after an approximately 15- to 30-second exposure to the HRA in AF mode (8); hence, absorption by these structures will also diminish the AF signal centrally. On the other hand, an advantage of the HRA system is that the AF that is recorded is dominated by lipofuscin. In particular, AF from melanin, which can be recorded in the near infrared (IR) (9) (see Chapter 6), does not affect the HRA signal.
Stay updated, free articles. Join our Telegram channel

Full access? Get Clinical Tree


