Lipofuscin: The Origin of the Autofluorescence Signal
François Delori
The retinal pigment epithelium (RPE) digests the tips of the outer segment of the photoreceptors, which are phagocytosed on a daily basis. The digestion process of these materials, which contain polysaturated fatty acids and byproducts of the visual cycle, is overall very efficient, but a tiny fraction is chemically incompatible for degradation and accumulates in lysosomes of the RPE. This undigested fraction is called lipofuscin (LF). Above the age of 70, as much as 20% to 33% of the free cytoplasmic space of the RPE cell may be occupied by LF granules and melanolipofuscin granules, a compound product of LF and melanin (1).
LF is a pigment that exhibits a characteristic autofluorescence (AF) when excited in ultraviolet (UV) or blue light. Fluorescence microscopy of the RPE using UV or blue excitation light reveals distinctly bright orange-red or golden-yellow granules. This fluorescence also makes it possible to visualize and measure LF noninvasively, since the absorption spectrum of LF is monotonic (2) without any distinct spectral signature, and it would be very challenging to measure it by fundus reflectometry.
SPECTROFLUOROMETRY AND IMAGING OF FUNDUS AUTOFLUORESCENCE
Fundus AF was initially demonstrated in vivo by vitreous fluorophotometry, which revealed in preinjection scans a distinct “retinal” peak whose magnitude increased with age, as would be expected from LF fluorescence (3,4). These observations led to the development of a fundus spectrofluorometer (5,6) designed to measure the excitation and emission spectra of the AF from small retinal areas (2 degrees diameter) of the fundus and to allow absolute measurements of the fluorescence. The device incorporated an image-intensifier-diode-array as detector, beam separation in the pupil, and confocal detection to minimize the contribution of AF from the crystalline lens. This device was used initially to demonstrate that fundus AF essentially exhibits the characteristics of RPE LF (7).
Fundus AF is about 2 orders of magnitude less intense than the background fluorescence of a sodium fluorescein angiogram at the brightest part of the dye transit. As a result, AF imaging systems with high sensitivity and/or image averaging capabilities (8) are required to record the fundus AF with acceptable signal/noise ratios and safe retinal exposures. Confocal scanning laser ophthalmoscopy (SLO) (9) optimally addressed these requirements, and the first clinical AF imaging system was introduced at Moorfields in London with an excitation wavelength of 488 nm (10,11). Subsequent developments using confocal SLO systems, nonconfocal cameras, and different excitation wavelengths have further broadened the field of AF imaging (12, 13, 14, 15, 16).
RETINAL DISTRIBUTION OF AUTOFLUORESCENCE
AF images of the fundus show a central dark area caused by the light absorption by both RPE melanin and macular pigment that strongly absorbs wavelengths shorter than 540 nm (17). The AF signal is believed to originate posterior to the photoreceptors because it is affected by absorption by the visual pigments when the latter are not fully bleached. Indeed, the parafoveal difference spectrum, log (dark-adapted AF) — log (light-adapted AF), clearly reveals the spectrum of rhodopsin (7,18). Similarly, the AF is believed to originate anterior to the choriocapillaris because its emission spectrum does not reveal absorption bands of oxyhemoglobin (in contrast, the reflectance spectrum of the fundus shows these absorption bands at 540 and 575 nm) (19). These observations are consistent with the notion that the bulk of the AF emanates from the RPE. Clinical interpretations of AF images reinforce this conclusion. The AF emission spectrum in a full-thickness macular hole is similar in magnitude and shape to that measured at about 7 degrees eccentricity because the neurosensory retinal tissues are absent in the hole and the RPE is roughly intact (7,10). Conversely, RPE atrophy causes the AF emission spectrum from geographic atrophy in age-related macular degeneration (AMD) to be significantly reduced and distorted (20).
SPECTRAL PROPERTIES OF FUNDUS AUTOFLUORESCENCE
The emission spectra of fundus AF are broad (Fig. 3.1) and maximal in the 600-640 nm region of the spectrum, shifting slightly toward longer wavelengths with increasing excitation wavelength (21). This “red shift” occurs for excitations at the long wavelength end of the absorption spectrum for some fluorophores in viscous or polar environments (22). The red shift in large part explains the variability of emission spectra maxima reported in the literature; with excitation wavelengths ranging from 364 nm (lamp used in microscopy) to 580 nm (16), the emission peak will vary between 590 and 660 nm.
The excitation spectra have maxima between 490 and 530 nm. In contrast to the spectra measured 7 degrees temporal to the fovea, the foveal spectra are attenuated and distorted. This is due in part to the lower amount of LF in the foveal area (23), and to the absorption of the excitation light by macular pigment. The difference spectrum, log(foveal AF) — log(parafoveal AF), has the shape of the absorption spectrum of macular pigment (Fig. 3.1, inset), and this serves as the basis for the two-wavelength AF method to measure macular pigment (24). Note that the difference spectrum still decreases with increasing wavelength at 550-570 nm (arrow), where macular pigment does not absorb substantially. This is because of the absorption by RPE melanin, which decreases with wavelength and is larger at the fovea than at the parafovea (RPE melanin is located on the apical side of the RPE cell) (23,25).
INFLUENCE OF CRYSTALLINE LENS ABSORPTION
Excitation and emission spectra of fundus AF are affected by absorption and scattering in the lens and the other ocular media. For example, an excitation at 488 nm is attenuated, on average, by factors of 2.2 and 3.3 for ages 20 and 70 years, respectively (26). The AF emission is also attenuated, but to a lesser extent, because it occurs at longer
wavelengths (factors of 1.4 and 1.5, respectively, when averaged over emissions from 500 to 700 nm). If absolute AF levels are needed, then corrections to account for the excitation and emission losses are required. These losses can be estimated for each subject by psychophysical (27) or reflectometric (28,29) methods. Alternatively, algorithms that predict the average light loss at a given wavelength and age can be used in population studies (26,30). Corrections obtained with such algorithms (26) result in a marked increase in AF. The corrected excitation spectrum is shifted toward shorter wavelengths (where lens absorption is highest), but the shape of the emission spectrum does not change substantially (Fig. 3.2, top, spectra A and B).
wavelengths (factors of 1.4 and 1.5, respectively, when averaged over emissions from 500 to 700 nm). If absolute AF levels are needed, then corrections to account for the excitation and emission losses are required. These losses can be estimated for each subject by psychophysical (27) or reflectometric (28,29) methods. Alternatively, algorithms that predict the average light loss at a given wavelength and age can be used in population studies (26,30). Corrections obtained with such algorithms (26) result in a marked increase in AF. The corrected excitation spectrum is shifted toward shorter wavelengths (where lens absorption is highest), but the shape of the emission spectrum does not change substantially (Fig. 3.2, top, spectra A and B).
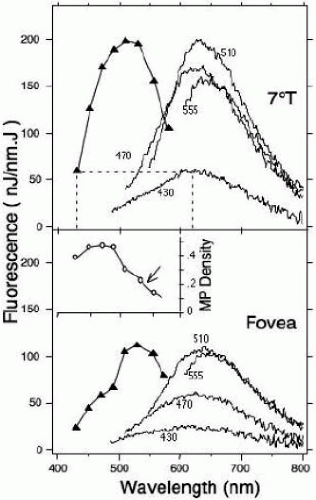 FIGURE 3.1. Fluorescence spectra measured in a 52-year-old normal subject at 7 degrees temporal to the fovea (7 degrees T) and at the fovea (sampling area: 2 degrees in diameter) (21). Continuous lines: emission spectra (excitation wavelength as indicated); line with filled triangle: excitation spectrum for emission at 620 nm. The excitation spectrum is not measured, but is constructed from the fluorescence at 620 nm and plotted against the excitation wavelength (dotted line). The foveal spectra are lower than at 7 degrees temporal, particularly for excitation wavelengths shorter than 490 nm, where absorption of the excitation light by macular pigment is revealed. Inset. Difference spectrum, [log(foveal AF) — log(parafoveal AF)], converted to macular pigment density using the absorption coefficients of the macular pigment. |
AGE AND FUNDUS AUTOFLUORESCENCE
Fundus AF has been shown to increase significantly with age (4,7,11,21,31), confirming data obtained in ex vivo studies (32,33). The rate and time course of this increase varies among different studies, probably as a result of differences in population selection, techniques, correction method for media absorption, and other factors (31). The increase of fundus AF with age for a population of normal subjects (Fig. 3.3) shows a large but constant variability (the coefficient of variation per decade of age is about 25% and 28%). Foveal AF increases similarly with age; however, the ratio of the AF at the fovea to that at 7 degrees temporal to the fovea does not vary with age.
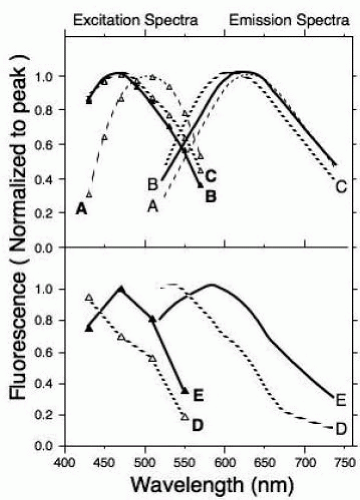 FIGURE 3.2. Normalized LF excitation spectra measured at 620 nm (boldface letters) and emission spectra for 470 nm excitation (lightface letters). The pairs of spectra are: (A) spectra from the 52-year-old subject of Fig. 3.1 (7 degrees T) not corrected for ocular media absorption; (B) the same as A but corrected for media absorption (the AF at 620 nm was 4.2 times larger than for A); (C) ex vivo spectra measured in the RPE of a donor eye (age: 83 years); (D) spectra measured on a large druse in a 70-year-old ARM patient; and (E) spectra measured in the same patient in an area devoid of visible drusen. Spectra B, D, and E were corrected for media absorption using the algorithm of van de Kraats and van Norren (26).
Stay updated, free articles. Join our Telegram channel
Full access? Get Clinical Tree
 Get Clinical Tree app for offline access

|