Lipofuscin and Autofluorescence in Experimental Animal Models
Heping Xu
Fundus autofluorescence (AF) imaging is increasingly being used in ophthalmic practice to aid in the diagnosis and monitoring of patients with a variety of retinal disorders. Thus, it is particularly important to understand the molecular and cellular sources of fundus AF. Only with such an understanding can doctors interpret and judge the significance of fundus AF changes in various pathological conditions. However, it is very difficult to obtain such information from human studies; in this context experimental animal studies may have great additional value. Improvements in in vivo fundus AF imaging techniques and the development of various animal models of disease enable us to carry out direct clinicopathological correlations as well as dissect the detailed mechanisms of lipofuscin formation.
THE VALUE OF EXPERIMENTAL ANIMAL MODELS
Experimental animal studies are valuable because they allow us to investigate the clinicopathological correlations of fundus AF and the pathological changes related to various AF patterns. Such information is critical for clinicians to correctly interpret AF images. Although a variety of animal models representing different types of human retinal diseases have been developed over the years, only a few AF clinicopathological studies have been published (1,2), including a study from the author’s laboratory in normal aged mice. Another important use of experimental animal studies is to investigate the mechanisms of lipofuscin formation. Studies in this field have identified a few important factors involved in in vivo lipofuscin formation, including the RPE65 gene and vitamin A. In addition, animal studies are of great value for testing the effectiveness of various treatments, particularly those targeting the formation of lipofuscin.
IMAGING TECHNIQUES
In Vivo Imaging
Currently, confocal scanning laser ophthalmoscopy (cSLO) is the most widely used technique to image fundus AF in vivo. Because all commercial cSLOs are designed to image the human fundus, slight modifications, such as the use of special lenses, are needed to image rat or mouse retina. Various groups have used this system to image the rodent fundus. In the author’s laboratory, a custom-built cSLO is used in experimental animal studies. To be able to image the mouse fundus, we use a +25D lens placed 1 cm in front of the mouse cornea to further focus the laser beam. In addition, a mouse hard contact lens is also used to prevent tear evaporation and keep the eyelids open. We are able to image a 43 × 32 degrees field of the mouse fundus (3). This
in vivo imaging technique is noninvasive, and therefore changes in the fundus can be followed up at different stages of disease in the same animal.
in vivo imaging technique is noninvasive, and therefore changes in the fundus can be followed up at different stages of disease in the same animal.
Ex Vivo Imaging
As with human samples, lipofuscin in animal tissues can be extracted and examined in vitro by various techniques. Traditionally, tissue AF has been imaged in situ with the use of various fluorescence microscopes (4,5). Fluorescence microscopy is still a simple, straightforward, and useful technique to detect lipofuscin. Currently, however, more advanced and sophisticated technologies are used to quantify lipofuscin content and examine the detailed fluorescence emission spectra of lipofuscin. Bui and colleagues (6) used a fluorescence microplate reader (Tecan Safire II Fluorescence Microplate Reader, Tecan US, Research Triangle Park, NC) to examine the fluorescence emission spectra of RPE-choroid and retina explants. In their system, fresh samples were placed side up in a modified 384-well microplate. Emission spectra were measured following excitation at 420 nm using the top read mode (6). This technique allows one to measure the emission spectra as well as the relative fluorescent units of RPE-choroid and retina explants. In the author’s laboratory, the lambda mode of a confocal scanning laser microscope (LSM510 META, Carl Zeiss) is used to image fluorescence emission spectra of mouse RPE-choroid and retina explants (1). This technique has several advantages: (i) samples can be excited with different lasers and the characteristics of the emission spectra excited by the different lasers can be studied; (ii) it detects the emission spectra of individual cells or regions but not the whole tissue, allowing comparisons of the emission spectra of different cells or different regions; and (iii) the fluorescent intensity of different tissues or different regions can be quantitatively recorded and analyzed. The lambda mode of the LSM510 META confocal microscope is designed to separate the fluorochromes with widely overlapping emission spectra or fluorochromes that are excited by the same laser. It is widely used to eliminate sample background AF. With the META scanning system, the emission fingerprints of each fluorochrome can be collected and a spectral database can be built (Fig. 4.1). It is therefore an ideal means of studying the fluorescence spectra
of lipofuscin. With the META scanning mode, emission signals are detected by a polychromatic 32-channel detector, which allows the fast acquisition of lambda stacks. Samples can be excited with lasers at 448 nm, 477 nm, 488 nm, 514 nm, 543 nm, and 633 nm separately. For each excitation, the emission spectral range for lambda stack acquisition can be controlled as required, and the upper limit is 790 nm. For all lambda acquisitions, the pinhole needs to be set to 1 airy unit and the scanning speed set to 6. To be able to compare the emission fingerprints acquired from different cells/tissues, the configuration, including the detector gain, amplifier offset, and amplifier gain, should not be changed during the process of acquisition. An example of mouse RPE lipofuscin emission spectra excited by 458 nm is shown in Figure 4.1.
of lipofuscin. With the META scanning mode, emission signals are detected by a polychromatic 32-channel detector, which allows the fast acquisition of lambda stacks. Samples can be excited with lasers at 448 nm, 477 nm, 488 nm, 514 nm, 543 nm, and 633 nm separately. For each excitation, the emission spectral range for lambda stack acquisition can be controlled as required, and the upper limit is 790 nm. For all lambda acquisitions, the pinhole needs to be set to 1 airy unit and the scanning speed set to 6. To be able to compare the emission fingerprints acquired from different cells/tissues, the configuration, including the detector gain, amplifier offset, and amplifier gain, should not be changed during the process of acquisition. An example of mouse RPE lipofuscin emission spectra excited by 458 nm is shown in Figure 4.1.
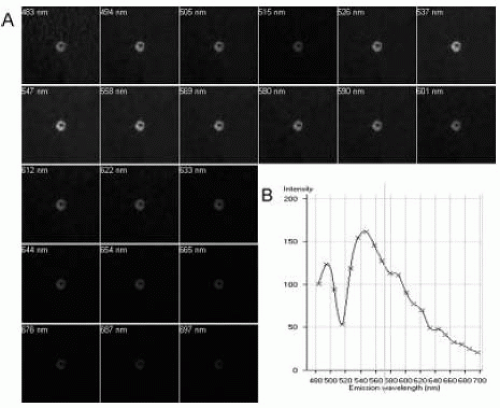 FIGURE 4.1. AF emission spectra of a mouse RPE cell. The RPE flatmount was prepared from a 2-year-old C57BL/6 mouse and examined with the use of a LSM510 META confocal microscope (lambda model). The sample was excited with a 458 nm HeNe laser and the emission signals were collected from 460 to 697 nm. (A) Emission spectra database of the RPE cell. (B) AF intensity at different emission wavelengths extracted from the database in A. |
CLINICOPATHOLOGICAL CORRELATION OF FUNDUS AUTOFLUORESCENCE IN EXPERIMENTAL ANIMALS
Although various pathological studies in retinal/RPE lipofuscin have been carried out in postmortem human eyes over the past decade, direct clinicopathological correlation is lacking. To date, the clinicopathological correlation of fundus AF findings in the majority of retinal diseases is still largely unknown.
Fundus AF in Normal Mouse
To be able to understand fundus AF changes in various animal models of diseases of the posterior segment, the characteristics of fundus AF in healthy control animals need to be established. We have investigated the fundus AF in normal C57BL/6 mice of different ages. The overall fundus AF increased with age in normal C57BL/6 mice by cSLO (1). Increasingly strong AF signals were observed with age in the neuroretina and subretinal/RPE layer (Fig. 4.2A). Unlike fundus AF detected in normal human subjects, fundus AF appeared as discrete foci distributed throughout the retina (Fig. 4.2A). Most of the AF signals in the neuroretina were distributed around retinal vessels (1). Immunohistological studies of retinal or RPE-choroidal flatmounts indicated that most of the AF signals derived from Iba-1+ perivascular and subretinal microglia (Fig. 4.2B,C), and some derived from RPE cells (Fig. 4.3) (1).
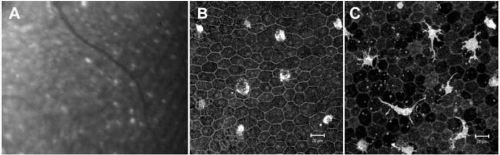 FIGURE 4.2. Fundus AF in a normal aged mouse. (A) Fundus AF in an 18-month-old C57BL/6 mouse. (B) Confocal microscopy of RPE flatmount of the same mouse reveals many autofluorescent cells located on the surface of the RPE cells. (C) The autofluorescent cells on the RPE cell surface stained positive for the microglia marker Iba-1. |
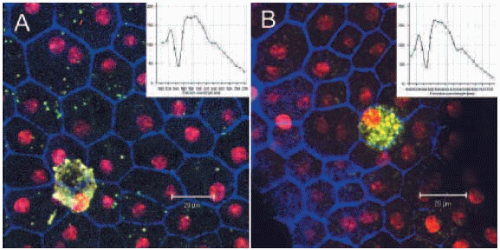 FIGURE 4.3. Lipofuscin in subretinal microglia and RPE cells. (A) Subretinal microglia with lipofuscin. Inset: Emission spectra of subretinal microglial lipofuscin excited with 488 nm. (B) RPE cell with lipofuscin. Inset: Emission spectra of RPE cell lipofuscin excited with 488 nm. |
The number of subretinal microglia and the amount of intracellular lipofuscin increased with age (1). Transmission electron microscopy (TEM) revealed many lipufuscin granules in the cytoplasm of subretinal microglia (1). Emission spectra detected by the META scanning mode of the confocal microscope indicated that the spectra of the lipofuscin in subretinal microglia and the RPE cells were the same (Fig. 4.3), suggesting that they may have the same chemical components.
Stay updated, free articles. Join our Telegram channel

Full access? Get Clinical Tree


