Fundus Autofluorescence Imaging in Age-Related Macular Degeneration
Monica Rodriguez Fontal
Craig M. Greven
D. Virgil Alfaro III
Eric P. Jablon
INTRODUCTION
More than 9 million Americans and 60 million individuals worldwide exhibit some form of age-related macular degeneration (AMD). Most of these patients are affected by the early changes of the disease. Close to 20% of AMD patients will progress to a more severe and blinding form of the disease: geographic atrophy (GA) and neovascular AMD.
GA is the advanced form of dry AMD. It accounts for up to one-third of the cases of late AMD and is responsible for 20% of cases of severe visual loss due to the disease. The traditional method for documenting and quantifying GA is with color fundus photographs. However, it can be difficult to distinguish between absence of retinal pigment epithelium (RPE) or real GA and the presence of depigmented normal-function RPE. In addition, the predictive sensitivity of color photos is poor and is capable of identifying only 5% to 7% of eyes that progress to late stages of AMD.
Autofluorescence is an intrinsic property of certain materials that is characterized by the transient emission of light when the substance is illuminated by an exogenous source. Many tissues and structures in the eye, such as the RPE, are composed of biologic molecules that have autofluorescent properties. Fundus autofluorescence (FAF) is an imaging technology that measures the autofluorescence properties of the retina. FAF is a new tool that seems promising in measuring and predicting GA. GA currently lacks effective treatment, but there has been a renewed interest in this condition as suggested by the exponential growth in the number of therapies under investigation that have emerged in recent years. By evaluating risk for disease progression, FAF imaging could help differentiate eyes that progress slowly from those that progress rapidly, and thus enable smaller clinical trials with shorter duration and enhanced power.
RETINAL PIGMENT EPITHELIUM AND LIPOFUSCIN
The RPE is a monolayer of hexagonal cells between the neurosensory retina and the vascular choroid. The RPE has multiple functions: It is responsible for the transport of metabolic wastes from the retina into the choroid, it is part of the photoreceptor renewal, and it is in charge of absorbing light (through melanin within the RPE cells) that has not been captured by photoreceptors conferring protection to the retina from photo-oxidative stress. Given the multiple functions of the RPE, it is not surprising that its dysfunction has been implicated in a variety of blinding retinal disorders (1,2).
Photoreceptor renewal is one of RPE’s most important roles. RPE is in charge of phagocytosis of the oldest disks at the distal end of the outer segments; meanwhile, new outer segment disks are continually added proximal to the base. As a result of this process of membrane renewal (the entire photoreceptor outer segment is turned over every 10-14 days), lipofuscin granules are deposited in the cytoplasm of the RPE cells (3). Accumulation of lipofuscin is a hallmark of aging in metabolically active postmitotic RPE cells.
Ultrastructural analysis of RPE cells reveals the presence of inclusions that have morphologic features of both phagocytized outer segments and lipofuscin granules (4). Delori et al. (5,6) demonstrated with spectrophotometric investigations that lipofuscin granules in the RPE contain the main fluorophores responsible for FAF.
The lysosomal bodies in which RPE lipofuscin is housed have revealed amino acid content and bisretinoid compounds (7,8,9). The bisretinoid compounds (A2E is one of the most prominent ones) are the fluorescent constituents of the RPE’s lipofuscin. They are formed in the membranes of photoreceptor outer segments before the segments are phagocytized by the RPE. The formation of these bisretinoid fluorophores is light dependent. Bisretinoid compounds are formed in the photoreceptor from random inadvertent reactions of vitamin A aldehyde.
The autofluorescent properties of lipofuscin’s compounds allow visualization of lipofuscin accumulation in the RPE cell. Lipofuscin has a broad-range excitation; it goes from 300 to 600 nm, so visible light can be used to elicit its fluorescence in vivo. The emission spectrum is broad (480-800 nm) and maximal in the 600- to 640-nm region of the spectrum, shifting slightly toward deep red with increasing excitation wavelength. The excitation used for imaging with a confocal scanning laser ophthalmoscope (cSLO) is typically 488 nm; for imaging by fundus camera, 535 to 580 nm; and for spectrofluorometry, 550 nm (6,10). The fluorescence emission of FAF is broad and centered at approximately 610 nm.
FUNDUS AUTOFLUORESCENCE IMAGING
FAF imaging is a photographic technique that measures emitted fluorescent light from the retina after excitation with 488- to 580-nm light. Several devices can be used to capture the emitted fluorescent light: fundus camera with special filters, fundus spectrophotometer, or cSLO.
The fundus spectrophotometer, developed by Delori in 1994, was designed to measure the excitation and emission spectra of the autofluorescence from small retinal areas of the fundus. The spectrophotometer incorporates an imageintensifier diode array as a detector and beam separation in the pupil to minimize the contribution of autofluorescence from the lens; this device allowed absolute measurements of FAF (Fig. 12.1).
A fundus camera with a bandpass filter from 535 to 580 nm for excitation and a bandpass filter from 615 to 715 nm as a barrier can be used to capture FAF. This camera uses a single flash to get an image of the entire retina at the same time (Fig. 12.2). The detected fluorescence signal derives from all tissue levels, in the light beam, with fluorescent properties. The filters allow long wavelengths to pass and filter short wavelengths. Filtering short wavelength reduces interference from fluorophores in the lens (which mainly emit in the range between 510 and 670 nm) especially in presence of nuclear sclerosis.
Confocal scanning laser ophthalmoscopy, originally developed by Webb et al. (11), has a focused low-power laser beam that sweeps across the fundus in a raster pattern and then captures the reflected light through a small aperture (a confocal pinhole). The confocal pinhole suppresses light reflected or scattered from outside of the focal plane (Fig. 12.3). Light originating in the light beam, but out of the focal plane, is suppressed, reducing the autofluorescence from sources anterior to the retina (12). In contrast to the small field of the fundus spectrophotometer, cSLO allows imaging FAF over larger retinal areas and achieves high-contrast images of the posterior segment.
Three different cSLOs have been used for obtaining FAF images: the Heidelberg Retina Angiograph (HRA), the Rodenstock cSLO (RcSLO, Rodenstock, Weco, Düsseldorf, Germany), and the Zeiss prototype SM 30 4024 (ZcSLO, Zeiss, Oberkochen, Germany). The three cameras use an excitation wavelength of 488 nm. Emitted light is detected above 500 nm for the HRA, above 515 nm for the RcSLO, and above 521 nm for the ZcSLO (barrier filter). Bellmann et al. compared the three cameras taking in account image contrast, image brightness, and background noise. Their study showed that both image contrast and image brightness were significantly higher with the Zeiss prototype and the HRA than the RcSLO. Using a model eye to measure the background noise, they found that the highest background noise was measured with the ZcSLO and lowest with the HRA classic (13).
The Heidelberg Retinal Angiograph (the HRA classic, HRA 2, and Spectralis HRA; Heidelberg Engineering, Heidelberg, Germany HRA) is the currently commercially available cSLO equipped with excitation 488-nm solid-state laser and Heidelberg image analysis software (Fig. 12.4). The HRA can register and average multiple FAF images (typically from 9 to 15 single images) in order to amplify the FAF signal. With the signal amplification, the background noise is reduced and the image contrast is enhanced.
The differing wavelengths used by cSLO and fundus camera systems suggest that each system may record fluorescence from a different complement of fluorophores. To compare two FAF images from different cameras, it is useful to identify pathognomonic fundus changes undetectable by only either FAF equipment (14). An example of this situation is the difference in the hypoautofluorescence
of macula with no pathology; normal macula with cSLO appears darker than with the fundus camera.
of macula with no pathology; normal macula with cSLO appears darker than with the fundus camera.
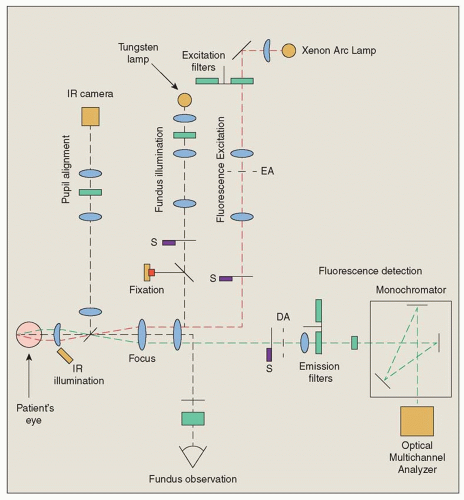 Figure 12.1 ▪ Optical diagram of the fundus spectrophotometer. EA, confocal excitation; DA, detection apertures; S, shutters; IR, infrared. |
FUNDUS AUTOFLUORESCENCE IN RETINAL DISEASES
The FAF image shows the spatial distribution of the intensity of the signal for each pixel in gray values. These are arbitrary values from 0 to 255. Low pixel values (dark or hypoautofluorescence) shows low intensities. High pixel values (bright or hyperautofluorescence) shows high intensities.
Normal Fundus
The topographical distribution of an FAF in normal retina shows a consistent pattern (12). Retinal vessels are associated with a reduced FAF signal because of the absorption of the signal by blood. The optic nerve head appears hypoautofluorescent due to the absence of the RPE (no lipofuscin).
The posterior pole shows a diffused autofluorescence signal. In the macula area, the FAF signal shows high degree of interindividual variability; in general, the signal is reduced at the fovea due to absorption of the signal by the luteal pigment. The signal in the parafoveal area is higher than in the fovea but still exhibits a relatively decreased intensity compared with the background signal. It has been speculated that this observation is caused by increased melanin deposition and lower density of lipofuscin granules in central RPE cells (5).
Abnormal autofluorescence signals can be derived either from a change in the amount or composition of lipofuscin in the RPE cell or from the presence of absorbing material (blood, lens opacity) anterior to the RPE. The identification of abnormalities in the FAF image is dependent on the quality of the recorded image (Fig. 12.5). Vitreous opacities, cataract or lens changes, and cornea abnormalities may
affect the autofluorescence signal at the level of the RPE (Table 12.1).
affect the autofluorescence signal at the level of the RPE (Table 12.1).
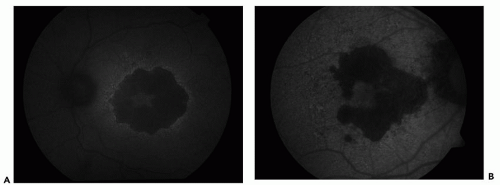 Figure 12.2 ▪ Fundus autofluorescence image with fundus camera and filters. A. Topcom camera. B. Zeiss camera. |
There are qualitative descriptions of localized FAF changes that are widely used. The FAF signal over a certain retinal location is categorized as decreased (hypoautofluorescence), normal, or increased intensities (hyperautofluorescence) in comparison to the background signal of the same image (Fig. 12.6).
Fundus Autofluorescence Image for Dry Age-Related Macular Degeneration
Early Manifestation of Age-Related Macular Degeneration
Early manifestations of AMD include focal hypopigmentation and hyperpigmentation at the RPE level and drusen with extracellular material accumulating in the inner aspects of the Bruch’s membrane. Postmortem analyses demonstrate that some molecular species in drusen material possess autofluorescent properties.
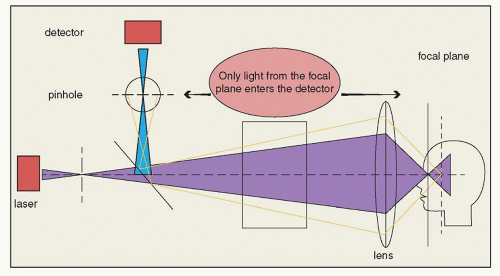 Figure 12.3 ▪ Confocal scanning laser ophthalmoscopy. The confocal pinhole suppresses light reflected or scattered from outside of the focal plane. |
The FAF image for early changes in AMD has been described by several investigators using both cSLO device and fundus camera-based systems. Drusen visible by fundus photography are not necessarily correlated with notable FAF changes; areas of hyperautofluorescence may or may not correspond with areas of hyperpigmentation or drusen (Fig. 12.7). In general, larger drusen are associated with more pronounced FAF abnormalities than smaller ones (15); there are two exceptions for this observation: the basal laminar drusen, which have a prominent appearance, and the crystalline drusen, which have a decreased FAF signal.
FAF (especially with fundus camera-based system) may show a pattern of ring distribution associated with drusen.
This pattern consists of hypoautofluorescence in the center of the drusen surrounded by an annulus of hyperautofluorescence (16


This pattern consists of hypoautofluorescence in the center of the drusen surrounded by an annulus of hyperautofluorescence (16
Stay updated, free articles. Join our Telegram channel
Full access? Get Clinical Tree
