Functional Neuroanatomy of the Retina
Robert E. Marc
Prologue
In the eight years since Dr. Paul Witkovsky reviewed retinal anatomy and function for this series, a sea change has occurred. We have progressively uncovered detailed molecular architectures for many structures and processes. We have concretely linked circuitry and retinal disease. There is now an overwhelming amount of literature to be screened. A PubMed search on the topic of “retina AND neuron” over 2,001 to 2,008 retrieves more than 10,000 papers. If you started today and read all day, every day without fail, it would take two to three years to catch up to 2008, and then you would still be three years behind an exponentially growing field. After severe winnowing, the reference list has grown to over 250 papers, yet it is certain that I have neglected key publications. I apologize to those authors in advance. What justifies this expansion? First, we have now assembled a nearly complete catalogue of cells in the retina (perhaps 90%) and have learned a tremendous amount about neuronal phenotypes and connections. We simultaneously know more and, paradoxically, understand less about primate color-coding mechanisms. New retinal cell types have been discovered and refined models of synaptic signaling have emerged. Our understanding of the molecular mechanisms of synaptic function, of neurotransmitter receptor molecular biology, of modulatory mechanisms, and gap junctions has exploded. Further, we now have strong evidence of postnatal and disease-induced neuroplasticity in the mature retina. Some problems persist. We still do not know how horizontal cells (HCs) work; how red/green color coding happens; why we need so many kinds of bipolar cells (BCs) and amacrine cells (ACs); how the retina develops (though great advances have been made); what retinal efferents do; nor the exact details of any ganglion cell (GC) micronetwork. The study of retinal structure remains a dynamic, challenging enterprise.
Introduction
The vertebrate retina encodes visual scenes in starlight and at the solar zenith, discriminates spectral reflectances, detects motion, outlines form, and even mediates non–imaging-forming light encoding in some species. Most vertebrate retinas are duplex, using rod photoreceptors for nocturnal scotopic vision and cones for diurnal photopic vision. Our focus will be the mammalian retina in general and the primate retina in particular. While the mammalian retina is complex, it is a reduced and rederived vertebrate retina with less neuronal diversity and sensory bandwidth than those of avians, reptiles, amphibians, and fishes. The evolutionary mechanisms underlying this reduction are beyond the scope of this chapter, but every mammalian attribute ought to be viewed in the light of this evolutionary transformation.
Functional neuroanatomy addresses not only the neuronal architecture of signal processing, but also the synaptic connectivity, network topology, and signaling biophysics of retinal networks. The retina has been the focus of intense investigation since the earliest days of neuroanatomical research. The great Spanish neuroanatomist Santiago Ramón y Cajal, who shared the 1906 Nobel Prize for Medicine with Camillo Golgi (and whose methods he used), set forth reasons for the attractiveness of the retina as an experimental tissue in the introduction to his classic study:1 the basic flow of information from photoreceptors toward ganglion cells was largely understood; the retinal neurons were arrayed in well-defined cellular layers; their contacts with other neurons were separated into clear zones (the inner and outer plexiform layers); and the compact nature of a cell’s dendritic and axonal arbors facilitated study of its nervous connections. Ramón y Cajal considered the retina to be a true nervous center, but one whose thinness and transparency made it ideal for histologic analysis.
We still find this framework essential, but there is much molecular and structural information to add. In addition to new imaging and electrophysiological tools, we add increasingly detailed descriptions of molecular networks that participate in retinal signaling, growth, normal and pathologic function, and cell death. One important and clinically potent finding is that the nervous system, including the retina, is highly plastic. In addition to the basic “hard-wiring” of the system, parallel arrays of neuromodulators2,3 such as peptides, amines, metabolites, and even free gases modify the properties of circuits. Neuromodulation is predominantly linked through transmembrane signaling systems, usually G-protein coupled receptors (GPCRs) whose transduction networks converge on a variety of intracellular proteins (e.g., kinases), which exert subtle control over target receptors and channels. In most cases neuromodulators reach their targets by diffusion from distant sources.4 Of high clinical import for translational work is the discovery that the retina is plastic under pathologic conditions, displaying structural remodeling, physical rewiring, and molecular reprogramming, requiring a new neuroscience-based understanding of these diseases. Neural circuitry is no longer simply the playground of the cognoscenti but a fundamental part of medical praxis.
Ramón y Cajal1 and Stephen Polyak5 catalogued the fundamental shapes and laminar locations of a given cell’s dendritic and axonal arborizations. To this we now add the display of electrical and chemical synapses among neurons, neurotransmitter and receptor expression patterns, new mechanisms of signal integration, plasticity/adaptation, and developmental history. This chapter reviews many of these topics and (i) considers persistent problems; (ii) addresses revisions in our thinking about specific networks; and (iii) summarizes the implications of plasticity for retinal disease.
General Organization of the Retina
The retina is a heterocellular (Fig. 20.1A,B) collection of interacting cellular systems and is assembled from three developmentally distinct neuron-like groups (Table 20.1). Superclass 1, the sensory neuron phenotype, is a superset of rod and cone photoreceptors and BCs, all characterized by polarized epithelial forms with apical ciliary-dendritic and basal axonal-exocytotic poles.6. These cells uniquely use high fusion-rate synaptic ribbons as their output elements. Superclass 2, the multipolar neuron phenotype,7 is a superset of ACs, axonal cells (AxCs), and GCs characterized by numerous branching neurites (often separable into dendrites and classical axons), and classical central nervous system (CNS) Gray type I and II synapses. Superclass 3 contains the gliaform cell phenotype7 and the superclass of HCs. Though they are multipolar and may display axons, they do not spike and also express many otherwise uniquely glial attributes. A complete vertebrate retina also requires two traditional classes of glial cells radial Müller’s cells (MCs) and astrocytes (AsCs). Mammalian retinas are also unique in expressing retinal vascularization (see Fig. 20.1C). This requires the migration of vascular endothelial phenotypes and pericytes into a permissive retina and the molecular mechanisms of this process remain unknown. Finally, vertebrate retinas contain populations of surveillant microglia.8,9
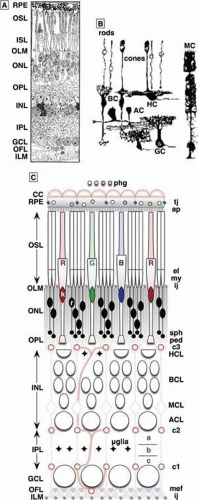 Figure 20.1. General organization of the mammalian retina. (A) A classical hand drawing of a vertical section through the retina showing the arrangement of the nuclei of retinal cells into discrete layers. (B) Representative Golgi-impregnations of representatives of the major classes of retinal neurons and the principal glial cell, the Müller cell, taken from Ramón y Cajal’s1 drawings of mammalian retinas. (C) A detailed schematic of the relations among photoreceptors, neuronal layers, and the non-neural elements of the retina viewed as a neurovascular unit. Abbreviations: RPE: retinal pigmented epithelium, OSL/ISL: outer/inner segment layer, OLM/ILM: outer/inner limiting membrane, ONL/INL: outer/inner nuclear layer, OPL/IPL: outer/inner plexiform layer, k: cone nucleus, r: rod nucleus, R/G/B: LWS:red/LWS:green/SWS1:blue cones, tj/ij: tight/intermediate junctions, AC: amacrine cell, BC: bipolar cell, GC: ganglion cell, HC: horizontal cell, MC: Müller cell, HCL/BCL/MCL/ACL/GCL: HC/BC/MC/AC/GC layer, a/b/c: sublaminas a/b/c, c1/c2/c3 capillary arcades of the GC/AC/HC layers, OFL optic fiber layer, ap apical processes, el ellipsoid, mef Müller cell end feet, my myoid, ped pedicles, phg phagosomes, sph spherules. © Robert E. Marc, 2008. |
Table 20.1. Classification of Retinal Neurons | |
|---|---|
|
Like other complex CNS assemblies, neuronal populations of the retina are segregated into distinct layers of cell somas (nuclear layers) with interposed layers of synaptic connections (plexiform layers). The outer nuclear layer contains the nuclei of rod and cone photoreceptors embedded in a meshwork of distal MC processes, and constitutes the nuclear zone of the image-forming sensory retina. The inner nuclear layer is the distal part of the true neural retina and contains four cell groups layered in distal-to-proximal order: HCs, BCs, MCs, and ACs (see Fig. 20.1C). The GC layer contains the somas of the CGs, the true projection neurons of the retina, which decode BC signals and recode them as spike trains. These packets of coded information are distributed by GC axonal projections to thalamus and midbrain. Interposed between the ONL and INL is a thin outer plexiform layer containing the synaptic output of photoreceptors and the dendrites of BCs and HCs. Interposed between the inner nuclear and ganglion cell layers is a thick inner plexiform layer containing the axonal outflow of BCs, the dendrites of GCs, and the dendrites and synaptic output of diverse classes ACs and AxCs. Together, these elements form the basic set of components for vision (Fig. 20.2).
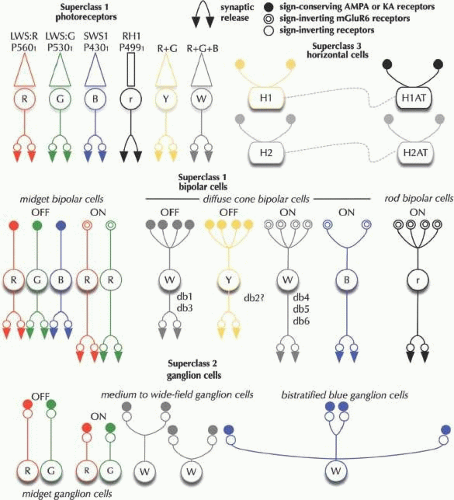 Figure 20.2. Iconic circuit summary of key primate retinal neurons. The primate photoreceptors contain three classes: LWS (R and G) cones, SWS1 (B) cones and RH1 rods. Cells that selectively contact LWS cones are labeled Y (yellow) cells. Cells that contact all cones are labeled W (white) cells. BCs contain between 10-15 classes, including midget BCs that selectively contact one cone, diffuse BCs that contact all (db1,3,4,5,6) or perhaps only Y cones (db2), B cone-selective BCs, and rod BCs. In superclass 2, GCs are extremely diverse and range from midget GCs to medium to wide field cells. In superclass 3, HCs form at least two classes: H1 cells contact all cones but are Y biased in function; H2 cells contact all cones with stronger, more balanced B-rich inputs. H1ATs receive input from rods, and H2ATs from rods and cones. © Robert E. Marc, 2008. |
Photoreceptors form the sensory retina. Their distal ciliary extensions form the light-harvesting outer segment layer in mammals (Fig. 20.3), and their proximal somatic and axonal extensions form the neural interface between photoreceptors and the afferent neural chain to the CNS. There are three classes of photoreceptors: (i) rods; (ii) long-wave system (LWS) cones; and (iii) short-wave system 1 (SWS1) cones. Each class displays a distinct morphology as well as visual pigment (see Fig. 20.3), but the full array of genes that confer rod, LWS or SWS1 cone identity remains unknown. Visual pigments (opsins) are GPCRs that bind 11-cis retinaldehyde as their ligand in mammals. Rods alone express the RH1 visual pigment rhodopsin that absorbs maximally at 499 nm (VP 499). LWS cones express either red (R) VP 560 or green (G) VP 530, via a yet uncertain semi-stochastic switch.10 There are no known gene expression differences in LWSR and LWSG cones other than the visual pigment. Indeed, LWSR and LWSG cones are morphologically indistinguishable. Conversely, SWS1 cones differ from LWS cones in subtleties of shape (they are slightly longer and slimmer), connectivity (fewer ribbons) and other gene expression patterns.7 Human or primate SWS1 cones express VP 420 and are also referred to as blue (B) or short-wave (S) cones. Similarly, R cones are also termed L or long-wave cones and G cones termed M or mid-wave cones. We will generally use the R, G, B notation as it conforms to the psychophysical color percepts the cones drive.
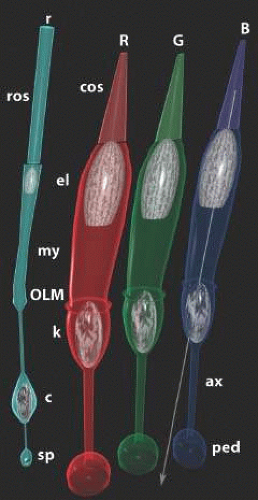 Figure 20.3. A rendering of primate peripheral cones (R,G,B) and rods (r). Each photoreceptor has an outer segment coupled (rod: ros, cone: cos) connected to the inner segment by a narrow ciliary neck. The distal-most portion of the inner segment is formed by the ellipsoid (el), a dense mitochondrial pack. The myoid (my) contains the golgi, smooth and rough endoplasmic reticulum and is the protein synthesis zone. The subretinal space and the true neural retina containing the rod (c) and cone (k) nuclei, their axons (ax) and their synapses (rod spherules: sp, cone pedicles, ped) are separated by a layer of intermediate junctions termed the outer limiting membrane (OLM). Beyond the OLM, photoreceptors act as fiber optics and they are tilted to orient their acceptance apertures toward the optical nodal point of the eye (arrow). © Robert E. Marc, 2008. |
The light-driven switch that activates signaling is the absorption of photons by 11-cis retinaldehyde-opsin to form all-trans retinaldehyde-opsin, which activates binding of the ATP-activated form of the G-protein transducin to opsin and triggers a transduction sequence that leads to closure of cation permeant channels on the photoreceptor outer segment. This closure represents a conductance decrease to a cation with a positive reversal potential and is manifest as photoreceptor hyperpolarization. This voltage change directly gates the rate of synaptic glutamate release by photoreceptor terminals. When depolarized in the dark, photoreceptors release maximal amounts of glutamate; when hyperpolarized in light, release is attenuated.
BCs decode photoreceptor glutamate signals and recode them as their own voltage-driven glutamatergic synaptic outputs.3 Generic synaptic transfers (→) in retinal networks are classified as sign-conserving (>) or sign-inverting (>i). Sign-conserving synapses nominally copy the voltage patterns of the presynaptic cell to the postsynaptic cell. Sign-inverting synapses nominally invert those patterns. Such synapses also possess differences in kinetics and amplification based on their molecular targets. All vertical channel (rod, cone, BC) synapses use glutamate as their transmitter, provide high amplification (>1), and most are sign-conserving. Thus, the cone > HC synapse is a quintessential sign-conserving synapse in which HCs mirror the behavior of cones through the readout of glutamate fluctuations by ionotropic glutamate receptors (iGluRs) of the AMPA type: When cones hyperpolarize to light, so do HCs. There are two kinds of BCs: OFF and ON. Cones drive OFF BCs via high gain sign-conserving AMPA or kainate (KA) IGluRs. One of the unique synapses in the CNS is the high-gain, glutamatergic, sign-inverting synapse between photoreceptors and ON BCs, mediated by a metabotropic glutamate-binding GPCR known as mGluR6. This special high-gain, inverting transition will be symbolized >m.
The fundamental glutamatergic signal flow of photoreceptors → BCs → GCs → LGN neurons → cortex in mammals (a prototypical CNS projection chain) is also shaped by sign-inverting, low-amplification (gain <1) feedback and feedforward micronetworks at every synaptic transfer. Most of these feedback/feedforward events in the inner plexiform layer are mediated by classical inhibitory transmitters: 4-aminobutyrate (GABA, γ) and glycine (gly). In the outer plexiform layer, the molecular mechanism of sign-inverting feedback is unknown, but powerful cone → HC → feedback networks predominate.
Nonneural cells also play a major role in control retinal signaling, though these mechanisms are largely beyond the scope of this chapter. First, as schematized in Figure 20.1, the entire retina is sealed distally from the choroidal vascular compartment by the tight-junctions of the retinal pigmented epithelium (RPE) cell layer and internally mostly by the intermediate junctions of MC processes ensheathing the vascular endothelium.11 In most mammals, three capillary nets emerge from the vitreal vessels of the ophthalmic artery: the first (c1) branches at the interface between the GC and inner plexiform layers; the second (c2) at the interface between the AC and inner plexiform layers; and the third (c3) exactly at the level of the HCs cells in the outer plexiform layer. There are some important exceptions. Like nonmammalians, retinas of lagomorph mammals (rabbits and hares) are avascular. Order Sciuridae (squirrels) lack the c3 net. Importantly, the blood-retinal barrier in arcades c1 and c2 are provided almost exclusively by MCs, whereas HCs and MCs cells form roughly equal contact zones in the OPL at arcade c3 in tree shrews.12 Whether this is generic for primates has not yet been established, but suggests that HCs have glial-like endothelial recognition systems. This is intriguing for two reasons. First, only mammals display retinal vascularization and recent discoveries of secreted VEGF inhibitors that maintain corneal clarity13 suggests that similar molecular mechanisms may have played a role in evolutionary regulation of retinal vascularization. Second, the tolerance of the mammalian retina for vascular cells also invites pathological over-invasion, such as in neovascular macular degeneration. A recently characterized form of neovascularization apparently arises from arcade c3 and is termed retinal angiomatous proliferation (RAP).14 It is plausible that RAP involves loss or modulation of HC. AsCs reside in the layer of optic nerve fibers and sometimes around retinal capillaries in net c1.
Retinal Patterning
Retinal photoreceptors convert a photon-based image into a mixed array of photoreceptors generating primary photocurrents transformed into synaptic drive.15 We can think of this drive as a synaptic image. The cone mosaic of humans and primates is patterned (Fig. 20.4) in a manner roughly analogous to the Bayer pattern of digital color CCD arrays.16,17 While not tiled like nonmammalian cone arrays18 and nearly random in organization, the cones of primates are differentially expressed17,19 so that B cones comprise a minority: about 7% of the human mosaic.20 The remaining cones are a mix of R and G, the ratio varying widely across individuals, ranging from a high of 16.5:1 to about 1:1 in males, and 0.37:1 in some females.21 In primates, the photoreceptor layer is dominated by rods except in the central 2 degrees of visual angle, where cone density rapidly rises to a sharp peak at 160,000 cones/mm2 (Fig. 20.5) and the rod density drops to zero in the foveola,22 a region about 0.25 degrees in diameter. In the periphery (beyond 20 degrees), the cone density drops to 5,000 cones/mm2. Importantly, the cone inner segments (the light capture compartment) become proportionally larger in the periphery, increase diameter from about 2 μm in the foveola to 7 to 8 μm beyond 20 degrees. Thus, the coverage of image space by cones smoothly decreases from 100% to ≥30%. This is quite different from rodent retinas where the cone density may be higher (>10,000 cones/mm2) than peripheral primate retina, but image coverage never exceeds 3%.23 Cone density is less important than the coverage.
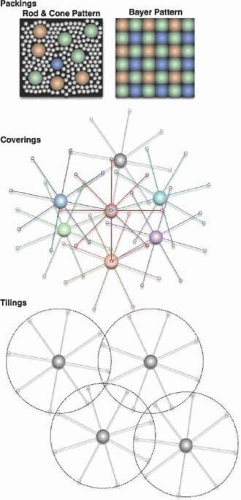 Figure 20.4. Patterns of retinal cells. Packings: rods and cones form disorderly but space-filling packings, while the Bayer Pattern used in digital cameras is precise by design. Coverings: ACs of any one class overlap their processes to cover visual space. Tilings: GCs of any one class capture spatial domains to tile the retina without significant overlap. © Robert E. Marc, 2008. |
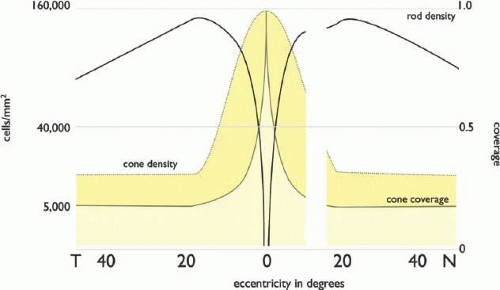 Figure 20.5. Photoreceptor distributions in the human eye. Curves are plotted on a square root scale (ordinate) versus eccentricity (abscissa). Rod density (solid black line) peaks at about 150,000 cells/mm2 at 20 degrees from the fovea. Cone density (dotted line) peaks at about 160,000 to 200,000 cells/mm2 at the foveola. Replotted from Curcio CA, Sloan KR, Kalina RE, et al: Human photoreceptor topography. J Comp Neurol;292:497–523, 1990. The faction of light captured by cones, cone coverage (solid colored line) is shown on the right ordinate, and drops from 1 in the foveola to about 0.3 in the periphery. |
Neurons are also patterned on global and local scales.24,25 Local patterns are termed mosaics (see Fig. 20.5), and each cell class possesses its own portion of a segmented synaptic image. The functional attributes of these mosaics in forming synaptic images are determined by several features of individual cells: their abundance, regularity of spacing, dendritic overlap, and synaptic density. Dendritic overlap and abundance are often combined into a dimensionless coverage factor (CF): the product of the projected planar area subtended by the dendritic arbor of an average cell (mm2/cell) in the class and its spatial density (cells/mm2). Three distinct pattern classes15 or mosaics are found in the vertebrate retina and are characterized by their overlap features. Packings are mosaics with no overlaps allowed, though there may be gaps. Photoreceptors form packings with CF <1. In other words, each point in visual space is sampled by only one photoreceptor, which necessary excludes all other photoreceptor classes. Coverings are mosaics that allow no gaps, but permit overlap. ACs overlap their dendritic arbors to form coverings with CF >>1. Perfect tilings are idealizations that admit neither gaps nor overlaps and CF = 1. The classes of the GC cohort roughly approximate tilings. Thus, the initial synaptic image is fractionated into rod, LWSR, LWSG and SWS1B packings and these collections partially smoothed by tiles of each GC class, with further smoothing by high-coverage factor ACs and HCs. Paradoxically, the dendritic arbors of HC have small overlap compared to ACs and more resemble CNS astrocytes. However, a powerful mechanism generates a high physiological coverage factor: connexin-based coupling. This will be addressed in detail later.
Local patterning is a measure of the spatial precision of a class. Spacing in a class can be statistically orderly, ranging from nearly perfect crystalline patterns such as cone26 and BC patterns in fish eyes,27 to random as shown by AxC classes such as interplexiform cells.28 For the latter and for neurons that have high coverage factors, the spacing is measured as the distance between somas, which is a rough gauge of the center of mass for a mosaic element. The precision of spacing is gauged in several ways, the most common being the nondimensional conformity ratio (CR),25,29 also known as the regularity index:24 the ratio of the mean minimum distance between cells to its standard deviation. Thus, highly precise patterns with little spacing variability have large CR values and random ones have CR of about 1. Normally, CRs of mammalian retinal neurons rarely exceed 4, while nonmammalian fish photoreceptor CRs can approach 30. Such high precision in patterning is likely closely associated with velocity detection in more complex visual environments than experienced by mammals.
Global patterning rules impact retinal function as cell abundance can vary with eccentricity, forming central zones with class mixture specialized for acuity and chromatic processing.7,25 In the humans, the retina possesses a rod-free declivity where neuronal cell bodies (intense Rayleigh scatterers) are displaced in an aster pattern around the foveola and cone diameters decrease to about 2.5 μm, achieving densities of 160,000 cones/mm2.22 The peak rod density is found at about 20 degrees parafoveally in nasal and temporal retinas (see Fig. 20.5). Thus, cone-selective BCs and GCs are at their highest densities in central retina, while rod-specific neurons are concentrated in an annulus around the fovea. Other highly visual mammals such as cat and rabbit lack optically optimized foveas but still display elevated concentrations of cones in central regions in which cones are found at a higher density, though lower than in primates. A correlate of this density gradient is that, like cones, most neurons are smaller in the central retina (packed more densely) and larger in the periphery,25 including HCs, rod BCs,30 GCs of the primate retina,31 and ACs.32 Figure 20.6 illustrates the variation in starburst AC size with increasing eccentricity. Correspondingly, larger dendritic arbors provide larger physiological receptive field sizes33 and decreases in the resolving power in peripheral retina.
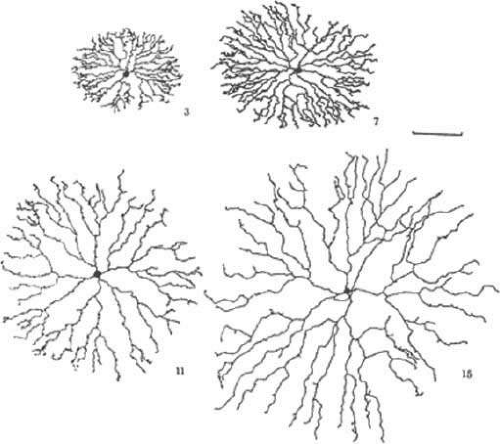 Figure 20.6. Camera lucida drawings of four starburst ACs from the rabbit retina, located at increasing distance from the center of the eye. The basic shape of the cell remains the same, but the size increases. Marker bar is 100 μm. The numbers indicate the relative position of the drawn cell in the series. (Tauchi M, Masland RH: The shape and arrangement of the cholinergic neurons in the rabbit retina. Proc R Soc Lond B223:101, 1984, with permission of the authors.) |
Synapses and GAP Junctions in the Retina
Each neuron decodes upstream visual signals via distinctive sets of receptors for specific neurotransmitters or molecular sensors for other chemical signals, such as nitric oxide.3 Generically, each neuron decodes an array of incoming molecular signals into its voltage responses and encodes those into its own neurotransmitter release patterns. For example, photoreceptors decode the rate of photons captured by VPs as photovoltages and encode those photovoltages as time-varying synaptic glutamate release; at the next element in the chain, BCs decode the rate of glutamate molecules released by photoreceptors as synaptic currents, summed as cellular voltage responses, and encode their own synaptic glutamate release.
Most synapses in the vertebrate retina are fast: presynaptic encoding/postsynaptic decoding pairings that mediate millisecond-scale signaling. Fast synapses are assembled in one of two architectures: ribbon and conventional. High-performance glutamatergic ribbon synapses (Fig. 20.7, 20.8, and 20.9) of photoreceptors and BCs contain large vesicle pools and display sustained vesicle fusion rates approaching 1,000 vesicles/second.34 Conventional fast γ, gly, and cholinergic (ACh) synapses made by AC cells involve small vesicle clusters, limited fusion rates, and short durations of release.35 Inhibitory GABA-releasing synapses represent the majority of synapses in the retina (Fig. 20.10), likely due to the need to control the powerful synaptic output of BCs. Both ribbon and conventional synapses are focal in action and represent a unidirectional transfer of information at a pair of processes in a synaptic network. A variant of the conventional synapse is the en passant or nonpaired form in which dopamine or peptides are released into the extracellular space via volume conduction to modulate cells in a global rather than discrete mode. A detailed review of transmitters and receptors in the vertebrate retina has recently been published3 and is summarized in Table 20.2.
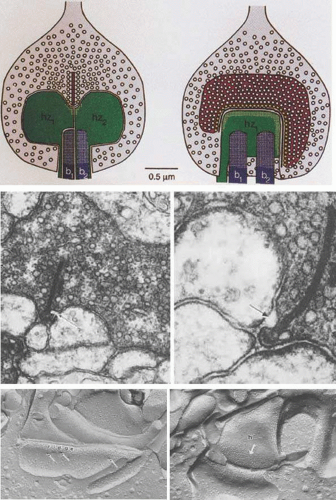 Figure 20.7. The ultrastructure of rod synaptic ribbons. (A) Schematic of a rod photoreceptor terminal in the mammalian retina. The left drawing is perpendicular to the ribbon, the right drawing parallel to the ribbon. Presynaptically, a long active zone docks about 130 vesicles (yellow) and the extensive ribbon tethers about 770 vesicles. Postsynaptically, four processes (two HC and two BC [b]) occupy the invagination; the HC receptors (white speckling) arch parallel to the active zone and thus always lie near (16 nm) the docking sites; the BC receptors (white speckling distributed over entire surface) lie far (130 to 640 nm) from the docking sites. The mouth of the invagination is exaggerated because parts of the rod were cut away for clarity. (Drawing and description from Rao-Mirotznik R, Harkins A, Buchsbaum G, Sterling P: Mammalian rod terminal: architecture of a binary synapse. Neuron 14:561, 1995, with permission of the authors and Cell Press). (B,C) Ribbon synapses in rod photoreceptor bases of the Xenopus retina. Note the fusion of a synaptic vesicle with the rod membrane adjacent to the synaptic ribbon (arrows). (A, × 72,000; B, × 120,000; courtesy of P. Witkovsky and C.C. Powell.) (D) A freeze-fracture view of the photoreceptor synaptic ridge characterized by a densely packed array of P-face particles (ridge). Adjacent to the ridge are three vesicle fusion sites (arrows). (× 100,000) (E) An HC dendrite (h) showing a dense array of P-face particles (arrow), which may represent glutamate receptors (× 115,000). (Data of A.R. Nagy and P. Witkovsky.) |
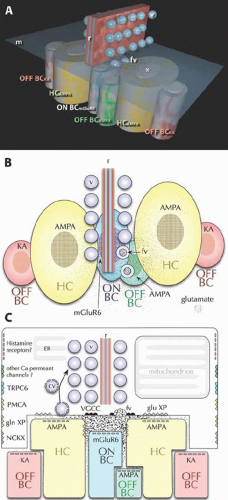 Figure 20.8. The ultrastructure of cone synaptic ribbons. Each cone contains 20 to 50 synaptic ribbons and each ribbon has a specific signaling architecture. (A) A flattened cone ribbon complex viewed as a transparent rendering. The synaptic ribbon (r) aggregates glutamate-filled vesicles (v) for Ca2+-mediated fusion (fv) with the cone membrane (m). This releases a cloud of glutamate molecules (*) into the synaptic cleft. Dendrites of target cells are stereotypically positioned opposite the ribbon. Beneath the ribbon but displaced from it are the dendrites of ON BCs expressing mGluR6 receptors and OFF BCs expressing AMPA receptors. Flanking the ribbon close to the membrane are large HC dendrites expressing patches of AMPA receptors. Furthest away (about 500-1000 nm) are the dendrites of OFF BCs expressing KA receptors. (B) A projection viewed from inside the cone through the membrane showing that glutamate released (stippling) from fusion vesicles (fv) form a gradient from high to low concentration. (C) A vertical projection showing the same glutamate gradient and additional complexities of the cone pedicle including the endoplasmic reticulum (ER), VGCCs, glutamate transporters (glutamate XP), Na+-Ca2+-K+– exchangers (NCKX), plasma membrane Ca2+– transporters (PMCA), TRPC6 channels (TRPC6), perhaps other Na+-permeant channels and histamine receptors. © Robert E. Marc, 2008. |
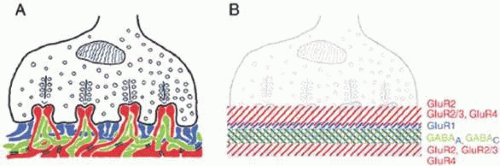 Figure 20.9. The glutamate receptor architecture of the mammalian cone pedicle. (A) Schematic drawing of the cone pedicle with the dendrites of horizontal (red), ON cone bipolar (green), and OFF cone bipolar (blue) cells. The desmosome-like junctions are indicated by the black double lines. (B) Drawing of the cone pedicle and the precisely laminated expression of glutamate receptors and GABA receptors. (Haverkamp S, Grunert U, Wässle H: The cone pedicle, a complex synapse in the retina. Neuron 27:85, 2000, with permission of the authors and Cell Press.) |
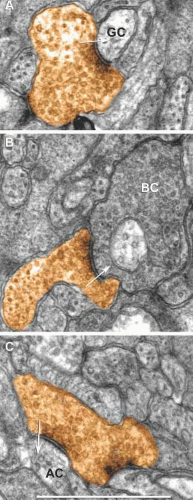 Figure 20.10. Conventional GABAergic AC synapses in the mammalian retina. AC presynaptic terminals (orange) with vesicle accumulatiosn near dense plasma membrane profiles targeting (A) GCs, (B) BCs and (C) other ACs. The synaptic polarity is indicated by the arrow. Scale, 500 nm. Marc, Watt, Jones and Anderson, unpublished data. |
Table 20.2. Major Retinal Neurotransmitter Systems | ||||||||||||||||||||||||||||||||||||||||||||||||||||||||||||||||||||||||||||||||||||||||||||||||||||||||||||
|---|---|---|---|---|---|---|---|---|---|---|---|---|---|---|---|---|---|---|---|---|---|---|---|---|---|---|---|---|---|---|---|---|---|---|---|---|---|---|---|---|---|---|---|---|---|---|---|---|---|---|---|---|---|---|---|---|---|---|---|---|---|---|---|---|---|---|---|---|---|---|---|---|---|---|---|---|---|---|---|---|---|---|---|---|---|---|---|---|---|---|---|---|---|---|---|---|---|---|---|---|---|---|---|---|---|---|---|---|
| ||||||||||||||||||||||||||||||||||||||||||||||||||||||||||||||||||||||||||||||||||||||||||||||||||||||||||||
An important feature of synaptic transmission is its regulation by voltage-gated calcium (Ca2+) currents. An array of low-voltage threshold (L-type) Ca2+ channels are localized to synapses near synaptic vesicle docking proteins and participate in converting cell voltage into neurotransmitter release by controlling vesicle fusion rates. When these channels open, thin domain of cytoplasm subjacent to the membrane experiences a rapid, large increase in [Ca2+]i (10 to 100 μM), 3- to 4-fold higher than basal levels.36 In the remainder of the presynaptic terminal, however, [Ca2+]i does not rise as high because of extensive buffering via calcium-binding proteins, export pumps, and sequestration in endoplasmic reticulum and mitochondria compartments.37 The dynamics of these compartments are clearly critical components of synaptic signaling and the molecular partners are only now being clarified.38 For example, the loss of photoreceptor-specific Ca channels (Cacna1F) in the nob2 (“no-b-wave”) mouse renders rods unable to signal, thus creating a synaptic form of congenital stationary night blindness.39
A second intercellular mechanism allows direct electrical signal sharing across cell pairs: electrical coupling mediated by gap junctions. Gap junctions (sometimes called electrical synapses) are assemblies of transmembrane proteins known as connexins.40,41,42 Connexins self-assemble into hexameric connexons resembling transmembrane tunnels with pore sizes up to 2 nm in diameter (Fig. 20.11). Pairs of connexins in adjacent cells align their pores to form transcellular channels and large rafts of connexins, like parallel resistors, allow large transcellular currents to flow. Connexins can allow direct flow of molecules up to 1,000 Kd between cells. The key differences between unidirectional synaptic and bidirectional gap junction signaling is that synapses require energy, and can amplify and control the polarity and waveforms of signals, while gap junctions generally cannot. Gap junctions provide a low-energy, efficient way of fanning out signals from a neuron to selected partners within or across cell classes. For example, HCs tend to be highly coupled to each other, and from the standpoint of electrical current spread, a patch of adjacent HCs acts like a single large cell.
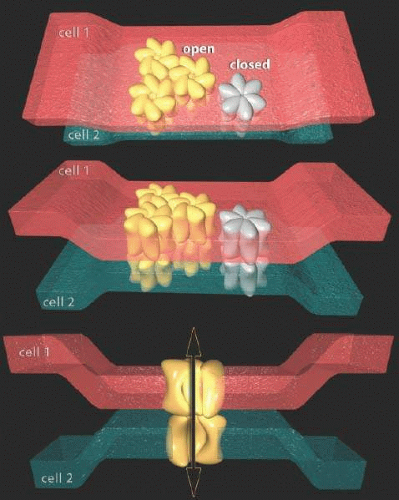 Figure 20.11. Scale renderings of connexons forming gap junctions between cells. Each connexon is a hexamer of connexins and the tilt of the subunits determines whether the junctions are open or closed. The normal extracellular gap between cells is roughly 10 nm, but when connexins in adjacent cells bind, the pull the membranes close to within 2 nm of other forming the so-called gap. When aligned, gap junctions form a diffusion pore of roughly 2 nm diameter between the cells. © Robert E. Marc, 2008. |
Gap junctions vary in size, type, and coupling efficacy.43 There are many vertebrate connexin (Cx) genes. The most important in mammals are Cx36, Cx45, Cx50, and Cx57.42 Cx36 predominantly mediates coupling between photoreceptors,44 between some sets of ACs cells,45 and in varied mixtures with Cx45 (or Cx45 alone),46 between some ACs and BCs. Gap junctions between photoreceptors are often small, with connexin patches 100 nm wide,42,47 while HCs cells are coupled by gap junctions up to 5,000 nm. As connexin densities are similar across cell classes (about 5,000/μm2), larger gap junctions carry more current. Importantly, gap junctions can also be modulated, opened, or closed in response to a variety of signals. Many types of retinal neurons are electrically coupled through gap junctions (Figs. 20.12 and 20.13). The coupling may be strong, as in the homocellular coupling of HCs,48 AII ACs,49 or weak, as has been shown for cones42 or CGs.50
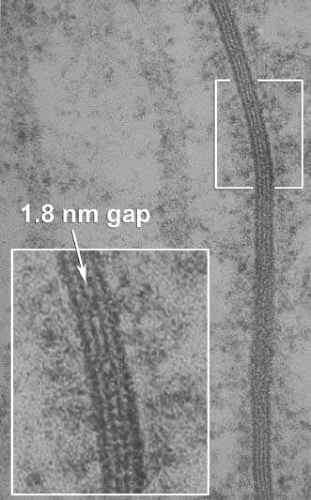 Figure 20.12. Electron microscopy of a large gap junction between two AC dendrites in the retina. A well-aligned region shows the heptalaminar pattern of a true gap junction. The enlargement marks the 2 nm extracellular gap. Reprinted from original data negatives of Marc, Muller, and Liu. |
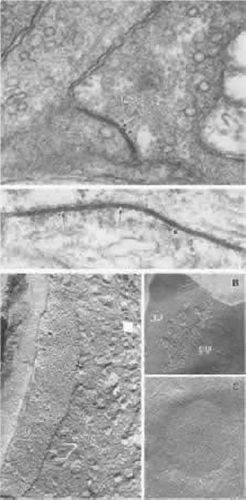 Figure 20.13. Gap junctions in retinal photoreceptors and HCs. Part 1. Gap junctions viewed by transmission electron microscopy. Top. A gap junction (arrows) between a rod base (ROD) and a basal process emitted by a neighboring rod (left) in the Xenopus retina (× 180,000). Bottom. An extensive gap junction (arrows) between two HC axons in a Xenopus retina (× 216,000; data of P. Witkovsky and C.C. Powell). Part 2. Gap junctions viewed by freeze fracture. (A) Gap junction (large arrows) on the protoplasmic face (PF) of the photoreceptor base in the Xenopus retina. At right the receptor cytoplasm is seen in cross fracture; synaptic vesicles (SV) are indicated by small arrows (× 109,500). (B) Gap junction on the photoreceptor membrane in the Xenopus retina. The fracture plane passed through the junction, revealing both the protoplasmic face (PF), bearing particles, and the external face (EF), bearing pits associated with the gap junction (× 127,750). C. HC gap junction in the Xenopus retina. The external membrane face contains a plaque of E-face pits (× 27,750; data of A. Nagy and P. Witkovsky). |
Photoreceptor Synaptic Terminals
Rods and cones drive massive amounts of synaptic glutamate release in the OPL via their synaptic terminals.51 The short axons of rods enlarge into spherules or synaptic endings about 2 to 3 μm in diameter.52 In the perifovea (≈20°), they form a layer 2 to 3 terminals deep just distal to the of layer cone pedicles that borders the OPL. Each spherule contains thousands of synaptic vesicles, one or two curved synaptic ribbons forming a rapidly releasable vesicle pool53 near the vesicle fusion sites of the spherule presynaptic membrane, and one mitochondrion.54 Glutamate liberated into the synaptic cleft by vesicle fusion is detected by two to four rod BC dendrites and one to four HC axon terminal processes.55 Cone synaptic terminals, called pedicles because of their pediment-like shape, enlarge from their axon to a base over 5 μm in width. Pedicles contain many thousands of vesicles, over 50 synaptic ribbons, and contact a vast array of targets, perhaps numbering over 100 dendrites from 8 to 12 types of cells.56
Photoreceptors tonically release glutamate when depolarized, decreasing the release rate upon hyperpolarization in light.3 In the dark, photoreceptors are relatively depolarized, and their synaptic Ca2+ channels have a higher probability of being open,57 permitting a greater influx of Ca2+, greater vesicle fusion rates and high glutamate release (Fig. 20.14). Light-evoked hyperpolarization of photoreceptors triggers graded closure of calcium channels, proportional to light intensity, and reduced Ca2+ entry slows glutamate release, as illustrated in Figure 20.15. Voltage-gated Ca2+ channels in cones (Cacna 4.1) are concentrated in the synaptic region.58,59 Calcium export pumps (PMCA2 in cones) are located in bands distal to the vesicle fusion zones and nearer the mitochondria, while Ca2+-Na+-K+ exchangers for Ca2+ are near the base of the pedicle.60 Their roles are to clear the cytoplasm of excess Ca2+. Further, Ca2+-sequestering sites such as the endoplasmic reticulum, mitochondria, and Ca2+ binding proteins also regulate the basal Ca2+ concentration of the synapse. A major aspect of cones is their ability to adapt to bright lights, which means restoring synaptic Ca2+ to dark levels. Major new discoveries in presynaptic Ca2+ regulation include the presence of transient receptor potential (canonical) or TRPC channels in photoreceptors.61 This orchestra of channels and pumps serve to monitor and regulate the basic Ca2+ levels necessary to maintain glutamate release.
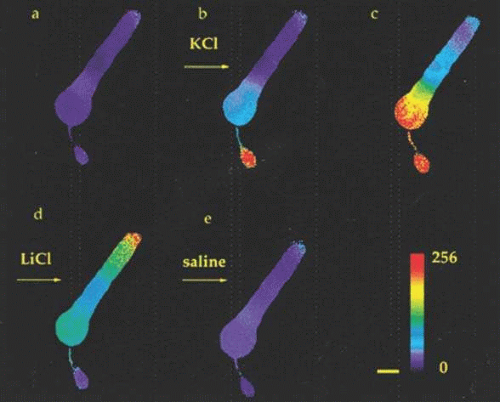 Figure 20.14. Spatiotemporal dynamics of calcium changes in a rod photoreceptor. Sequential images of [Ca2+]i changes were recorded from a Fura 2-loaded rod. Between (a) and (b) the rod was superfused with high KCl. The images in (b) and (c) were captured 3 and 21 seconds after KCl application, respectively. The image in (d) was captured 15 seconds after KCl was replaced by LiCl. The image in (e) was captured 7 seconds after the return to control saline. These images show that KCl-evoked increases in [Ca2+]i occurred most rapidly in the synaptic terminal region and then in the basal region of the inner segment. In LiCl, the inner segment and synaptic terminal returned to baseline while [Ca2+]i in the outer segment rose, most notably at the tip. The pseudocolor scale representing the 256 gray levels of the 340/380 ratios is shown on the bottom; red indicates the largest changes. Scale bar, 10 μm. (Adapted from Krizaj, Copenhagen: Neuron 21:249, 1998, with permission of the authors and Cell Press.) |
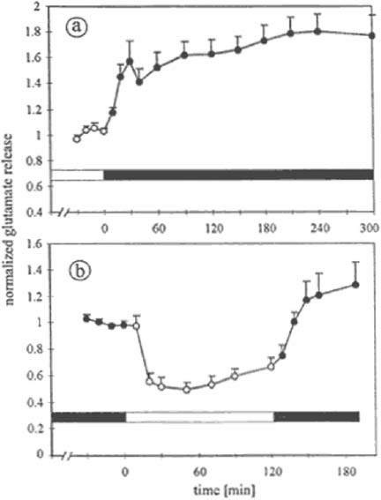 Figure 20.15. Dependence of glutamate release on light and dark adaptation. (a) Xenopus eyecups were treated to remove neural layers, leaving a layer of intact photoreceptors. These “reduced” retinas were maintained for 5 hours in white light, then dark-adapted for 5 hours. Dark and light periods are indicated by the horizontal bar. Each data point represents the glutamate content of 10-minute samples of superfusate (n = 12, mean ± SE). Data are normalized to the average of the light samples. Glutamate release increased markedly within the first 30 minutes of dark adaptation and slightly within the subsequent 4.5 hours. (b) Reduced retinas were dark-adapted overnight, stimulated by white light for 2 hours, then dark-adapted for 1 hour (n = 7). Data are normalized to the average of the first four dark samples. White light reduced release by about 50%. When the light was extinguished, the release rate increased about twofold. (Schmitz Y, Witkovsky P: Glutamate release by the intact light-responsive photoreceptor layer of the Xenopus retina. J Neurosci Meth 68:55, 1996, with permission of the authors and Elsevier Science B.V.) |
Bipolar Cells in Mammalian Retinas
A typical mammalian retina has over ten BC classes (Fig. 20.16), one driven exclusively by rods and the others by cones.7,62 BCs also subserve a major functional organizing principle for the visual system: the generation of separate ON and OFF channels. ON BCs respond to light with graded voltage depolarizations and have long axons ending deep in the IPL. OFF BCs respond to light with graded voltage hyperpolarizations and have short axons ending high in the IPL. Rod BCs are ON cells (Fig. 20.17), comprise about 40% of all BCs and have densely branched dendritic arbors contacting 20 to 30 rods at ≈ 1 mm from the fovea and roughly twice that number in peripheral retina.30 Cone BCs cells come in several classes. Midget BCs63 found in primate and squirrel retinas each contact a single cone in the fovea, but in peripheral retina may contact more than one cone. Midget BCs contact LWSR or LWSG cones (Fig. 20.18), but are thought not to contact SWS1B cones by some authors.64 Others argue for the presence of a midget OFF BC selective pathway.65 Most of our knowledge of B cone signaling involves a unique nonmidget ON BC that selectively contacts a sparse collection of B cones.66 However, the concept of a predominantly pure ON blue pathway has received further challenges by discovery of blue-selective OFF BCs in rabbit retinas as well.67 Midget BCs typify two types of relationships between cone synaptic terminals and BC dendrites. ON midget cells make invaginating dendrites forming a central member of the synaptic triad at ribbon synapses. OFF midget cell dendrites end as flat (basal) junctions on the surface of the cone. Each central LWSR and LWSG innervates many copies of ON and OFF midget bipolars (see Fig. 20.11).
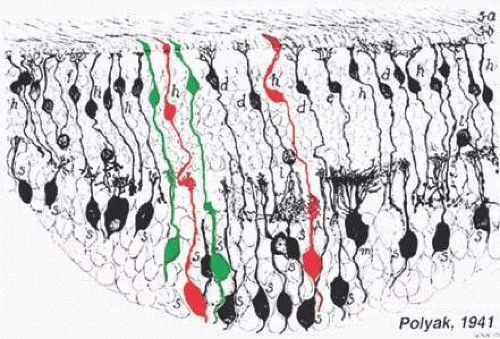 Figure 20.16. The midget BC pathways of the primate retina. The drawing in black is taken from Polyak S: The Retina. Chicago: University of Chicago Press, 1941. The cells drawn in red and green are BCs and midget ganglion cells connecting to L and M cones, respectively. The cone synaptic bases are indicated at top. Each cone type connects to two midget BCs, one of which makes invaginating contacts and ends in the proximal portion of the inner plexiform layer; the other makes basal contacts with cones and ends in the distal portion of the inner plexiform layer. In functional terms, these are, respectively, ON- and OFF-center BCs, which contact ON- and OFF-center midget ganglion cells. (Drawing courtesy of Dr. Helga Kolb.) |
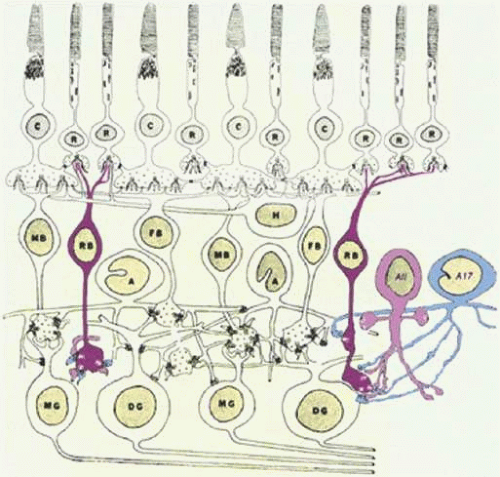 Figure 20.17. The rod BC pathway of the mammalian retina. Rod BCs (RB) contact multiple rod photoreceptors (R) in the outer retina. Their axon terminals end in the ON zone of the inner plexiform layer in close proximity to diffuse ganglion cells (DG) but without making a direct contact. Instead, the rod BCs contact two types of AC, the AII and the A17. (Drawing courtesy of Dr. Helga Kolb.) |
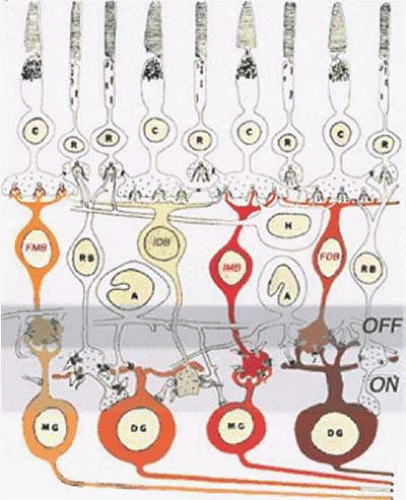 Figure 20.18. Diffuse BC pathways of the primate retina and the ON OFF lamination of the retina. The axons of flat midget BCs (FMB) terminate in the distal portion of the inner plexiform layer, which is the OFF zone, whereas those of invaginating midget BCs (IMB) terminate in the proximal portion of the inner plexiform layer, the ON zone. Rod BC axons (RB) and those of invaginating diffuse bipolars end in the ON zone; those of flat diffuse bipolars (FDB) end in the OFF zone. (Drawing courtesy of Dr. Helga Kolb.) |
The dendrites of B cone-specific ON BCs66 are long and sparse compared with those of a midget BC, as blue cones are a minority (7% to 10%) of the cone population and are widely spaced. Blue cone-selective ON BCs typically contact only two or three cones. The density of these BCs is highest in central retina although at the foveola there are presumably fewer as the blue cones density drops in the foveal pit.19 The dendrites of blue cone BCs are invaginating and the axons terminate in the proximal portion of the IPL (Fig. 20.19). Diffuse BCs seem to contact all cone types but statistically contact fewer B cones.68 Primates may also have OFF center diffuse BCs equivalent of ground squirrel diffuse OFF BCs that completely avoid B cones.69 Several morphological classes of both ON and OFF diffuse BCs are also known (see Fig. 20.18), and the full physiological meaning is only known emerging, but clearly has to do with molecular tuning of BCs for sensitivity and speed. The axons of diffuse BCs end in distal and proximal portions of the IPL and are associated with specific subsets of ganglion cell.
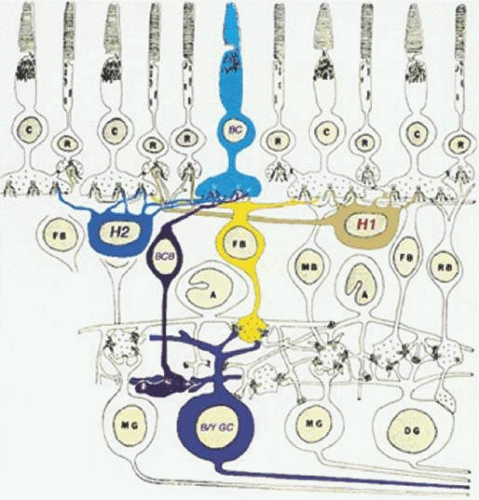 Figure 20.19. The blue cone BC pathway of the primate retina. Blue cone contacting BCs (BCB) make invaginating contacts with blue cones (BC) in the outer retina. The blue cone bipolar axon terminal provides input to a blue/yellow color-coded ganglion cell (B/Y GC) in the inner plexiform layer. The yellow surround is provided by diffuse cone bipolars (FB), which contact both L and M cones at basal junctions. Other cell types: C, cone; R, rod; DFIG and H2, HCs, MB; midget bipolar; RB, rod bipolar; A, AC; MG, midget ganglion cell; DG, diffuse ganglion cell. (Drawing courtesy of Dr. Helga Kolb, based on Dowling JE, Boycott BB: Organization of the primate retina: Electron microscopy. Proc R Soc Lond Biol 166:80, 1966.) |
Horizontal Cells in Mammalian Retinas
HCs are gliaform cells that serve as the lateral inhibitory interneurons of the outer retina. Most mammalians have axonless and axon-bearing HCs, though some (mouse and rat) have only axon-bearing HCs.70,71,72 HC somatic dendrites selectively contact cones, while HC axon terminal (HCAT) dendrites generally contact only rods. It important not to confuse the HCAT with axonal fields of true multipolar neurons. HCs do not spike and mammalian HC axons appear to serve only as trophic support for the large cell-like HCAT.73 Primates have two or three classes (see Fig. 20.2) of HCs.74 Class H1 contacts both LWS and SWS1 cones and comprises about 80% of all HCs. Their physiological responses are yellow-dominated (Y=R+G). Class H2 cells comprise about 20% and are enriched for blue responses, as they tend to contact more SWS1 cones than H1 cells. Class H3 HCs have been described by the Golgi method,75 but have as yet no known molecular signature that would allow them to be found by an independent method. Primate HCs contact about a dozen cones in the foveola and nearly two dozen in the periphery. In the rod-free region of the central retina, H1 cells are axonless but do display HCATs in the periphery, contacting a few hundred rods in primates. Homologous HCATs in nonprimate (type B HCs in cat and rabbit) contact perhaps a thousand rods. HCATs in most mammals have exclusively rod-driven responses, with no evidence of cone signals, which is further evidence of the lack of axonal signaling. HCs engage in extensive homologous (in-class) coupling. The equivalent of primate H1 cells is the rabbit type B axonal HC, which has moderate somatic coupling.48,76 Primate H1 and H2 cells do couple across classes, and form completely separate mosaics.76,77 The axonless type A HC of the rabbit has no homologue in primates, and is extensively coupled.48 HCs are also unusual in directly contacting capillary net c3 endothelial cells mammals,12 further suggesting they possess glial attributes.
Photoreceptor → HC and BC Signaling
Photoreceptor signals to BCS and HCS are decoded by glutamate receptors of two groups: tetrameric assemblies of transmembrane ionotropic glutamate receptor (iGluR) subunits and single protein heptahelical, metabotropic glutamate receptors (mGluRs). The iGluRs are one of three distinct superfamilies of ligand-gated ion channels. The mGluRs are not channels at all, but GPCRs linked through several transduction pathways to cellular modulators. The details of these receptors in vision have been reviewed extensively.3,7 In broad terms, iGluRs are subdivisible into (i) AMPA and kainate (KA) receptors that directly mediate synaptic drive by opening cation channels and (ii) NMDA receptors that act as complex coincidence detectors, requiring simultaneous glutamate-binding, membrane depolarization and a co-receptor activation. D-serine is the likely co-receptor ligand.78 AMPA and KA receptors mediate signaling in the OPL, while AMPA and NMDA receptors function in the IPL.79,80 AMPA or KA holoreceptors are formed by four homologous protein subunits with three membrane spanning segments each. AMPA are co-assemblies of GluR1-4 subunits and KA receptors are co-assemblies of GluR5-7 + KA1,2 subunits. Many subunits have splice and RNA-editing variants, allowing for significant complexity in receptor properties and trafficking. AMPA and KA receptors admit a variety of subunit mixtures, bestowing the holoreceptor with a range of glutamate affinities, unitary conductances, kinetics, modulation, and trafficking regulation. HCs decode photoreceptor glutamate signals with AMPA receptors81 and contain GluR4 and GluR2/3 subunits.82 Some OFF BCs express AMPA receptors, while most express KA receptors.83 AMPA and KA receptors provide a canonical sign-conserving synapse.
The mGluR superfamily is complex and many mGluRs are expressed in the mammalian retina.3 The mGluR6 receptor is a group C obligate-dimer and decodes photoreceptor glutamate signals in rod and cone ON BCs in a sign-inverting mode. The mGluR6 transduction pathway is poorly understood, but likely involves a Goα-type G-protein84 whose activation via glutamate binding mediates closure of a nonselective cation channel with high calcium permeability. Cone hyperpolarization slows synaptic release and accelerates EAAT2 uptake,85 the rapid drop in glutamate concentration leads to inactivation of mGluR6 and depressed inhibitory signaling. BC cation channels open and the inward current depolarizes the ON BC. We do not yet know the nature of those channels. Recently, another group C family member, the mGluR7 receptor, has been found in association with some cone ON BCs.86 Its selective role remains unknown.
Differential expression of glutamate receptors by BCs creates parallel ON and OFF channels in vision. In general, ON BCs express mGluR6 receptors and OFF BCs express either AMPA or KA receptor pharmacologies. But Hanna and Calkins87 have clearly shown that primate ON BCs also express a cohort of AMPA receptors, even though mammalian ON BCs display no robust iGluR currents.80 This suggests a complex role for receptor trafficking and turnover as a key regulator of BC functional identity. Further, Marc et al88 recently showed significant plasticity in rod BCs of human retina in cone-sparing forms of retinitis pigmentosa where loss of rods, but not cones, led to phenotype switching from ON to OFF in rod BCs. The fact that normal rod BCs express iGluR subunits argues that such switching is within the normal capacity of BCs. The difference between expression (mRNA synthesis) versus display (properly inserted transmembrane proteins) is terra incognita at present.
A great deal of our understanding of parallel information processing channels is based on the differential pharmacologies of iGluR/mGluR pathways. This large literature is reviewed in Marc 2004.3 Thus, mGluR6 receptors drive the canonical ON (sign-inverting) and iGluR receptors drive the canonical OFF (sign-conserving) pathways. But even within the iGluR group, there is finer granularity. The majority of OFF BCs in ground squirrel express KA receptors, which are highly glutamate-sensitive. This raises the issue that AMPA, KA and mGluR6 receptors differ in their glutamate affinity and response kinetics and this is reflected in the patterning neuronal dendrites around ribbon synapses (see Fig. 20.8). Vesicle fusion occurs on either side of the synaptic ribbon and glutamate diffuses along a gauntlet of presynaptic glutamate transporters. Thus, the rapidly desensitizing AMPA receptors of HCs are the closest to the photoreceptor release site and actually respond to light with a smooth progression of channel closures from a highly desensitized state. Next, the invaginating dendrites of ON BCs strategically position mGluR6 receptors a little further away, and the semi-invaginating dendrites of OFF BCs expressing AMPA receptors appear a bit further afield. Finally, ringing this complex of processes are the KA receptor expressing OFF BCs forming classical flat contacts. When a vesicle fuses, most of the glutamate is recaptured by glutamate transporters on photoreceptors or MCs, while receptors distant from the site of release experience levels some 10 to 100-fold lower.
Information Processing in the Mammalian Outer Plexiform Layer
Nocturnal rod vision emphasizes sensitivity. Diurnal cone vision emphasizes acuity, contrast, and speed. Unlike nonmammalians, which display BCs with mixed rod-cone inputs, mammalian rod and cones in mammals target distinct rod and cone BCs. Rod BCs are a single class of mGluR6-driven ON BCs and at least 10 to 12 classes of cone BCs exist: roughly half as ON BCs expressing predominantly mGluR6 receptors and the other half as OFF BCs expressing either KA or AMPA receptors. The switch from scotopic to photopic processing in mammals is not completely understood except insofar as rods saturate and cones become responsive.
The essential role of a cone BC is to develop a neural contrast signal. Its direct center cone inputs combines with signals derived from an indirect or surround field of photoreceptors. Cone BCs have a small dendritic spread, which delimits the center, and the surround signal derives from the HC sheet into which each BC is inserted. This contrast signal has been recorded from the retinas of nonmammalians (fishes, amphibians, reptiles) and is also present in mammals.89 Further, the HC contrast signal is readily detected in the responses of retinal mammalian GCs.90,91 Figures 20.20 and 20.21 outline the conceptual flow of signals that generate contrasting center and surround pathways.
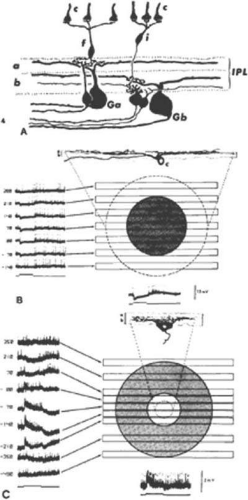 Figure 20.20. (A) Center-surround organization of cone BCs and GCs in the cat retina. Flat cone BCs (f) have axon terminals that end in sublamina a and contact the dendrites of Ga-type ganglion cells. Invaginating cone BCs (i) have axon terminals that ramify at a more proximal level of the IPL in sublamina b, where they contact Gb-type ganglion cells. Ga cells are off-center and Gb cells are on-center ganglion cells. c, cones. (B). Receptive field properties and morphology of an intracellularly stained off-center ganglion cell. Note the dendritic arborization in sublamina a. At left are shown responses to slits of light positioned at different levels of the receptive field. They show that a hyperpolarization (inhibitory postsynaptic potential) is elicited when the slit is positioned between 210 μm and -70 μm (shaded circle). The dotted circle gives the dendritic field of the cell as 490 μm. The response to a diffuse stimulus is shown at bottom. (Stimulus width, 50 μm; duration, 542 msec; wavelength, 441 nm; intensity, 2.7 log quanta μm-2 sec-1). c, cone. (C) Concentrically organized on-center ganglion cell of the rat retina. The dendritic arbor of this cell is confined to sublamina b of the IPL. The membrane depolarization (excitatory postsynaptic potential) is elicited by light stimuli falling between 0 and 210 μm (open circle). The dotted circle indicates the subtense of the cell’s dendritic arbor. The shaded circle indicates the spatial extent of the inhibitory surround (stimulus width, 100 μm; duration, 560 msec; wavelength, 647 nm; intensity, 4.6 log quanta μm-2 sec-1). (Nelson R, Famiglietti EV Jr, Kolb H: Intracellular staining reveals different levels of stratification for on- and off-center ganglion cells in cat retina. J Neurophysiol 41:472, 1978.)
Stay updated, free articles. Join our Telegram channel
Full access? Get Clinical Tree
 Get Clinical Tree app for offline access

|