Purpose
To compare the morphologic parameters of ophthalmoscopically and tomographically normal foveae of the fellow eyes of patients with a unilateral macular hole (MH), other unilateral retinal diseases, and healthy eyes.
Design
Observational, cross-sectional study.
Methods
Of the 849 subjects studied, 183 eyes were excluded because they had an abnormal vitreofoveal interface that might have affected the foveal thickness. The average regional retinal thicknesses of the Early Treatment Diabetic Retinopathy Study sectors determined by spectral-domain optical coherence tomography were compared among 160 patients with MH, 175 patients with epiretinal membrane, 145 patients with retinal vein occlusion, and 186 healthy subjects. The foveal depression was quantified as the foveal pit depth divided by the foveal pit diameter.
Results
The fovea (1 mm) and central fovea were significantly thinner in the MH group (243 and 192 μm) than in the other groups ( P < .0001). There were no significant differences in the thickness of the fovea and central fovea among the eyes with epiretinal membrane (254 and 203 μm) or retinal vein occlusion (251 and 202 μm) or in the healthy group (254 and 201 μm). The foveal depression was significantly greater in the MH group (0.063) than in the retinal vein occlusion group (0.059) or in the healthy group (0.058; P = .014 and P = .0014, respectively). Multiple regression analyses showed that a thinner fovea and a deeper foveal depression were associated significantly with the presence of MH ( P = .0054 to P < .0001).
Conclusions
These results suggest that patients with MH have unique foveal morphologic features that predispose them to MH development.
The basic understanding of the pathogenic mechanisms and staging of macular hole (MH) was made by Gass based on biomicroscopic findings. More recent examinations of cross-sectional optical coherence tomography (OCT) images of the vitreofoveal interface and the foveal deformations observed during the development of MH have indicated that a perifoveal posterior vitreous detachment (PVD) plays a key role in the development of MH. This is because a perifoveal PVD generates centrifugal traction on the foveal surface that causes a foveal deformation, leading to cystic changes, foveal detachments, and photoreceptor dehiscence.
An OCT study showed that a perifoveal PVD often is present during the normal aging process. However, MH does not develop in all of these eyes, and why a physiologic perifoveal PVD leads to the formation of MH in some individuals and not in others has not been fully determined.
It is well known that patients with unilateral MH have an increased risk of MH developing in their fellow eyes; the reported incidence of bilateral MHs ranges from 13% to 22%. Thus, it can be hypothesized that the retinas of patients with unilateral MH have some characteristics at the vitreofoveal interface and in the foveal structure that predispose them to MH formation.
We recently reported that there was a higher incidence of foveal deformations in the fellow eyes of patients with unilateral MH with or without a vitreofoveal adhesion. We therefore suggested that patients in whom MH develops have abnormally firm vitreofoveal adhesions that are strong enough to cause a foveal deformation. Another possible characteristic making the fovea more susceptible to the formation of a MH may be the structure of the fovea. However, the foveal structure of ophthalmoscopically normal fellow eyes of patients with unilateral MH has not been explored fully.
The recently developed spectral-domain (SD) OCT allows 3-dimensional scans with high axial resolution, which improves the accuracy and reproducibility of regional macular thickness measurements. In particular, the Cirrus HD OCT (Carl Zeiss Meditec Inc, Dublin, California, USA) can detect the fovea automatically on a cube data set and then can set the fovea to be the center of the subfields of the Early Treatment Diabetic Retinopathy Study sectors. This then allows accurate and reliable measurements of the thicknesses in the fovea and surrounding sectors.
The purpose of this study was to use the Cirrus HD OCT to determine the morphologic characteristics of the foveae of the healthy fellow eyes of patients with unilateral MH. Because the presence of foveal deformations in the fellow eyes of patients with unilateral MH may affect the foveal thickness and morphologic features, eyes with foveal deformation were excluded. Thus, we compared the regional macular thicknesses determined by Cirrus HD OCT among the fellow eyes with ophthalmoscopically and tomographically normal foveal appearance in patients with unilateral retinal diseases including MH, epiretinal membranes (ERM), and retinal vein occlusion (RVO). Normal-appearing eyes of healthy subjects were used as controls.
Methods
This retrospective, cross-sectional, case-control study was carried out with approval of the Institutional Review Boards of the Shinjo Ophthalmologic Institute, the Kami-iida Daiichi General Hospital, the Nishigaki Eye Clinic, and the Yada Eye Clinic based on the same study protocol. The procedures used adhered to the tenets of the Declaration of Helsinki. The institutional review boards also approved the retrospective collection of the data from medical charts of the patients with and without retinal diseases. Informed consent for the research was obtained from the patients after explanation of the nature and possible consequences of the study.
Participants
We studied the ophthalmoscopically normal fellow eyes of patients with unilateral retinal diseases. Consecutive patients who were examined at the Shinjo Ophthalmologic Institute, Kami-iida Daiichi General Hospital, Nishigaki Eye Clinic, and Yada Eye Clinic from September 2008 through October 2011 were studied. All participants underwent a comprehensive ophthalmologic examination including measurement of the refractive error, best-corrected visual acuity (BCVA) assessment with a Landolt chart at 5 m, axial length measurement by ocular biometry (IOL Master; Carl Zeiss Meditec), slit-lamp examination, measurement of the intraocular pressure with a Goldmann applanation tonometer, dilated indirect slit-lamp biomicroscopy with either contact lenses or noncontact lenses, indirect ophthalmoscopy, and SD OCT examination.
Patients were included if they were diagnosed with unilateral idiopathic MH, ERM, or RVO in one eye and the fellow eye appeared completely normal on slit-lamp biomicroscopy. The healthy subjects were those who were diagnosed with unilateral cataract with their fellow eyes having no significant cataract (BCVA ≥ 20/20) or any fundus abnormalities on slit-lamp biomicroscopy. They also included pseudophakic eyes that had undergone uneventful cataract surgery at least 1 year earlier. One healthy eye was selected randomly when both eyes were eligible.
Individuals were excluded if the BCVA of the study eye was worse than 20/20; if the study eye had significant cataract; if the study eye had ocular diseases such as uveitis or glaucoma or other retinal diseases that can affect the macular thickness; or if the study eye had undergone ocular surgery other than uneventful cataract surgery. Patients with systemic diseases that could affect macular thickness, for example, diabetes mellitus or uncontrolled hypertension, also were excluded.
Spectral-Domain Optical Coherence Tomography Examination Procedures
SD OCT was performed on all eyes using the Cirrus HD OCT instrument to obtain axial images of the vitreoretinal interface. SD OCT scans were obtained with the high-definition mode that was composed of a raster of 5 B-scans with a 4096 A-scan resolution and 0.25-mm intervals between neighboring B-scans. At least 5 B-scan images 6 mm in length through the fovea along the horizontal and vertical axes were recorded. To measure the retinal thickness of the macular region, 6 × 6-mm macular cube scans that consisted of 200 B-scans and 200 A-scans centered on the fovea were performed. Scans were obtained by experienced OCT examiners at least 3 times to obtain images with the highest signal intensity of 7 or more. Scans with centering errors or segmentation errors were excluded.
Classification of Different Types of Vitreoretinal Interface
To determine the relationship between the vitreoretinal interface and the foveal thicknesses, the vitreofoveal interface were classified into 7 types according to a reported classification ( Figure 1 ). This classification was carried out independently by 2 masked observers (M.H. and N.O.). When the classification by 2 of the observers disagreed, a group review was made by 3 reviewers (K.K., M.H., N.O.). If no consensus could be reached by the group review, the eye was excluded.
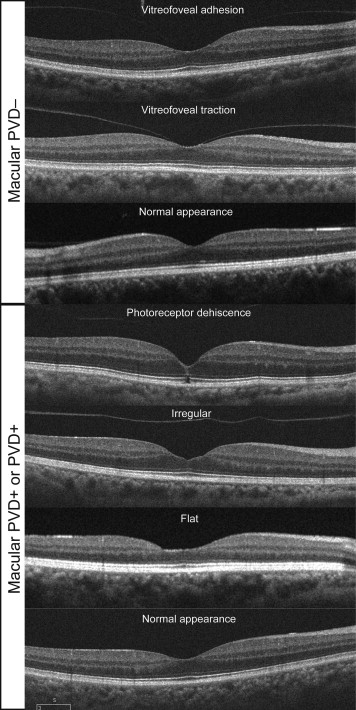
Eyes with a macular or complete PVD were subdivided into 4 types: photoreceptor dehiscence (n = 4), irregular foveal contour (n = 50), flat contour (n = 56), and normal contour (n = 391). Eyes without a macular PVD were subdivided into 3 types: vitreofoveal adhesion interface (n = 46), vitreofoveal traction interface (n = 27), and normal contour (n = 275).
A complete PVD was considered to be present when the Weiss ring was seen on slit-lamp biomicroscopy to be detached freely from the retina and to move in the plane of the posterior hyaloid membrane. A macular PVD was taken to be present when there was a separation of the posterior hyaloid membrane from the macular surface in the serial SD OCT images, but the Weiss ring was not seen on slit-lamp biomicroscopy. Eyes with irregular and flat contours were classified by the loss of the gradual slope of the foveal contour. A vitreofoveal adhesion was defined as an adhesion of the posterior hyaloid membrane only to the fovea without a foveal deformation, and the vitreofoveal traction type was defined as eyes having a vitreofoveal adhesion with a foveal deformation.
Spectral-Domain Optical Coherence Tomographic Measurements
To measure average regional retinal thickness, the retinal thickness map analysis protocol of the Cirrus OCT was used. The software for the regional retinal thickness maps determined the average retinal thickness in 9 macular subfields within a 6-mm diameter circle centered on the fovea as defined in the Early Treatment Diabetic Retinopathy Study. These subfields included the central (foveal) region and the superior, temporal, inferior, and nasal quadrants of the inner and outer rings. The diameter of the central ring was 1 mm, that of the inner ring was 3 mm, and that of the outer ring was 6 mm. The average thicknesses of the entire macular area and of the 4 quadrants in the inner (1 to 3 mm) and outer (3 to 6 mm) rings and of the central subfield were used for the analyses.
To evaluate the shape of the foveal pit, the depth of the foveal pit and the diameter of the foveal pit were measured on the vertical and horizontal B-scan images through the foveal center obtained by a high-definition mode of the SD OCT. The foveal pit diameter was measured as the distance between 2 points of opposite sides with maximal retinal thickness of the fovea (crest-to-crest distance). The foveal pit depth was measured as a distance along an axial line through the foveal center between the vitreoretinal interface and the reference line connecting the vitreoretinal interfaces at the 2 points with maximal retinal thickness. The foveal depression was defined as the foveal pit depth divided by the foveal pit diameter. The central foveal thickness also was measured manually along an axial line through the foveal center between the vitreoretinal interface and the anterior boundary of the highly reflective line representing the retinal pigment epithelium. To account for interevaluator variations, 2 masked evaluators (K.K. and N.O.) independently measured the foveal shape parameters. If these results were judged by a group review (K.K., M.N., and N.O.) to be accurate, the results of 1 evaluator (N.O.) were used in the analysis. If the measurements of the evaluator were judged by the group review to be inaccurate, the results of another evaluator (K.K.) were used. If the measurements of both evaluators were judged to be inaccurate, the review group decided on corrections, and the corrected results were used.
Statistical Analyses
The statistical significance of differences of the categorical data between groups was evaluated by chi-square tests. The age, axial length, regional macular thickness, foveal depression, and relative foveal depression were compared using analyses of variance with Fisher post hoc tests. The Cohen κ coefficient was calculated to estimate interobserver agreement for classification of the vitreoretinal interface. Interclass correlation coefficients were calculated to estimate interobserver reliability of manual measurements of the central foveal thickness, foveal pit depth, and foveal pit diameter. Multivariate regression analyses were used to determine whether significant associations were present between the foveal parameters and the clinical findings. A P value less than .05 was accepted as statistically significant. Statistical analyses of the data were carried out with the Statview software version 5.0 (SAS Institute, Inc, Cary, North Carolina, USA).
Results
Foveal Thickness and Appearance of Vitreofoveal Interface
Eight hundred forty-nine eyes of 849 patients (300 men and 549 women) initially were enrolled. Among these, 301 (35.4%) eyes were diagnosed with MH, 199 (23.4%) were diagnosed with ERM, and 152 (17.9%) were diagnosed with RVO. We also studied 197 healthy eyes of 197 (23.2%) healthy volunteers. Interobserver agreements to classify the vitreofoveal interfaces of these eyes into the 7 types was almost perfect (Cohen κ coefficient, 0.968). There was no disagreement between observers for the eyes classified as having a flat foveal contour. Eyes with vitreofoveal traction and with photoreceptor dehiscence types were found only in the MH group. The other types of vitreoretinal interfaces were found in all 4 groups, but the incidence of vitreofoveal adhesion, irregular foveal floor, and flat foveal floor was significantly higher in the MH group than the other groups ( P = .015, P < .0001).
The average foveal thickness (central subfield) differed significantly among the 7 types of vitreofoveal interfaces ( P < .0001, analysis of variance; Table 1 ). The average foveal thickness in eyes with the vitreofoveal adhesion type was significantly thinner than that of the normal appearance type in eyes without a macular or complete PVD ( P = .015). The average foveal thickness of the irregular and flat types was significantly thinner than that of the normal contour types with or without a macular or complete PVD ( P = .0007 and P < .0001, respectively). The average foveal thickness of the normal appearance types with or without a macular or complete PVD was not statistically different ( P = .19).
| Status of Vitreofoveal Interface | MH (n = 301) | ERM (n = 199) | RVO (n = 152) | Healthy (n = 197) | Central Subfield Thickness (μm) |
|---|---|---|---|---|---|
| Without a macular or complete PVD | |||||
| Vitreofoveal adhesion (n = 46) | 30 (10.0%) | 8 (4.0%) | 3 (2.0%) | 5 (2.5%) | 244 ± 21.7 a |
| Vitreofoveal traction (n = 27) | 27 (9.0%) b | 0 | 0 | 0 | 245 ± 21.4 |
| Normal (n = 275) | 64 (21.3%) | 55 (27.6%) | 63 (41.4%) | 93 (47.2%) | 252 ± 20.8 |
| With a macular or complete PVD | |||||
| Photoreceptor dehiscence (n = 4) | 4 (1.3%) | 0 | 0 | 0 | 267 ± 13.4 |
| Irregular (n = 50) | 40 (13.3%) | 7 (3.5%) | 1 (0.7%) | 2 (1.0%) | 239 ± 19.5 c |
| Flat (n = 56) | 40 (13.3%) | 9 (4.5%) | 3 (2.0%) | 4 (2.0%) | 223 ± 15.8 d |
| Normal (n = 391) | 96 (31.9%) | 120 (60.3%) | 82 (53.9%) | 93 (47.2%) | 250 ± 23.0 |
| Central subfield thickness (μm) | 240 ± 20.9 e | 252 ± 24.8 | 251 ± 20.9 | 253 ± 21.5 | |
a P < .05 compared with eyes with normal appearance without PVD and photoreceptor dehiscence with PVD.
b Six eyes showed foveal floor elevation with 271 ± 13.8 μm in central thickness.
c P < .05 compared with eyes with normal appearance with and without PVD and photoreceptor dehiscence with PVD.
d P < .05 compared with all the other status of vitreofoveal interface.
To exclude the effects of these vitreoretinal interface abnormalities and foveal deformations, we excluded eyes with vitreofoveal adhesion, vitreofoveal traction, photoreceptor dehiscence, and irregular or flat foveal contour from further analysis. The final number of subjects included 160 eyes with MH, 175 with ERM, 145 with RVO, and 186 healthy eyes.
The demographics of the 4 groups are shown in Table 2 . No significant differences were found in the sex distribution, age, axial length, or refractive error among the 4 groups.
| ERM (n = 175) | MH (n = 160) | RVO (n = 145) | Healthy (n = 186) | P Value | |
|---|---|---|---|---|---|
| Female sex | 113 (64.6) | 106 (66.3) | 84 (57.9) | 119 (64.0) | |
| Male sex | 62 (35.4) | 54 (33.7) | 61 (42.1) | 67 (36.0) | .46 a |
| Age (y) | 67.6 ± 8.1 | 67.0 ± 8.7 | 66.8 ± 10.5 | 67.4 ± 10.7 | .86 b |
| Axial length (mm) | 23.7 ± 1.3 | 23.7 ± 1.5 | 23.5 ± 1.1 | 23.5 ± 1.3 | .62 b |
| Refraction (diopters) | −0.50 ± 2.65 | −0.65 ± 3.12 | −0.30 ± 2.10 | −0.54 ± 2.58 | .77 b |
b Analysis of variance with post hoc comparisons by the Fisher procedure.
Regional Average Macular Thickness and Foveal Shape Parameters in 4 Groups
The regional macular thicknesses and foveal morphologic parameters in each group are summarized in Table 3 . The interclass correlation coefficients for the manual measurements of the central foveal thickness, foveal pit depth, and foveal pit diameter were 0.956, 0.990, and 0.984, respectively. These findings indicate excellent reliability for the manual measurement of the 3 foveal shape parameters. Both the central and average foveal thicknesses were significantly thinner in the MH group than in the other groups. No significant differences were found in the average or central foveal thickness among the ERM, RVO, and healthy groups. Only the patients with unilateral MH included the fellow eyes (3 eyes; 1.9%) that had an average foveal thickness of less than 200 μm and 5 (3.1%) patients with unilateral MH and 2 (1.1%) healthy subjects had fellow eyes with a central foveal thickness of less than 150 μm. The superior, temporal, and nasal quadrants of the inner rings were significantly thicker in the ERM group than in the other groups. There were no statistical differences in the outer retinal thicknesses among the 4 groups.
| ERM (n = 175) | MH (n = 160) | RVO (n = 145) | Healthy (n = 186) | P Value a | |
|---|---|---|---|---|---|
| Central foveal thickness | 203 ± 22.3 (154 to 280) | 192 ± 22.4 b (129 to 277) | 202 ± 16.9 (156 to 247) | 201 ± 20.1 (134 to 271) | <.0001 |
| Foveal thickness (1 mm) | 254 ± 23.5 (203 to 341) | 243 ± 20.7 b (191 to 302) | 251 ± 21.1 (213 to 317) | 254 ± 21.2 (204 to 321) | <.0001 |
| Superior inner macula | 325 ± 16.5 c | 320 ± 17.9 | 320 ± 17.3 | 321 ± 17.6 | .032 |
| Temporal inner macula | 313 ± 14.8 d | 308 ± 16.2 | 310 ± 15.6 | 309 ± 16.7 | .029 |
| Inferior inner macula | 320 ± 17.2 | 316 ± 16.3 | 318 ± 17.2 | 317 ± 16.9 | .13 |
| Nasal inner macula | 329 ± 16.9 c | 323 ± 16.8 | 323 ± 17.6 | 324 ± 16.6 | .0020 |
| Average inner macula | 322 ± 15.2 c | 317 ± 15.8 | 318 ± 15.7 | 318 ± 16.0 | .017 |
| Superior outer macula | 279 ± 15.6 | 277 ± 16.8 | 279 ± 17.7 | 276 ± 15.6 | .34 |
| Temporal outer macula | 262 ± 13.1 | 260 ± 14.9 | 263 ± 13.1 | 261 ± 13.8 | .26 |
| Inferior outer macula | 266 ± 13.8 | 265 ± 16.4 | 267 ± 14.9 | 266 ± 16.6 | .77 |
| Nasal outer macula | 296 ± 16.8 | 294 ± 16.4 | 296 ± 16.3 | 295 ± 15.0 | .71 |
| Average outer macula | 276 ± 12.9 | 274 ± 14.7 | 276 ± 13.9 | 275 ± 13.6 | .54 |
| Foveal pit depth | 146 ± 29.2 (60 to 235) | 150 ± 30.7 (71 to 251) | 145 ± 25.3 (88 to 210) | 142 ± 30.5 (54 to 225) | .18 |
| Foveal pit diameter | 2421 ± 283.6 (1474 to 3010) | 2400 ± 310.6 (1492 to 3065) | 2466 ± 305.8 (1698 to 3109) | 2440 ± 262.9 (1652 to 3166) | .35 |
| Pit depth/pit diameter | 0.061 ± 0.011 (0.029 to 0.093) | 0.063 ± 0.012 e (0.029 to 0.099) | 0.059 ± 0.010 (0.035 to 0.086) | 0.058 ± 0.012 (0.029 to 0.096) | .0097 |
a Analysis of variance with post hoc comparisons by the Fisher procedure.
b P < .05 compared with ERM, RVO, and healthy groups.
c P < .05 compared with MH, RVO, and healthy groups.
d P < .05 compared with MH and healthy groups.
Stay updated, free articles. Join our Telegram channel

Full access? Get Clinical Tree


