Evaluation of Visual Function
Chris A. Johnson
Light constitutes a small portion of the electromagnetic spectrum between 400 and 700 nm, is emitted by natural and artificial sources, and is reflected by objects in our environment. While the simplest eyes in nature function as basic light detectors, the human visual system has evolved into a complex mechanism for processing visual information. Light entering the eye is refracted by the optical media to form an inverted image on the retina. Photoreceptors convert light energy into electrical signals that are processed by neural elements in the retina, optic nerve, and higher visual centers. This processing is accomplished by neural mechanisms that are responsible for encoding motion, form, color, depth, and other properties of the visual image.1,2,3,4,5,6 The relationship between the physical properties of light and the behavioral responses of the observer is known as visual psychophysics, the foundation for the clinical assessment of visual function.
Excellent reviews of color vision and binocular vision are available elsewhere in these volumes. This chapter is limited to a discussion of three other aspects of visual function that are important for clinical ophthalmic evaluation: visual acuity, contrast sensitivity, and visual field sensitivity. These visual functions have a long history and form an important part of the evaluation of patients with ocular disorders. Early detection of eye disease, differential diagnosis of ocular and neurologic disorders, and monitoring the efficacy of therapeutic regimens are just several of the roles that these visual function tests serve in a clinical setting.
Visual Acuity
Visual acuity is a common visual function measured in the clinic. It evaluates the processes subserving the fovea, because good visual acuity requires that both optical and neural components are functioning properly.7 Visual acuity is used to prescribe refractive corrections and is also important for conducting “real-world” tasks such as reading,8,9 face recognition,10 driving,11 and activities involving spatial discriminations.12,13,14,15 Visual acuity is specified in terms of the visual angle subtended by fine spatial detail and determined by its physical size and distance from the observer. For small angles, the visual angle can be approximated by arc tan (object size/object distance).
Detection acuity refers to the smallest stimulus that can be distinguished from a uniform field. The minimum angle of detection (MAD) is limited by stimulus contrast. Thibos and Bradley16 have demonstrated that optical components impose the primary limiting factor on detection acuity by means of contrast attenuation for small stimuli. Resolution acuity refers to the smallest spatial detail needed to allow one pattern to be distinguished from another. Typically, this type of acuity is measured with a grating of alternating light and dark stripes, and the observer’s task is to determine the orientation of the grating. Resolution acuity is specified in terms of the minimum angle of resolution (MAR) and is also limited by contrast. For normal human foveal vision, resolution acuity is constrained by properties of the photoreceptor mosaic and underlying neural mechanisms.16 Identification acuity refers to the smallest spatial detail needed to allow recognition of objects such as letters. It is this type of acuity measurement that is obtained in a clinical setting. Specification of identification acuity is usually in terms of the MAR, or values such as Snellen notation, which is based on MAR and corresponds to the angle subtended by the thickness of a letter. For most visual acuity charts, the size of the letter is five times greater than its thickness. An example of a typical eye chart for visual acuity is shown in Figure 1. This design is basically the same as that originally introduced by Snellen in 1862,17 and the most common form of reporting visual acuity is still in terms of “Snellen notation.” This value consists of a fraction in which the numerator is the testing distance (usually 20 ft or 6 m), and the denominator is the distance at which a “normal” observer would be able to read the letter. Visual acuity charts use a reference of 1 minute of arc visual angle for the smallest resolvable detail (MAR) for a “normal” observer, corresponding to a Snellen fraction of 20/20 (or 6/6). Similarly, a 20/40 (6/12) letter would be 10 minutes of arc high and have a thickness of 2 minutes of arc. Note that the 20/20 reference for “normal” vision was developed more than 100 years ago. With today’s high-contrast eye charts and better lighting sources, most normal individuals under 50 years of age can be corrected to better than 20/20. For new acuity tests, new specifications and scoring systems have been developed.18,19
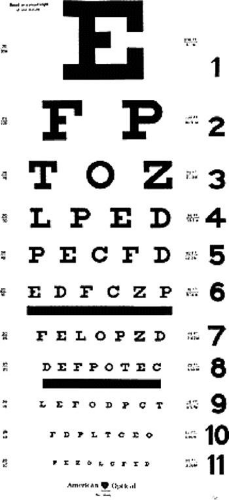 Figure 1. An example of a typical Snellen-type eye chart for clinical measurement of visual acuity. |
New visual acuity charts have recently emerged.20,21,22 An example (the Bailey-Lovie chart) is presented in Figure 2. This improved design has several advantages. First, the letters are of approximately equal detectability. Second, each line has an equal number of letters. Third, the spacing between letters is proportional to the letter size. Finally, the change in visual acuity from one line to another is in equal logarithmic steps. This new eye chart allows better specification of visual acuity in terms of Snellen notation, MAR, or log MAR values. In addition, new methods of scoring responses to this type of visual acuity chart can provide greater sensitivity and reliability of the measure.18,23,24 The Early Treatment Diabetic Retinopathy Study (ETDRS) visual acuity chart, based on the design of the Bailey-Lovie chart, has now been used in several multicenter clinical trials.25,26,27,28,29,30 The SKILL chart is a low-contrast, low-luminance visual acuity test that was developed to detect early spatial vision losses and changes in spatial vision.22
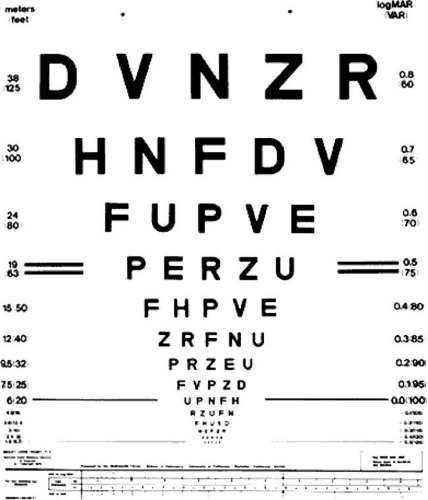 Figure 2. An example of the Bailey-Lovie chart, incorporating an equal number of letters per line, letters of approximately equal legibility, proportional spacing between letters, and a logarithmic change in letter size from one line to another. |
A number of stimulus parameters affect visual acuity measurements, including background adaptation luminance,31,32,33 contrast,33,34 refractive error,35,36,37 pupil size,38,39 retinal eccentricity,40,41,42 duration of presentation,43,44,45 the type of stimulus,46,47,48 and interaction from adjacent visual contours or “crowding.”49,50,51 In patient populations, crowding, luminance, contrast, and stimulus type can sometimes have an greater influence on visual acuity measurements than for normal individuals. In some instances, this can be useful for diagnostic purposes. However, the unintentional variation of background luminance or other test parameters can be problematic for monitoring the visual status of patients.
The measurement of visual acuity in special populations (e.g., young children and handicapped individuals) is not always possible with a letter chart. For these populations, “preferential looking” techniques, oculomotor responses such as optokinetic nystagmus, and electrophysiologic measures such as the visual evoked potential can be used to estimate visual acuity.52,53,54,55 In addition, a number of new eye charts and behavioral test procedures have been developed to assess visual acuity in nonverbal or handicapped individuals.56 These tests use patterned stimuli and caricatures of faces or common objects with “critical detail” to obtain an indication of the individual’s level of visual acuity. Haegerstrom-Portnoy56 has provided an excellent review of many of these procedures.
Contrast Sensitivity
Visual acuity does not specify the visual system’s ability to detect and discriminate objects of different size and contrast. This is usually accomplished by contrast sensitivity measures using gratings, alternating patterns of light and dark bars whose luminance varies sinusoidally perpendicular to the grating’s orientation, as shown in Figure 3.
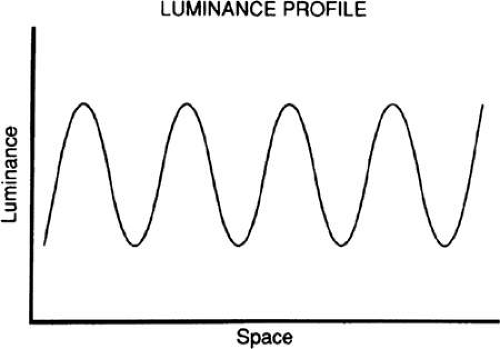 Figure 3. Graphical representation of the luminance profile of a sinusoidal grating stimulus. |
A sinusoidal grating is an alternating series of light and dark lines, the size of which is specified according to spatial frequency or the number of cycles (pairs of light and dark bars) per degree of visual angle. Typically, the range of spatial frequencies examined is between 0.5 and 30.0 cycles per degree, and contrast is determined by the luminance of the peaks (Lmax) and troughs (Lmin) of the luminance profile:
Contrast varies from 0 for a uniform field (i.e., Lmax and Lmin are equal) to 1 (where Lmin is equal to zero). The contrast threshold is the minimum contrast needed to detect the grating. Contrast properties are typically reported as contrast sensitivity, the reciprocal of the contrast threshold (sensitivity = 1/threshold). The human visual system varies in the amount of contrast needed to detect a grating pattern for different spatial frequencies. Figure 4 presents a sinusoidal distribution of light and dark bars in which spatial frequency varies logarithmically along the abscissa and contrast varies logarithmically along the ordinate. Intermediate spatial frequencies (medium-sized bars) are visible at lower contrast levels than are low spatial frequencies (wide bars) and high spatial frequencies (narrow bars), giving an inverted U-shaped appearance.
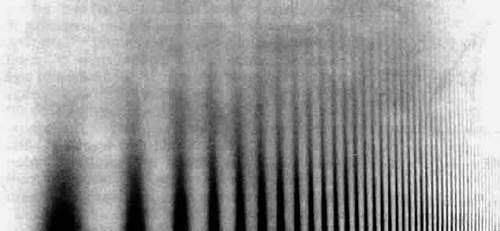 Figure 4. Illustration of contrast characteristics of human visual system for sinusoidal gratings. Contrast varies logarithmically along the ordinate, and spatial frequency varies logarithmically along the abscissa. |
The use of sinusoidal gratings to evaluate spatial contrast sensitivity has several advantages. First, optical defocus does not change the appearance of the grating, other than to reduce its contrast. Second, the contrast sensitivity function characterizes the response properties of the visual system to a wide variety of complex images. The contrast sensitivity function for vision has been compared with the audiogram for characterizing hearing ability.57 The audiogram specifies the minimum amount of sound energy necessary to detect pure tones for various pitch frequencies. This information is used to determine the ability to hear sounds consisting of compound waveforms. Similarly, the spatial contrast sensitivity function for vision makes it possible to determine an individual’s ability to observe complex visual scenes.
Fourier analysis indicates that a complex waveform can be decomposed into a series of sine waves of various frequencies, amplitudes, and phases (positions).58 Once the contrast response characteristics of the human visual system are known, it is possible to determine how complex visual scenes are processed by the visual system. Note that the contrast sensitivity function describes the visual system at threshold contrast levels, which is not representative of the visual system’s characteristics for processing suprathreshold contrast information.59,60,61
A normal contrast sensitivity function for the human visual system is presented in Figure 5. Contrast sensitivity is greatest for a spatial frequency of four to five cycles per degree, with reductions in contrast sensitivity for higher and lower spatial frequencies. This inverted U-shaped function reflects the broad bandpass characteristic of the human visual system’s contrast response. This shape has been reported to represent an envelope of the response characteristics of multiple quasi-independent channels with narrower bandpass response characteristics,62 as illustrated in Figure 6. Neurophysiologic studies support the concept that the visual system may use a form of spatial frequency analysis in the processing of visual information.63,64,65
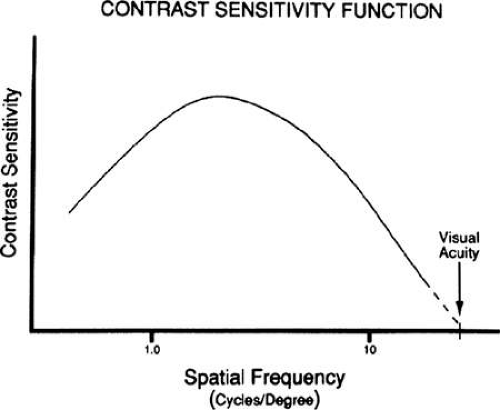 Figure 5. Typical spatial contrast sensitivity function for normal human foveal vision. |
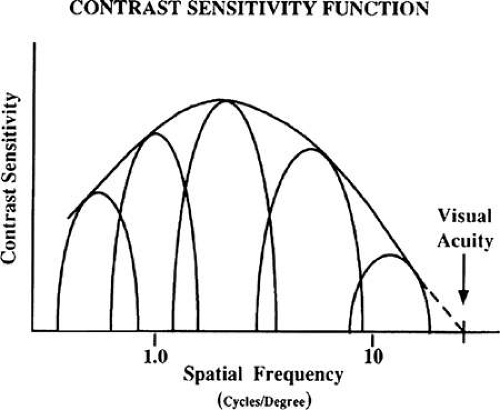 Figure 6. Typical spatial contrast sensitivity function and underlying narrow-bandwidth channels. |
The envelope of the composite sensitivity of the narrow-bandwidth channels is felt to be the underlying basis of the contrast sensitivity function.
The use of sinusoidal gratings to study human vision was introduced by Schade in 1956,66 followed by a series of important investigations that established the theoretical and empirical basis for the contrast sensitivity function.67,68,69,70,71 These studies defined the optical and neural components underlying the normal contrast sensitivity function. The normal contrast sensitivity function is affected by background adaptation luminance 71,72,73; stimulus field size74,75,76; retinal eccentricity77,78,79,80; pupil size 39,67; temporal characteristics72,81,82; stimulus orientation83,84;and various optical factors such as defocus, dioptric blur, diffusive blur, and astigmatism.16,48,67,85,86
The contrast sensitivity function has been used to evaluate optical properties of the human eye, including refractive error and defocus,16,48,67,85,86 corneal diseases,87,88,89,90,91,92,93,94,95 cataracts,96,97,98,99,100,101,102,103 refractive surgery,104,105,106 intraocular lenses,107,108,109 and normal aging properties of the optics of the eye.99,100,110,111,112,113,114 In many instances, contrast sensitivity deficits have been reported for patients with normal visual acuity and optical conditions that produce subtle changes in the quality of their vision. A number of retinal disorders have also been evaluated with the contrast sensitivity function, including diabetic retinopathy,115,116,117,118 age-related macular degeneration,119,120,121,122 and other anomalies.123,124,125,126 Several investigators have also reported foveal contrast sensitivity deficits in patients with glaucoma.127,128,129,130,131,132,133 Additionally, measurement of the contrast sensitivity function has also been reported to be effective in revealing subtle visual losses in optic neuritis and multiple sclerosis,25,134,135,136,137 other optic neuropathies and cerebral abnormalities,134,138,139,140,141,142 amblyopia,143 Alzheimer’s disease,112,144 Parkinson’s disease,134 and cystic fibrosis.145
The contrast sensitivity function can be measured in infants and young children with use of either electrophysiologic or behavioral techniques to determine their functional visual status.114,146,147,148,149,150,151 As these techniques become more refined and easier to use, they are increasingly being incorporated into clinical settings.
There is also evidence that the contrast sensitivity function may predict the performance of various real-world tasks, such as those involving the identification of aircraft152 or tanks,153 recognition of highway signs,154 reading ability,155,156,157 face recognition,158,159 and mobility skills of patients with subnormal vision.160 The contrast sensitivity function is useful for revealing subtle visual deficits associated with ocular disorders and for identifying problems encountered during daily activities.
Recently, there have been several new approaches to the evaluation of contrast sensitivity by using charts in a manner similar to measurement of visual acuity.161 The Vistech chart is shown in Figure 7.162 This chart has a series of five rows (A through E), each with a different spatial frequency. Each row consists of a group of nine circular targets containing a sinusoidal grating that is either vertical, tilted to the left, or tilted to the right. From the left side of the chart to the right, there is a successive reduction in the contrast of the grating. Patients are positioned at the 10-ft viewing distance and are asked to “read” each row from left to right and indicate the orientation of the grating.
Stay updated, free articles. Join our Telegram channel

Full access? Get Clinical Tree


