Purpose
To evaluate the choroidal thickness by high-penetration optical coherence tomography (OCT) using long wavelength in highly myopic normal-tension glaucoma (NTG).
Design
Cross-sectional retrospective study.
Methods
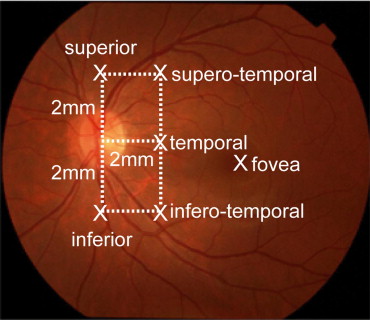
settings: Institutional. participants: Twelve eyes from 8 patients under 45 years old, diagnosed as NTG without any other ocular diseases, spherical equivalent refractive error between −6 and −12 diopters, and axial length greater than 26.5 mm; and 12 eyes of matched healthy volunteers. intervention: Choroid was imaged with prototype high-penetration OCT and its thickness was measured. main outcome measures: Choroidal thickness at the fovea and 5 locations: 2 mm superior, temporal, and inferior to the center of the optic nerve head, and 2 mm superior (superotemporal) and 2 mm inferior (inferotemporal) to the temporal location.
Results
Overall, the choroidal thickness in the NTG group was approximately 50% that in controls. Mean choroidal thickness in the NTG group was significantly thinner in the control group at the fovea (166 vs 276 μm, P < .001), superior (172 vs 241 μm, P < 0.05), superotemporal (161 vs 244 μm, P < .01), temporal (110 vs 161 μm, P < .01), and inferotemporal (115 vs 159 μm, P < .05) to the optic nerve head. Stepwise analysis disclosed that the foveal choroidal thickness is the most influential factor on the occurrence of NTG ( P < .0001, R 2 = 0.4).
Conclusions
Choroidal thickness in highly myopic NTG is significantly thinner than in controls, at least in some specific locations. Choroidal thinning is somehow related with highly myopic NTG and may be a useful diagnostic parameter for myopic NTG.
It is well known that normal-tension glaucoma (NTG) is augmented by typical glaucomatous optic neuropathy within the range of normal intraocular pressure (IOP). Myopia is one of the high-risk factors for development of NTG, and patients with highly myopic glaucoma sometimes have greater progression of visual field loss and severe loss of central visual function despite an IOP in the normal range. Therefore, myopic NTG is vision-threatening, whereas its pathogenesis is poorly understood.
Several studies have reported that blood flow disruptions, including low blood pressure, nocturnal hypotension, and fluctuation of the mean ocular perfusion pressure, are possible reasons for progression of NTG. Sung and associates reported that fluctuation of the 24-hour mean ocular perfusion pressure was the most consistent prognostic factor for NTG. Duijm and associates reported that choroidal circulation in NTG is slower than in control subjects. Previous histologic studies suggested that the choroidal thickness in glaucoma was significantly thinner than in normal subjects.
Recently, the results of several morphologic studies conducted in living human glaucomatous eyes using new noninvasive imaging techniques have been reported. A confocal scanning laser ophthalmoscope (Heidelberg Retina Tomograph [HRT], Heidelberg Engineering, Dossenheim, Germany) provides quantitative measurements of various parameters to evaluate the shape of the optic disc on 3-dimensional topographic images. In a population-based, cross-sectional study, the sensitivity of the HRT II glaucoma classification program, version 3.0, was poor, whereas the specificity was satisfactory. GDx scanning laser polarimetry (Carl Zeiss Meditec, Inc, Dublin, California, USA) allows evaluation of the retinal nerve fiber layer in glaucomatous eyes. Optical coherence tomography (OCT) is also a noninvasive technique that provides high-resolution, cross-sectional retinal images. Spectral-domain OCT, the newest commercially available OCT model, provides differentiation of the retinal layers correlated with histology and allows evaluation of the optic disc and the retinal nerve fiber layer morphology with high reproducibility. RTVue-100 (Optovue Inc, Fremont, California, USA) facilitates evaluation of the macular ganglion cell complex.
As reported previously, the choroid is thought to be a target in the pathogenesis of glaucoma; however, in vivo choroidal imaging was unsatisfactory because of difficulties in visualizing the choroid with conventional OCT technologies using the 840-nm wavelength as a light source due to high scattering and consequent choroidal signal attenuation at the retinal pigment epithelium (RPE). The use of a long wavelength such as the 1-μm band allows penetration of the signal through the RPE and Bruch membrane, enabling visualization of the deep ocular tissues such as the choroid or even the sclera. To evaluate the choroid in living human eyes, we used a prototype high-penetration OCT instrument. High-penetration OCT using a 1060-nm light source allowed us to clearly measure the choroidal thickness. This new technology has shown that the choroidal thickness is affected by age, refractive error, and axial length. Unlike the histologic studies, high-penetration OCT technology enables in vivo evaluation of the choroidal morphologic abnormalities.
In the current study, we focused on morphologic changes in the choroid in highly myopic NTG. The choroidal thicknesses around the optic disc and fovea in patients with highly myopic NTG were measured and compared with those in myopic volunteers without glaucoma.
Methods
Patients
Twelve consecutive eyes of 8 patients younger than 45 years of age and diagnosed with NTG who met the following criteria in the glaucoma clinic and high myopia clinic of Osaka University Hospital were enrolled. The inclusion criteria were IOP below 21 mm Hg, spherical equivalent refractive error between −6 and −12 diopters (D) to exclude extremely high myopia, and axial length exceeding 26.5 mm. The exclusion criteria included macular abnormalities such as choroidal neovascularization or whitish myopic atrophy; systemic abnormalities such as vascular disease, hypertension, or diabetes mellitus; and a history of intraocular surgery. Three glaucoma specialists (S.U., A.M., and K.M.) independently evaluated the stereo-color fundus photographs and automated visual field analyzer to differentiate glaucomatous from normal eyes. Data also were collected from the normal healthy volunteer database in high-penetration OCT. Normal myopic volunteers without glaucoma were selected randomly from this database with matching of age, refractive error, and axial length.
Examination
A technician masked to the clinical diagnosis of the patient performed all examinations of all patients that included measurement of the spherical equivalent refractive error, axial length, central corneal thickness, and corneal refraction and evaluation with the Humphrey visual field analyzer. The spherical equivalent refractive error and corneal refraction were measured by autorefractometry (ARK-700A; Nidek, Gamagori, Japan). The axial length was measured by partial optical coherence inferometry (IOLMaster; Carl Zeiss Meditec, La Jolla, California, USA). The central corneal thickness was measured by specular microscopy (AP3000P; Topcon, Tokyo, Japan). The visual field examination was performed with Humphrey automated perimetry with the 30–2 program (Carl Zeiss Meditec). The mean deviation and pattern standard deviation values were obtained from the software in the visual field analyzer.
High-Penetration Optical Coherence Tomography and Measurement of Choroidal Morphologic Parameters
The detailed profile of our prototype high-penetration OCT was described previously. This OCT is a swept-source instrument with a scan speed of 50 000 A-scans/second. A 6 × 6-mm retinal region was scanned by a horizontal fast raster protocol, and the A-scan density was 512 lines (horizontal) × 255 lines (vertical). The scan time was 2.7 seconds. The center wavelength of the probe beam was 1060 nm, and bandwidth was ≥80 nm. The axial resolution was 11 μm in tissue. This long-wavelength probe enables deep penetration to the choroid.
The choroidal thicknesses were measured from the images obtained by high-penetration OCT at the fovea and 5 locations (2 mm superior, temporal, and inferior to the center of the optic nerve head and 2 mm superior [superotemporally] and 2 mm inferior [inferotemporally] to the temporal location; Figure 1 ) . The choroidal thickness was measured according to the method previously described. The choroidal thickness was defined as the distance between the hyper-scattering line of the RPE and that of the chorioscleral interface. The RPE and chorioscleral interface were clearly identified in all cases.
Statistical Analysis
The data were analyzed using the unpaired t test and multiple stepwise regression analysis (JMP statistical software package, version 8.0; SAS Institute Inc, Cary, North Carolina, USA). The receiver operating characteristic (ROC) curve was drawn using JMP software. The cut-off value was calculated from this curve. In any analysis, P < .05 was considered to be statistically significant.
Results
Patient Demographic Data
The patient demographic data are shown in Table 1 . The mean age, spherical equivalent refractive error, axial length, central corneal thickness, and corneal refraction were similar between the highly myopic NTG and myopic volunteers without glaucoma groups.
| Parameter | Highly Myopic NTG (mean ± SD) | Control (mean ± SD) | P Value a |
|---|---|---|---|
| N (eyes) | 12 | 12 | |
| Age (years) | 33.6 ± 6.4 | 31.2 ± 4.1 | .33 |
| Sex (male/female) | 8/4 | 3/9 | .10 b |
| Spherical equivalent refractive error (diopters) | −9.3 ± 1.2 | −8.8 ± 1.6 | .34 |
| Axial length (mm) | 27.6 ± 0.5 | 27.2 ± 0.5 | .08 |
| Central corneal thickness (mm) | 0.48 ± 0.04 | 0.49 ± 0.01 | .36 |
| Corneal refraction (diopters) | 43.9 ± 0.56 | 43.7 ± 0.92 | .55 |
The glaucoma parameters also were compared between the groups ( Table 2 ). The average mean deviation value was significantly lower ( P < .05) and the pattern standard deviation value was significantly higher ( P < .001) in the highly myopic NTG group. The IOP did not differ significantly between the 2 groups ( P = .63).
| Parameter | Highly Myopic NTG (mean ± SD) | Control (mean ± SD) | P Value a |
|---|---|---|---|
| MD (db) | −4.2 ± 3.7 | −1.2 ± 0.9 | <.05 |
| PSD (db) | 5.8 ± 3.8 | 1.5 ± 0.2 | <.001 |
| IOP (mm Hg) | 13.7 ± 2.6 | 14.2 ± 2.4 | .63 |
Choroidal Thickness
Figure 2 shows representative choroidal images in the myopic NTG group (Left) and myopic volunteers without glaucoma group (Right) with similar refractive errors and axial lengths. The choroidal thickness in the eyes with myopic NTG was thinner at the fovea and temporal to the optic disc than in the myopic eyes without glaucoma.
Table 3 shows the mean choroidal thickness at the fovea and 2 mm superior, 2 mm temporal, and 2 mm inferior to the optic disc and 2 mm superior (superotemporally) and 2 mm inferior (inferotemporally) to the temporal location in the highly myopic NTG and myopic volunteers without glaucoma groups measured by high-penetration OCT. The mean choroidal thickness in the NTG group was significantly thinner at the superior ( P < .05), superotemporal ( P < .01), temporal ( P < .01), and inferotemporal ( P < .05) locations around the optic disc and at the fovea ( P < .001) compared with the myopic volunteers without glaucoma group.
| Choroidal Thickness (μm) | ||||
|---|---|---|---|---|
| Location | Highly Myopic NTG (Mean ± SD) | Control (Mean ± SD) | P Value a | ROC Curve Area |
| Fovea | 166.7 ± 40.9 | 276.1 ± 74.1 | <.001 | .88 |
| Disc | ||||
| Superior | 172.3 ± 77.7 | 241.5 ± 62.0 | <.05 | .82 |
| Superotemporal | 161.1 ± 71.9 | 244.8 ± 61.0 | <.01 | .83 |
| Temporal | 110.9 ± 40.1 | 161.5 ± 45.0 | <.01 | .8 |
| Inferotemporal | 115.4 ± 36.1 | 159.9 ± 41.0 | <.05 | .78 |
| Inferior | 123.4 ± 44.3 | 162.1 ± 47.6 | .051 | .74 |
Stay updated, free articles. Join our Telegram channel

Full access? Get Clinical Tree


