Epidemiology of Ocular Infections
Kirk R. Wilhelmu
Epidemiology applies common sense to public health and clinical research. Ophthalmic epidemiologists evaluate the distribution, determinants, and outcomes of eye diseases among different populations, at diverse locales, and over various times (Table 43.1). The goals of public health ophthalmology are to define disease pathways, to recognize vulnerable or high-risk groups, and to develop management and prevention programs that improve eye health.1,2,3,4
Table 1. Goals of epidemiology in infectious eye diseases. | ||
|---|---|---|
|
Blindness and Infection
Infectious diseases accounted for 80% of blindness in the pre antibiotic era. The first initiatives in blindness prevention sought to contain eye infections through sanitation and quarantine. The concept of antisepsis then emerged and led to with therapeutic and preventive interventions, such as the use of silver nitrate eyedrops in newborns. Neonatal prophylaxis was extraordinarily effective, and the proportion of blindness due to ophthalmia neonatorum dropped from 18% in 1902 to 5% in 1926. The percentage of blindness due to other infectious eye diseases declined with the development of antibiotics. After decreasing to 50% in the first quarter of the 20th century, infections now cause 10% to 20% of the world’s blindness.5,6,7
Nearly 10 million people are visually impaired as a result of infectious diseases (Table 43.2). Ocular infections remain a global concern to individuals and to communities, not only because of their blinding complications but also their socioeconomic effects.8 Ocular infections cost billions of dollars in lost productivity, but the burden of infection-related blindness is unevenly distributed (Table 43.3). Poor people who live and work in unhygienic conditions are at particular risk for infectious visual disability.9,10
Table 2. Ocular infections of global importance. | ||||||||||||||||||||||||||||||||||||||||||||||||||||||||||||||||||||||||||||||||||||||||||
|---|---|---|---|---|---|---|---|---|---|---|---|---|---|---|---|---|---|---|---|---|---|---|---|---|---|---|---|---|---|---|---|---|---|---|---|---|---|---|---|---|---|---|---|---|---|---|---|---|---|---|---|---|---|---|---|---|---|---|---|---|---|---|---|---|---|---|---|---|---|---|---|---|---|---|---|---|---|---|---|---|---|---|---|---|---|---|---|---|---|---|
| ||||||||||||||||||||||||||||||||||||||||||||||||||||||||||||||||||||||||||||||||||||||||||
Table 43.3. Role of ocular infection on global blindness. | |||||||||||||||||||||||||||||||||||||||||||||||||||||||||||||||||||||||||||||||||||||||||||||||||||||||||||||||||||||||||||||||||||||||||||||
|---|---|---|---|---|---|---|---|---|---|---|---|---|---|---|---|---|---|---|---|---|---|---|---|---|---|---|---|---|---|---|---|---|---|---|---|---|---|---|---|---|---|---|---|---|---|---|---|---|---|---|---|---|---|---|---|---|---|---|---|---|---|---|---|---|---|---|---|---|---|---|---|---|---|---|---|---|---|---|---|---|---|---|---|---|---|---|---|---|---|---|---|---|---|---|---|---|---|---|---|---|---|---|---|---|---|---|---|---|---|---|---|---|---|---|---|---|---|---|---|---|---|---|---|---|---|---|---|---|---|---|---|---|---|---|---|---|---|---|---|---|---|
| |||||||||||||||||||||||||||||||||||||||||||||||||||||||||||||||||||||||||||||||||||||||||||||||||||||||||||||||||||||||||||||||||||||||||||||
Economic development underlies the global distribution of infective visual loss (Table 43.4). Ocular infectious and inflammatory diseases account for 10% to 50% of the visually disabled in several developing nations but cause less than 5% of visual impairment in developed countries.11,12 In an economically advantaged society, where the prevalence of serious infectious eye disease is relatively low (Fig. 43.1), only 1 in 500 infected eyes results in visual loss.13
Table 43.4. Global distribution of blindness due to ocular infection, 1990. | |||||||||||||||||||||||||||||||||||||||||||||||||||||||
|---|---|---|---|---|---|---|---|---|---|---|---|---|---|---|---|---|---|---|---|---|---|---|---|---|---|---|---|---|---|---|---|---|---|---|---|---|---|---|---|---|---|---|---|---|---|---|---|---|---|---|---|---|---|---|---|
| |||||||||||||||||||||||||||||||||||||||||||||||||||||||
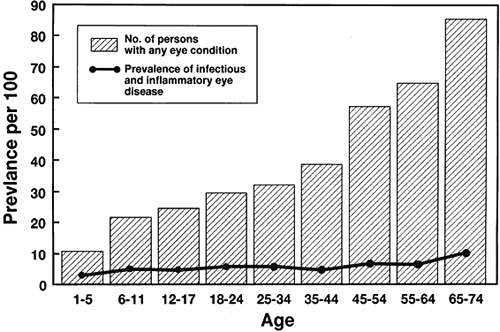 Figure 43.1. Age-specific prevalence of eye disease in the United States, 1971–1972. (Data used with permission from Ganley JP, Roberts J. Eye conditions and related need for medical care among persons 1–74 years of age: United States, 1971–72. Vital Health Stat Series 1983;(11)228:1.) |
The impact of infections on childhood blindness is also skewed toward underdeveloped regions. Of the estimated 1.5 million blind children in the world, about one-third are blinded by infection,14 mainly complications of childhood trachoma, neonatal conjunctivitis,15 and trauma. The effect of blindness-prevention programs would be substantial if eye infections could be reduced among poor children.16
Ocular Infections and Public Health Ophthalmology
Trachoma
Chlamydial eye disease has probably been endemic in Egypt and other ancient civilizations for centuries.17 Chlamydia trachomatis, transmitted by flies, fingers, and fomites, is prevalent where access to water is limited and facial cleanliness is poor. Trachoma belts used to extend around the world, and areas of hyperendemic trachoma still persist (Fig. 43.2). Trachoma affects over 300 million people, especially women and children living in deprived communities of Africa, Asia, Australia, the Middle East, and South America.18 Familial clustering may arise from shared exposures or genetic susceptibility.19 Trachoma may affect the majority of children in a hyperendemic area (Table 43.5), where 10% to 30% of children are reinfected each year.20 Nearly 6 million people with trachoma have low vision from residual corneal scarring. Trachomatous visual impairment accounts for an annual loss of 2 million disability-adjusted life-years, and results in lost economic productivity of $3 billion per year.21,22
Table 43.5. Prevalence of active childhood trachoma in rural populations, 1981–1991. | ||||||||||||||||||||||||||||||||||||||
|---|---|---|---|---|---|---|---|---|---|---|---|---|---|---|---|---|---|---|---|---|---|---|---|---|---|---|---|---|---|---|---|---|---|---|---|---|---|---|
| ||||||||||||||||||||||||||||||||||||||
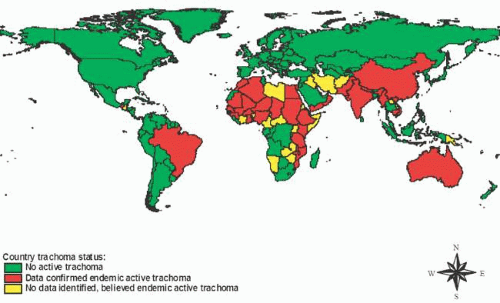 Figure 43.2. The global distribution of trachoma. (Reproduced with permission from Polack S, Brooker S, Kuper H et al. Mapping the global distribution of trachoma. Bull World Health Organ 2005;83:913.) |
Onchocerciasis
Onchocerciasis is an insect-borne infection endemic in rural parts of Africa and Latin America. People living near streams and watercourses where blackfly vectors breed are at risk of being infected, especially if they engage in river-bank activities such as fishing, farming, and washing. The endemicity of onchocerciasis in equatorial Africa is measured in decades during which infection and blindness lead to a cycle of human migration. Tribes settle in fertile valleys, remain until the level of river blindness reaches an unsustainable level, and then abandon villages to move to the hills. Later, the tribes relocate back to the rivers after several generations, thus continuing a pattern that may have gone on for centuries.23 Environmental and climatic changes play a role in the spread of onchocerciasis, although different strains of Onchocerca volvulus transmitted by different Simulium vectors may contribute to the prevalence and spectrum of ocular findings in diverse locales.24 Two million people have onchocercal visual loss. Onchocerciasis forfeits 500,000 disability-adjusted life-years each year and can consume 5% of an endemic country’s gross national product because of stagnant agricultural output.25
Hansen Disease (Leprosy)
Mycobacterium leprae infection follows contact with an infected individual or other source after an incubation period of about 3 years. An intemperate fear of contagion contributes to segregation and psychosocial stigma of people with Hansen disease. Still persisting in poor, crowded regions, its distribution is nonhomogenous, troubling some families more than others. Ocular disease affects about 10% of people with Hansen disease. Multibacillary leprosy occurs in Southeast Asia and South America and produces chronic uveitis. Paucibacillary leprosy predominates on the Indian subcontinent and in Africa, and is associated with exposure keratopathy and neurotrophic keratopathy. About 5% of leprosy patients are blind, totalling 250,000 people, largely from secondary cataract or corneal opacification.26
Ophthalmia Neonatorum
Ophthalmia neonatorum is conjunctivitis affecting infants younger than 1 month. In the mid-18th century, transmission via the infected birth canal was first suspected when it was recognized that the risk of ophthalmia neonatorum tripled if the mother had vaginal secretions.27 Before Credé introduced silver nitrate eye drops in the late 19th century, approximately 10% to 15% of newborns developed bacterial conjunctivitis. Up to a half of children in schools for the blind during the 19th century had corneal scarring from ophthalmia neonatorum.28
The current incidence varies by the availability of obstetric care (Table 43.6). Annual rates of gonococcal and chlamydial conjunctivitis per 1,000 live births are approximately 0.3 and 5, respectively, in the United States but are ten times greater in parts of Africa. The epidemiology of neonatal conjunctivitis corresponds to fluctuations in maternal sexually transmitted disease (Fig. 43.3). Each case of neonatal conjunctivitis represents a cluster of family members and associates with sexually transmitted disease.29 The risk of corneal complications from ophthalmia neonatorum is higher among the poor. Between 1,000 and 4,000 infants are blinded each year.28
Table 43.6. Ophthalmia neonatorum in selected regions. | ||||||||||||||||
|---|---|---|---|---|---|---|---|---|---|---|---|---|---|---|---|---|
|
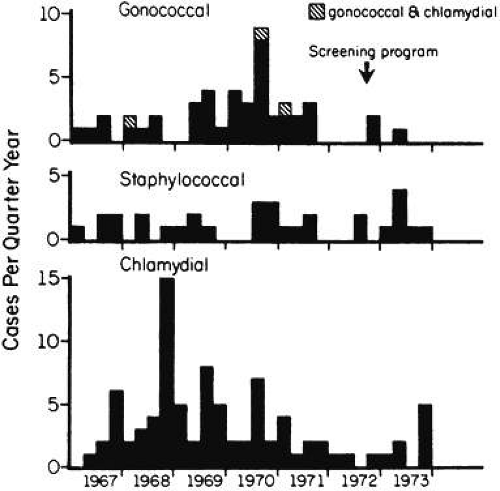 Figure 43.3. Bacterial conjunctivitis among neonates, showing seasonal fluctuation with peaks during third quarter of the year for gonococcal infection and during the fourth quarter for chlamydial infection, Atlanta, 1967–1973. Note the reduction in cases after the institution of prenatal screening of pregnant women for sexually transmitted disease. (Reproduced with permission from Armstrong JH, Zacarias F, Rein MF. Ophthalmia neonatorum: a chart review. Pediatrics 1976;57:884.) |
Microbial Keratitis and Ocular Injury
Fifty million eye injuries take place each year.30 In some regions, over 1% of the population sustains a corneal abrasion or wound.31 Although less than 5% of traumatized eyes become infected,31 globally two million new cases of trauma-related microbial keratitis occur annually.13 Compared to North America and Europe, agrarian regions have 10 times the incidence of posttraumatic microbial keratitis, where the poor are at greatest risk.32,33,34 Common bacterial causes include Streptococcus pneumoniae and Staphylococcus aureus, whereas agricultural accidents predispose to filamentous fungi such as Fusarium and Aspergillus species.35 The use of traditional medications may delay medical treatment or lead to secondary infection (36,37).36,37 Trauma with ensuing microbial keratitis accounts for 5% of blinding conditions and 50% of unilateral blindness.13,38
Stay updated, free articles. Join our Telegram channel

Full access? Get Clinical Tree


