Environmental Optics
Robert W. Massof
Nature of Light
Light is the name given to the part of the electromagnetic spectrum that stimulates the retina and gives rise to vision. Our modern theories about the nature of light have evolved from two contemporaneous theories in the late 17th century, the corpuscular theory of Newton and the longitudinal wave theory of Huygens. These theories were displaced more than 100 years later by the early 19th-century transverse wave theories of Young and Fresnel, and ultimately by the late 19th-century electromagnetic theory of Maxwell, which is widely used today. The wave theories postulated a dense ether through which light waves were propagated; Newton’s corpuscular theory required a rarified ether to explain refraction, diffraction, and birefringence. The Michelson-Morley experiment, which refuted the existence of an all-pervasive ether, and the Rayleigh-Jeans catastrophe, for which the observed spectrum of a blackbody radiator does not agree with the predicted spectrum, laid the groundwork for the paradigm shift to quantum theory in the early 20th century. Today, quantum electrodynamics describes light as probability waves of quantum pulses of electromagnetic oscillations, called photons.1
The energy content of a photon (e) is proportional to the photon’s electromagnetic frequency (ν), e = hν (where h = 6.626 × 10⁻³² Joules-sec/cycle is Planck’s constant and the units of ν are cycles/sec). Electromagnetic frequency can vary over a range of more than 20 orders of magnitude. We call the lowest electromagnetic frequencies radio and microwaves and the highest electromagnetic frequencies are called x-rays and cosmic rays. Conventionally, electromagnetic frequency is specified as a wavelength (distance between peaks), λ = c/ν (where c = 299,792.46 km/sec is the speed of light in a vacuum). Only a very narrow sliver of the spectrum, from about 380 nm to 800 nm, can stimulate the retina and give rise to vision. Electromagnetic frequencies neighboring visible light are called ultraviolet light on the high side (shorter wavelengths) and infrared light on the low side (longer wavelengths). Low electromagnetic frequencies, like microwaves, are explained by classical wave theory as being caused by low frequency vibrations of excited electrons. High electromagnetic frequencies, including light, are explained by quantum theory as being caused by high frequency electron vibrations accompanying discrete changes in electron energy states.
As made explicit by its name, electromagnetic radiation consists of oscillations of an electric field in one plane and simultaneous in-phase oscillations of a magnetic field in an orthogonal plane, both perpendicular to the direction of travel of the wave. Polarization of light refers to the distribution of orientations (i.e., roll about the axis of travel) and phase relationships of these electromagnetic planes in a cohort of photons that were emitted at the same instant. If the orientations are random, we say the light is unpolarized. If the orientations of all photons in the cohort are the same, or add up to superimposed electric field orientations 90° to each other with oscillations that are in phase, we say the light is plane polarized. The term plane polarization is used in the latter case because the amplitudes of in phase oscillations separated in orientation by 90o combine vectorially to produce oscillations that appear to occur only in a single plane. Distributions of electromagnetic plane orientations and phases that have different standard deviations describe different states of partial polarization (unpolarized light has a very large standard deviation, polarized light has a very small standard deviation).
If the orientations of all photons add up to superimposed orthogonal fields for which the phases of the electromagnetic waves at the two orientations differ by one-quarter of a wavelength (i.e., 90° phase difference), the orientation of the oscillations will appear to “corkscrew.” If the amplitudes of the oscillations at the two orientations are the same, the corkscrew motion viewed head-on (as seen from the receiver) will trace out a circle and the light is said to exhibit circular polarization. If the amplitudes of oscillation at the two orientations are not the same, or the phase difference is not 90°, the corkscrew motion viewed head-on will trace out an ellipse and the light is said to exhibit elliptical polarization. Depending on which orientation of oscillation leads in phase, the corkscrew can appear to rotate clockwise (left-handed rotation) or counter-clockwise (right-handed rotation). Thin film quarter-wave plates phase-shift oscillations in one of the orientation axes of plane polarized light by 90° to create circular polarization.
All effects of light, including knowledge of its existence, occur by way of the absorption of photons by atoms. The absorption of one photon raises the energy state of one electron (Stark-Einstein law). Ultimately the energy of the absorbed photon is transformed to a measurable change of state in the detector (e.g., chemical, thermal, or electrical). We cannot measure light directly, rather we measure surrogate variables that change when light is absorbed. Vision begins when a photon is absorbed by a molecule of visual pigment in a rod or cone photoreceptor cell in the retina. The energy from the absorbed light causes an isomerization of the vitamin A chromophore attached to an opsin protein from an 11-cis configuration to an all-trans configuration. The all-trans vitamin A acts as an agonist that activates the opsin protein. The activated opsin catalytically activates a cascade of G proteins that diffuse to the cell membrane and in turn activate phosphodiesterase, a cyclic nucleotide. The activated phosphodiesterase hydrolyzes cyclic GMP, which then closes ion channels in the photoreceptor membrane. With the closure of ion channels the photoreceptor hyperpolarizes.2 This hyperpolarization resulting from the Rube Goldberg-like visual transduction cascade is the first measurable neural signal in the visual pathway that is caused by the light absorption.
The energy transfer that occurs with the absorption of a photon is the basis for photochemistry. Besides photoisomerizations, the absorption of light also is responsible for photo-redox reactions, which make film-based photography possible; photoionization, which is used to monitor environmental toxins; photolysis, which underlies the dissociation step in photosynthesis; and at high enough power levels, breaking covalent bonds, which makes photoablation possible.
Thermal, chemical, electrical, or electromagnetic energy can excite an electron and drive it to a higher energy state. When the electron relaxes and drops to a lower energy state, it emits a photon that carries away energy equal to the difference between the two states. The electromagnetic frequency of the photon is proportional to the energy it carries. By examining the electromagnetic spectrum of radiation emitted from a substance to which energy has been added, the elements that make up that substance can be deduced. This method is called emission spectroscopy (e.g., flame spectroscopy). Each element emits photons at specific wavelengths, called line spectra, corresponding to the energy levels (or orbitals) its electrons can occupy. If an electron is excited from the absorption of electromagnetic energy, it will jump up to an available orbital that equals the original energy of the electron plus the energy of the absorbed photon. If, for example, the electron jumps up two orbitals when it absorbs a photon, and then partially relaxes and falls back one orbital, a photon will be emitted that carries lower energy (lower frequency) than the photon that was absorbed. This phenomenon, where the absorption of short wavelength light leads to the emission of longer wavelength light, is called fluorescence. Fluorescence, of course, is the principle underlying fluorescein angiography. The measurement of the electromagnetic frequency of emitted light as a function of the frequency of the exciter light is called fluorescence spectroscopy.
If a photon is absorbed by an electron in an atom that has an orbital that corresponds to the sum of the electron’s and photon’s energy, then the electron will make the quantum leap and the photon will cease to exist. (N.B.: Ironically, contrary to colloquial usage, a quantum leap is the smallest change in state permitted by nature.) When this event occurs, we say that light has been absorbed. If no orbital corresponding to the available energy exists for that atom, the electron will emit a photon at the same frequency as the one it caught. This “catch and release” of a photon by an electron is called scattering. Absorption spectroscopy is the measurement of the absorption of electromagnetic radiation as a function of frequency. The measurement of photon scattering as a function of electromagnetic frequency and other parameters is called scattering spectroscopy (e.g., Raman spectroscopy).
Depending on the direction of scattered photons relative to the direction of travel of the incident photons, we refer to scattering as reflection or refraction, or if directions are random, we simply call it scattered light. It should be noted, however, the laws of reflection and refraction are not concepts that apply at the quantum level. Photons travel at the speed of light in all media; light only appears to slow down in substances with higher refractive indices because of re-emission of radiation from excited electrons (photon catch and release). The laws of reflection and refraction, like polarization, are statistical laws that apply to large cohorts of photons.1,3 Although quantum theory is required to understand the emission and absorption of light, the statistical laws applied to photons allow us to use the much more tractable classical wave theory to explain the behavior of light in the environment.
Measurement of Light (Radiometry)
Imagine a point source that emits a burst of photons in every imaginable direction, all in a single instant. Each photon travels away from the source in a straight line at the speed of light. If we were to freeze time at some instant after the burst, we would see that all of the photons appear to be riding on the surface of a sphere. The radius of the sphere is simply the distance from the source that the photons, traveling at the speed of light, covered during the interval between the burst and the time-freeze. If there is a second burst of photons at some time interval after the initial burst, when time is frozen there would be two spherical surfaces centered on the point source, the second having a shorter radius, with the difference between radii proportional to the time difference between the bursts. Repeating this pattern, a series of bursts would produce a series of nested spheres, like a Russian nesting doll. As the time interval between successive photon bursts is made infinitesimally small, the spherical surfaces defined by each cohort of photons would be an infinitesimal distance from the surface ahead of it.
Each spherical surface defines a wavefront. More specifically, because the surface is of a sphere, we say it is a spherical wavefront. If there are Nν photons at each electromagnetic frequency in the wavefront, then the total electromagnetic energy in the wavefront is
or in terms of wavelength (in a vacuum),
These equations simply describe the sum over all photons in the wavefront of the energy in each photon. Typically, when measuring energy we are not interested in the entire sphere, only the part of the wavefront traveling in a particular direction. In that case, what is important is the energy density, i.e., the energy per unit area of the sphere. Energy density is called radiant exposure and is represented by the symbol H in units of Joules/cm2. Radiant exposure is an important measurement for very short pulses, like those from an excimer laser.
If d is the distance of the photons from the source at the time-freeze, the surface area of the sphere containing all of the photons is 4πd2. Because the number of photons defining the wavefront is constant (i.e., determined by the number emitted at the burst), the energy density will decrease as the surface area of the sphere increases. Consequently, energy density is inversely proportional to the square of the distance of the wavefront from the source,
This relationship is called the inverse square law.
If we now consider the successive bursts of photons separated by infinitesimally small intervals and choose a single point in space at some distance from the source, we can count the number of photons that pass through that point each second. By adding up the energy of the photons that were counted, we obtain a measure of radiant flux (also called radiant power), symbolized by Φ (or P) and expressed in units of Joules/sec, which is the definition of a Watt. Radiant power is an important measurement for continuous wave lasers.
Rather than looking at a single point in space, which is a mathematical ideal, we want to take the next step and measure the amount of light emitted from or falling on a surface of finite dimensions. In that case, we want a measurement of radiant flux density, which combines energy measurements made with respect to time and with respect to space. The radiant flux density for light emitted from a surface of finite dimensions (as opposed to a point source) is called radiant emittance (or radiant exitance) and is represented with the symbol M. If the measured light coming from a surface is a combination of emitted and reflected light, then the term radiosity is sometimes used. The radiant flux density for light falling on a surface of finite dimensions is called irradiance and is represented with the symbol E. Both radiant emittance and irradiance conventionally are expressed in units of Joules/sec/m2, which is the same as Watts/m2.
If one leaves a newspaper sitting in the sun, it will not catch on fire. However, as every school child knows, the sun imaged on black print with a magnifier can burn a hole in the paper. Under normal viewing conditions, sunlight is not dangerous to the eye. However, if a person stares at the sun, thereby forming an image of the sun on the retina with the optics of the eye, there is a serious risk of solar retinopathy. When image formation is part of the geometry of the light environment, then we need to consider some additional units of measurement.
If the light source is at a large distance from our optical system, relative to the numerical aperture of the system, then the image of the source will be formed in the focal plane of the system. The simplest example to use for illustration is a pinhole camera with a pinhole diameter of 0.316 mm. As illustrated in Figures 15.1A and B, the distance from the pinhole to the film is fixed at 5 cm. The triangle formed by the candle flame and the pinhole is similar to the triangle formed by the image of the candle flame and the pinhole (i.e., the two triangles have the same angles). If the distance between the candle and the pinhole is increased, as illustrated in Figure 15.1B, the image of the candle flame will be reduced proportionately because the distance from the pinhole to the film does not change. Let us assume that the irradiance at the pinhole from a 1-cm2 candle flame is 102W/m2. The area of the pinhole is 10-7m2, which means that the flux of the radiation entering the camera is 10-5W. The image of the 1-cm2 candle flame 1 m from the pinhole will have an area of 0.25 mm2 when the film is 5 cm from the pinhole. Thus, the irradiance on the film is 10-5W/.25 mm2 = 40W/m2. If the candle is moved to 2 m from the camera, then from the inverse square law the irradiance of the pinhole is 25W/m2, the radiant flux entering the 10-7m2 pinhole is 2.5 × 10⁻⁶W, and the image of the candle flame on the film 5 cm behind the pinhole has an area of .0625 mm2. Consequently, the irradiance on the film is 2.5 × 10⁻⁶W/.0625 mm2 = 40W/m2, the same as when the candle was at 1 m. As object distance increases, irradiance of the lens aperture decreases inversely proportional to the square of the distance, but the area of the image also decreases inversely proportional to the square of the distance so that image plane irradiance remains constant.
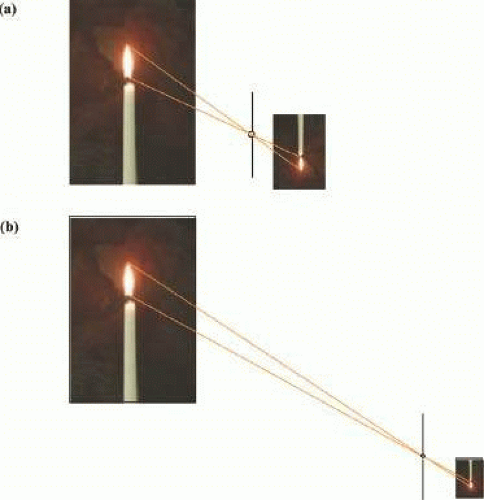 Figure 15.1. (A) An inverted image of the candle is formed by a pinhole. The ratio of the height of the candle flame to the distance of the candle for the pinhole (object distance) is the same as the ratio of the height of the image of the candle flame to the distance of the image from the pinhole (image distance). (B) The object distance is increased and the image size is decreased relative to Figure 15.1A. Because the ratio of the size of the image to the image distance equals the ratio of the size of the object to the object distance, and image distance is unchanged, the size of the image varies inversely with the object distance. Therefore, the image is smaller. The irradiance of the pinhole from the candle is inversely proportional to the square of the object distance; the area of the image also is inversely proportional to the square of the object distance. Consequently, irradiance in the image remains constant. |
Because of constant irradiance in the image irrespective of object distance, the most useful measurement of radiant flux density in environments with optical systems (like the eye) is one that is independent of distance from the source. To understand the geometry of such a measurement, think back to the burst of photons illustration that defined the spherical wavefront. As shown in Figure 15.2, we can construct a cone that has its apex at the point source and the edges of its base intersect the surface of the spherical wavefront. The apex angle of this cone is chosen such that the edges of the base circumscribe an area on the surface of the sphere equal to the squared radius of the sphere. The apex angle that satisfies this condition is approximately 65.54°. Any cone that has this apex angle, irrespective of its dimensions, is defined to be a unit solid angle and is called a steradian (sr). Because the total surface area of the spherical wavefront is 4πr2, and the surface area of the steradian is r2, there are 4π steradians in a sphere. The radiant flux emanating from a point source into a cone with its axis pointed in a particular direction is called radiant intensity, which is symbolized as I and specified in units of Watts/sr.
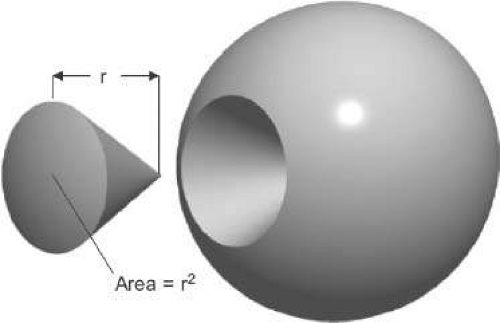 Figure 15.2. The steradian is defined to be a unit solid angle of a cone that subtends a surface area of a sphere equal to the radius squared (r2) of the sphere. |
If radiant intensity is the same in every direction, we say the radiant power is isotropic. Most sources, however, are anisotropic because of inhomogeneous emission, inhomogeneous optical properties of source envelopes, or the geometry of the source surface. Iso-radiant intensity contour maps in polar coordinates, like that shown for a light emitting diode in Figure 15.3, are called radiation patterns. Radiation patterns are interpreted as the source is positioned at the origin of the polar plot and the filled area represents the radiant intensity (distance from the origin) at each orientation.
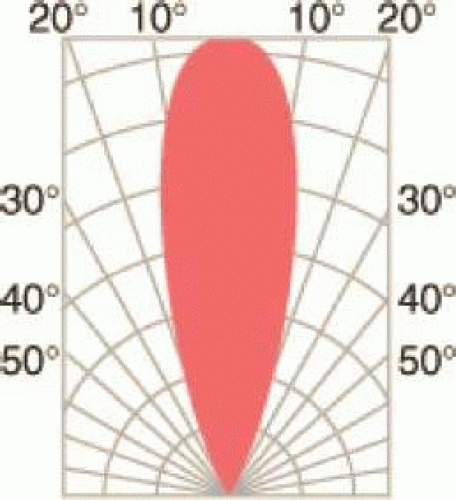 Figure 15.3. Radiation pattern for a light emitting diode. The light source is located at the origin of the polar plot. The meridional angles correspond to angles of azimuth or elevation (or some other plane) and the distance from the origin corresponds to radiant intensity. |
Finally, to complete our discussion of radiometry, consider the radiant intensity from a source of finite dimensions in a single plane, rather than from the ideal point source. The ideal point source is isotropic, whereas an ideal plane source is Lambertian. Lambertian surfaces obey Lambert’s law, which says that radiant intensity is maximum in the direction perpendicular (normal) to the plane of the source and falls off in proportion to the cosine of the angle with the normal for other directions. To correct for Lambert’s law, we specify the radiant intensity per projected unit area of the source. This measurement is called radiance, which is represented by the symbol L and specified in units of Watts/m2-sr. We use projected area of a source because it also varies in proportion to the cosine of the angle of measurement relative to the normal to the surface. For example, if a source has a height h and width w, the actual area of the source is h×w. That is also the projected area if the source is viewed along a line normal to the surface. If, however, the source is viewed from an angle θ away from normal in the horizontal direction, then the projected height of the source is still h, but the projected width of the source is cos(θ)×w. Because we specify radiance in terms of the projected source area, not the actual source area, the radiance of a Lambertian surface is the same in all directions.
Published tables of radiometry units and formulas are widely available in various handbooks4 and also can be found on the World Wide Web (but caution is advised).5 To avoid confusion and measurement errors, it is important to use the terms correctly. The most abused term in the literature is intensity.6 Although intensity has a precisely defined meaning as W/sr, it is often used synonymously with radiance, radiant power, radiant emittance, and irradiance.
Light Sources
All objects and materials constantly emit electromagnetic radiation because of thermal energy. The spectral power distribution of that radiation depends on the temperature of the emitter. As radiation is emitted, the temperature is reduced, as radiation from other surrounding sources is absorbed, the temperature is increased. Eventually, a thermal equilibrium is achieved where the rate of emission is balanced by the rate of absorption. This type of electromagnetic energy emission is called thermal or blackbody radiation. A mathematically ideal blackbody radiator absorbs all radiant energy incident upon it, which is why the term “black” is used. Planck’s law describes the spectral radiance of an ideal blackbody as a function of its temperature in degrees Kelvin (°K). As illustrated in Figure 15.4, the maximum spectral radiance of a blackbody shifts to shorter wavelengths as it is heated.
 Figure 15.4. Spectral radiance vs. wavelength for an ideal blackbody radiator at different temperatures (in degrees Kelvin). These curves are generated by Planck’s law. |
Depending on how the light is generated, light sources differ in their emission spectra and their radiation patterns. The emission spectrum of a source is measured as the spectral irradiance at the surface of a detector. The measured emission spectrum includes blackbody radiation of the source, emitted atomic line spectra from the source, and modifications of the emitted spectrum from absorption of energy by molecules in the source and in the medium between the source and the detector. The radiation pattern is determined by the geometry of the source, the distribution of heat in the source, and the geometry of energy absorbing, reflecting, or refracting material around the source.
The most ubiquitous source of electromagnetic energy in our environment is daylight, which, of course, begins with the sun. Specifications of daylight are enormously complex and highly variable because they depend not only on the emission spectrum and location of the sun, but also on local atmospheric conditions and reflection spectra from the local environment’s surface and objects (albedo). Figure 15.5 illustrates the emission spectrum of the sun measured as irradiance of a detector at two different locations. The emission spectrum represented by the black curve was measured in low earth orbit outside the atmosphere. The sun is a blackbody radiator and the smooth trend in the spectrum corresponds to an ideal blackbody at about 6,000°K. The emission spectrum represented by the gray curve was measured on the earth’s surface at sea level. The abscissa is the electromagnetic wavelength in a vacuum, specified in nanometers (nm = 10-9m) and the ordinate is spectral irradiance specified in Watts/m2 per nm of wavelength (the nm units incorporate the finite bandwidth of each spectral measurement). The “raggedness” of the black curve is caused by absorption lines from elements that make up the sun. As the sun’s energy passes through the earth’s atmosphere, additional absorption occurs in a wide variety of molecules such as water, atmospheric gases, dust, smoke, and pollutants. Also, spectral scattering from molecules in the atmosphere, which gives the sky its blue color, contributes to the loss of spectral irradiance in the short wavelengths. The scalloping of the curve in the infrared region of the spectrum is primarily due to the absorption bands of water vapor. The infrared energy transmitted through the atmosphere is mainly responsible for solar heating of the earth’s surface. It is the ultraviolet energy of the sun transmitted through the atmosphere that causes sunburn and light damage.
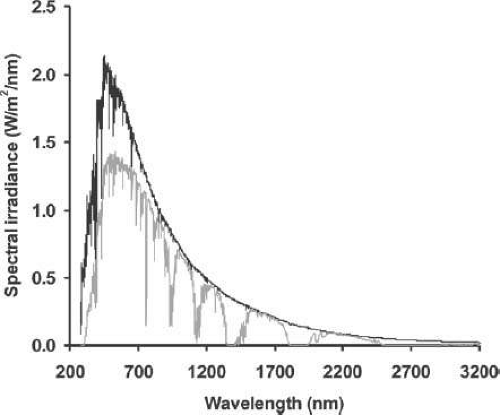 Figure 15.5. Emission spectrum of the sun measured outside the atmosphere in low earth orbit (black curve) and at sea level (gray curve). |
Artificial light sources can be classified according to the means by which the light is generated: flame, incandescence, gas discharge, phosphorescence, chemiluminescence, and electroluminescence. Candles, kerosene lamps, and gas lamps are examples of light sources that employ flames. These sources are mainly blackbody radiators and the emission spectrum depends on the temperature of the flame. In a candle flame, the rapid oxidation of paraffin creates hot soot with a spectral emission of a blackbody radiator ranging from about 1,000°K in the relatively cool red inner core of the flame to about 2,000°K in the hotter yellowish-white outer core of the flame. Incandescent sources also are blackbody radiators. The most common incandescent sources are high resistance wires (e.g., tungsten) in a vacuum or inert gas (e.g., nitrogen, argon, or krypton) heated to temperatures between 2,000°K and 3,300°K by an electric current. At higher temperatures, the filament rapidly evaporates, reducing the life of the source. Heating the filament in a halogen gas (e.g., bromine or iodine), which binds with the evaporated tungsten to redeposit it on the filament, can allow the incandescent source to be operated at much higher temperatures. The emission spectrum of the source depends not only on the temperature of the filament, but also the absorption spectrum of the envelope. For example, a fused quartz silicon envelope frequently used with tungsten halogen lamps absorbs UV energy, whereas an undoped quartz envelope will transmit UV-B (280–320 nm).
If electric current is passed through a gas, the gas emits light. This principle can be seen at work in nature with lightning. Gas discharge or arc lamps work by generating an electric current between electrodes through a gas (e.g., neon, argon, xenon, sodium vapor, mercury vapor). The voltage across the electrodes ionizes the gas so that it conducts an electric current. The current excites electrons in the gas and photons are emitted when the excited electrons drop back to their unexcited state. The emitted photons are at fixed electromagnetic frequencies (spectral lines) specific to the gas. In addition to the spectral lines discharged by the gas, the electric arc heats the electrodes so that blackbody radiation is emitted. Thus, as illustrated in Figure 15.6, in contrast to incandescent sources, the spectral power distribution of a gas discharge lamp consists of discrete atomic spectral lines determined by the gas that are superimposed on a continuous blackbody radiation spectrum determined by the temperature of the electrodes.
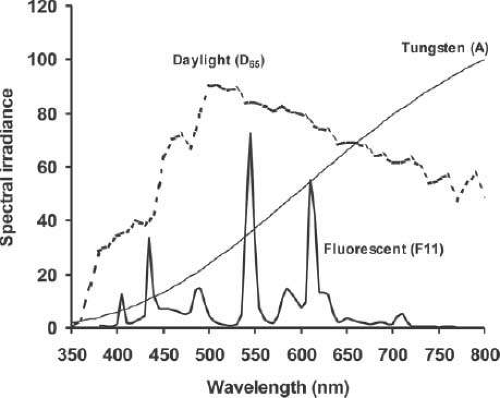 Figure 15.6. Comparison of the spectral irradiances of three types of standard light sources: fluorescent (F11), tungsten (A), and daylight (D65). |
Low pressure mercury vapor lamps have strong spectral lines in the ultraviolet (primarily at 185 nm and 253.7 nm). To make these emitted photons visible, the inside of the lamp envelope is coated with phosphorescent material (e.g., phosphor salts). The ultraviolet photons are absorbed by the phosphorescent material, which, as shown in Figure 15.6, fluoresces photons at longer wavelengths that are in the visible part of the spectrum. The fluorescent wavelengths are determined by the mix of phosphors. This familiar fluorescent lamp is an example of a phosphorescent source. A plasma display works in a fashion similar to a fluorescent lamp. A noble gas trapped in each pixel of the display is ionized by the pixel’s electrodes. The excited ionized gas emits ultraviolet photons, which are absorbed by the pixel’s phosphor, which in turn fluoresces at visible wavelengths.
Stay updated, free articles. Join our Telegram channel

Full access? Get Clinical Tree


