Electro-oculography
Ronald E. Carr
The electro-oculogram (EOG) is an indirect measure of the standing potential of the eye.1 This standing potential exists because of a voltage difference between the inner and outer retina and is so oriented that the inner retina is positive with regard to the outer retina. The clinical EOG measures this change indirectly by placing electrodes on either side of the eye and having the person move the eyes back and forth over a specific distance. Thus, one electrode will become more positive than the other as the eye (here considered a dipole) moves back and forth (Fig. 1).
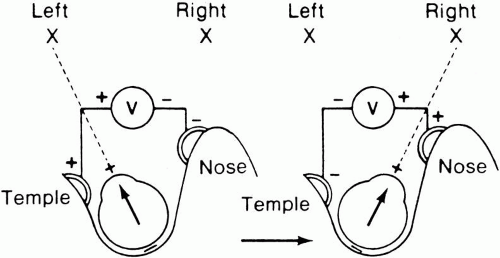 Fig. 1. Electro-oculogram (EOG) schematic. The eye can be considered a dipole with the anterior part relatively more positive than the posterior pole. EOG electrodes have been fixed to the outer and inner canthi of the left eye. On the left side of the diagram as the eye moves to the left, the outer canthal electrode (being closer to the positive pole of the eye) becomes more positive than the inner canthal electrode. Such a change in potential can then be recorded on a voltage meter. When the eye turns to the right, the inner canthal electrode then becomes positive and again a change in potential can be recorded but with opposite polarity. (Carr RE, Siegel IM: Visual Electrodiagnostic Testing. Baltimore: Williams & Wilkins, 1982) |
The importance of the clinical measurement of the EOG lies in the fact that the amplitude of the response changes when certain luminance conditions are varied. Thus, if a patient is placed in darkness the potential will decrease, whereas if a bright light is turned on following dark adaptation the potential will increase.2
To obtain reproducible and comparable results, recommendations to standardize EOG testing have been made by the International Society of Clinical Electrophysiology of Vision (ISCEV).3 The reader should refer to this article for specific recommendations, but the essence of an EOG is as follows. After a preadaptation period of several minutes to acquaint the patient with the test, the lights are turned off for 15 minutes. Recordings for several saccades are made in the dark at 1-minute intervals. The lowest potential (dark trough) is reached in 8 to 12 minutes. A bright light is then turned on and recordings continue at 1-minute intervals with the potential increasing in amplitude until the highest point (light peak) is reached in 7 to 10 minutes. The ratio of the light peak to the dark trough is then calculated with normal being 165% or greater4 (Fig. 2).
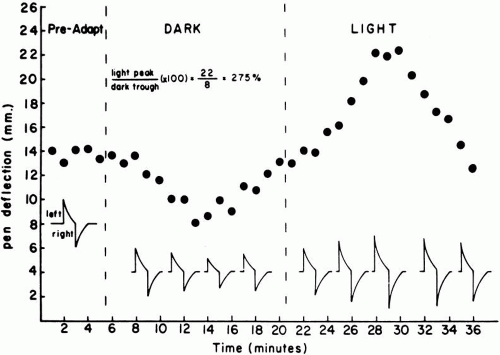 Fig. 2. Graphic representation of the electro-oculogram (EOG) at various periods of adaptation. The black circles represent the average pen swing amplitude of several saccades taken at that period of time. Insert shows how an individual saccade might appear at certain time periods with a decrease in darkness and increase in light. The greatest EOG amplitude achieved in light (light peak) is divided by the lowest amplitude in the dark (dark trough) and the calculated ratio is expressed as a percent. (Carr RE, Siegel IM: Visual Electrodiagnostic Testing. Baltimore: Williams & Wilkins, 1982)
Stay updated, free articles. Join our Telegram channel
Full access? Get Clinical Tree
 Get Clinical Tree app for offline access

|