Diagnostic Imaging


Diagnostic Imaging


Jenny K. Hoang

Adam M. Becker


Computed tomography (CT) and magnetic resonance imaging (MRI) are indispensable radiologic modalities for the evaluation of the paranasal sinuses. These crosssectional techniques allow for multiplanar visualization, and are superior to plain radiography for resolution of small anatomical structures and lesions. The aim of this chapter is to describe the role of imaging, and the imaging approach to common sinus pathologies.


INDICATIONS FOR SINUS CT AND MRI

Sinonasal imaging is performed for two main indications: inflammatory disease and mass. The choice between use of CT and MRI depends on the clinical scenario. The common indications for CT and MRI of the paranasal sinuses are reviewed in the American College of Radiology Appropriateness Criteria (1). A summary of the indications is found in Table 27.1.

CT has a role in both inflammatory disease and investigation of a mass because of its superior bone resolution. In the case of inflammatory disease, CT is most commonly performed for recurrent acute or chronic rhinosinusitis. There is little yield for imaging in acute and subacute rhinosinusitis since these are clinical diagnoses that are managed nonsurgically (1,2). Exceptions are if complications are suspected, or if the patient has comorbidities that predispose to complications, including diabetes, immune compromised state, or a past history of facial trauma or surgery (2).

MRI is not ideal for visualizing bony structures and generally has no role in uncomplicated inflammatory disease. The strength of MRI is its superior soft tissue resolution, which allows differentiation between three possible causes of sinus opacification on CT: a solid mass, inflammatory mucosa, and an obstructed fluid-filled sinus. Thus, the main roles of MRI are in characterizing suspected masses, staging malignancies, and surveillance of treated neoplasms. MRI is also superior to contrast-enhanced CT for evaluation of the orbit and brain in the setting of complicated rhinosinusitis or invasive fungal sinusitis.


IMAGING TECHNIQUES

Table 27.1 summarizes the physical principles, protocols, and potential risks of CT and MRI. It is important for the clinician to be familiar with these basic concepts and the terminology used to describe imaging findings.


CT Terminology

The shades of grey on CT are described with the terms “density” or “attenuation.” High density indicates a “whiter/brighter” appearance on CT, as seen with proteinaceous secretions, allergic mucin, and calcification. The wide range of density values detected by CT (spanning >2,000 Hounsfield units) cannot be displayed on a single set of images; therefore different “CT windows” are used to display a single scan (Fig. 27.1). In the era of electronic picture archiving, CT windows can be changed easily with shortcut buttons. For sinus imaging, “bone windows” are used to display the fine detail of osseous abnormalities or calcifications within a mass. “Soft tissue windows” are also routinely reviewed and have higher contrast to help demonstrate the narrow density differences between soft tissue and fluid.


MRI Terminology

The shades of grey on MRI are described with the term “intensity.” The combination of signal intensities on different sequences (e.g., T1 and T2) and the use of intravenous contrast help to infer the tissue properties (Fig. 27.2). For example, simple fluid is hypointense (darker) on T1 sequences, hyperintense (white/brighter) on T2 sequences and does not enhance.


Other sequences, such those as with fat-saturation or suppression, can help to confirm fat content and make enhancement more conspicuous when the high signal of fat is nulled.


TABLE 27.1 COMPARISON OF CT AND MRI PRINCIPLES, PROTOCOLS, INDICATIONS AND POTENTIAL RISKS


CT


MRI


Physics Principles


  • An x-ray source rotating around the patient emits highly collimated x-ray beams at various angles around the patient.


  • Detectors opposite the x-ray source register the x-ray beam after it is partly absorbed by the patient.


  • The x-ray attenuations received by the detectors are converted into images.


  • Spinning protons of hydrogen atoms in the body are aligned by a high-strength magnetic field.


  • A radiofrequency wave is introduced to excite the protons. When the radiofrequency wave is turned off, spinning protons relax and emit a signal. Different tissues have different signals and these signals are converted into images.


Protocol


  • Data acquisition in the axial plane.


  • Multiplanar reconstruction of axial images into sagittal and coronal planes. In many centers this has eliminated the need for direct coronal imaging with the patient in prone position.


  • No intravenous contrast unless intraorbital or intracranial complications.


  • T1-, T2- and postcontrast fat-saturated T1-weighted images in the axial and coronal planes.


Indications


  • Acute and subacute sinusitis in immunodeficient patient.


  • Acute and subacute sinusitis with associated orbital complications and/or neurologic deficit.


  • Recurrent acute or chronic sinusitis (possible surgical candidate).


  • Sinonasal polyposis.


  • Sinonasal obstruction, suspected mass lesion.


MRI and CT are complementary for the following indications:


  • Acute and subacute sinusitis with associated orbital complications and/or neurologic deficit.


  • Sinonasal obstruction, suspected mass lesion.


Potential risks


  • Uses ionizing radiation. Minimizing use of radiation exposure is especially important in young adults and children.


  • Iodinated contrast can worsen renal impairment, cause lactic acidosis in diabetic patients on Metformin, and has a very small risk of anaphylactic reaction.


  • Implantable devices such as cardiac pacemakers, cochlear implants, metallic intraocular foreign bodies can be preclude MRI scanning.


  • Use of Gadolinium contrast in patients with renal failure is associated with a risk of nephrogenic sclerosing fibrosis.


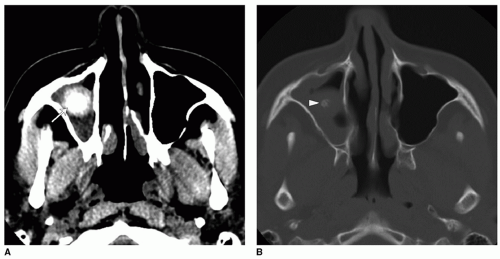
Figure 27.1 Fungus ball in soft tissue and bone windows. A: Axial CT image with soft tissue windows shows a right maxillary sinus high-density rounded mass (arrow). B: Axial CT image with bone windows shows central calcification (arrowhead) within the mass. Note that the fungus ball and mucosa have different density appearances on soft tissue window, which cannot be appreciated on bone windows. On bone windows, the calcifications and bony structures are more conspicuous.


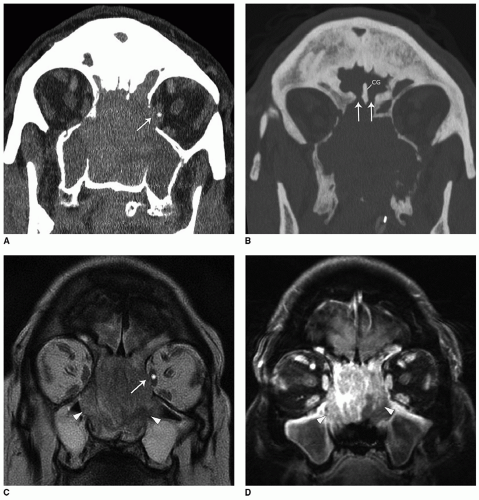
Figure 27.2 Sinonasal carcinoma with invasion of anterior cranial fossa and bony orbit. Differences between CT and MRI. A: Coronal CT image shows complete opacification of the bilateral nasal cavity and paranasal sinuses. There is bony destruction at the medial wall of the left orbit (arrow) with loss of fat plane around the medial rectus muscle (asterisk). B: Coronal CT image shows bony destruction at the cribriform plate (arrows). CG, crista galli. C: Coronal T2-weighted MRI image more clearly depicts the difference between isointense tumor mass (arrowheads) filling the nasal cavity and hyperintense inflammatory fluid in the maxillary sinuses. Tumor bows into the orbit (arrow), but a smooth contour suggesting that the periorbita is intact. The medial rectus muscle (asterisk) has normal signal and size. There is no intracranial mass despite anterior skull base bony destruction. D: Coronal enhanced T1-weighted MRI image shows enhancing tumor in the nasal cavity (arrowheads) extending into the frontal sinuses. Note that MRI is better than CT in differentiating between tumor and fluid-filled maxillary sinuses, which are T2 hyperintense and nonenhancing.


IMAGING APPROACH


Rhinosinusitis

CT is the principal modality used in imaging rhinosinusitis. A systematic approach to interpretation includes evaluation for the following: (a) signs of inflammatory sinus disease, (b) underlying mass or the presence of complications, and (c) anatomical and critical variants that may make future surgery more difficult or hazardous (3).


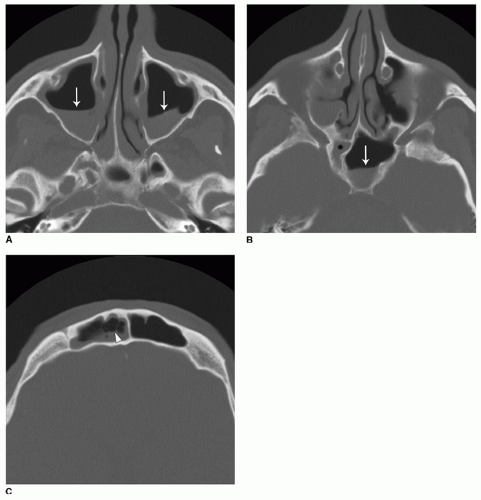
Figure 27.3 Acute sinusitis. Axial CT images through the (A) maxillary, (B) sphenoid, and (C) frontal sinuses showing layering air-fluid levels (arrows). There are also frothy secretions in the right frontal sinus (arrowhead).


Imaging Findings of Rhinosinusitis and Sinonasal Polyposis

A mild degree of mucosal thickening is a common, but nonspecific finding on sinus CT. It can be found in acute or chronic rhinosinusitis, but may also be seen in asymptomatic patients. Nasoethmoidal mucosal thickening can also be part of the physiologic nasal cycle (4). Therefore, the presence of mucosal thickening should be interpreted in context with the clinical history and physical examination.

More specific signs of acute rhinosinusitis include dependent air-fluid levels and bubbly or strandy secretions (Fig. 27.3). CT cannot differentiate between bacterial and viral sinusitis. An uncommon, but possibly underdiagnosed
cause of acute maxillary sinusitis is odontogenic infection. This should be suspected if the CT findings of sinusitis are severe in the presence of an oroantral fistula, periodontal lucency (abscess), or a tooth root projecting into the maxillary sinus (Fig. 27.4) (5). The typical finding in chronic rhinosinusitis is significant mucosal thickening or opacification in a nonexpanded sinus, often with ostial obstruction. A characteristic, but less common sign of chronic rhinosinusitis is sclerosis and thickening of bony sinus walls, particularly seen in the sphenoid and maxillary sinuses (Fig. 27.5). Chronic rhinosinusitis may also be associated with high-density opacification that often represents viscous or desiccated secretions, but can also be a sign of coexisting allergic fungal rhinosinusitis or fungus ball.


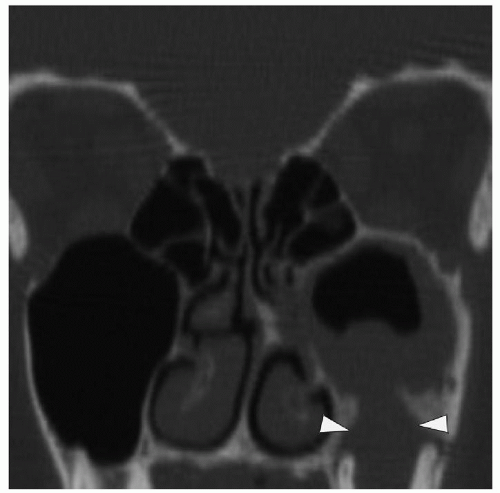
Figure 27.4 Odontogenic maxillary sinusitis. Coronal CT image shows a left molar periapical abscess (arrowheads) contiguous with the left maxillary sinus in keeping with an oroantral fistula. There is mucosal thickening and possibly fluid in the left maxillary sinus. Other paranasal sinuses are normal.


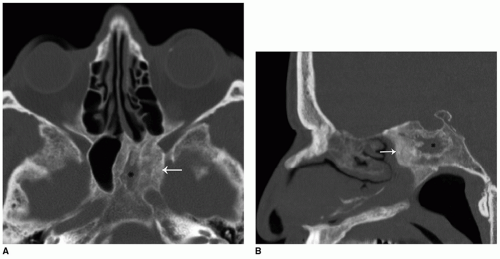
Figure 27.5 Chronic sinusitis. A: Axial and B: sagittal CT images show opacification of the left sphenoid sinus (asterisks) with bony sclerosis and wall thickening (arrows).

In correlating clinical symptoms with the pattern of disease on imaging, the sites of drainage pathway obstruction are of particular interest when planning endoscopic sinus surgery (ESS). There are three paranasal drainage pathways on each side that need to be evaluated for obstruction and the cause of obstruction: the ostiomeatal complex (OMC), frontal recess, and sphenoethmoidal recess (SER). The coronal plane is most similar to the endoscopic view and enables excellent visualization of the OMC (Fig. 27.6). The SER is best viewed in the axial and sagittal plane, and the frontal recess is best evaluated with a combination of coronal and sagittal imaging (Fig. 27.6).

Sinonasal polyposis is characterized by low-density polypoid lesions that fill the bilateral nasal cavity and the sinuses (Fig. 27.7). The polyps can obstruct the drainage pathways at multiple sites, resulting in retained secretions and opacification of sinuses. In neglected cases, they can exert pressure on bony structures leading to expansion of the sinonasal cavity and bony remodeling rather than focal bony destruction.


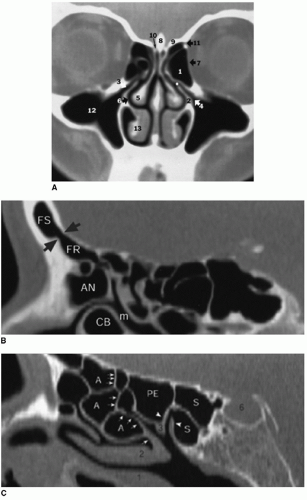
Figure 27.6 Normal paranasal sinus anatomy. A: Coronal CT image shows the normal OMC. Components of the ostiomeatal complex (OMC) are as follows: 1, bulla ethmoidalis; 2, uncinate plate; 3, infundibulum; 4, inner maxillary sinus ostium; 5, middle turbinate; 6, middle nasal meatus; *, hiatus semilunaris. The following are other important landmarks on this image: 7, lamina papyracea; 8, crista galli; 9, fovea ethmoidalis; 10, medial lamella; 11, anterior ethmoidal foramen; 12, maxillary antrum; 13, inferior turbinate. B: Sagittal CT image shows the frontal recess. The frontal ostium (arrows) produces the waist of the classic hourglass configuration. Inferiorly, a large agger nasi cell bulges posteriorly to severely narrow and distort the recess. FS, frontal sinus; FR, frontal recess; AN, agger nasi; L, lacrimal bone; CB, concha bullosa; m, middle nasal meatus. C: Sagittal CT image shows the sphenoethmoidal recess (SER) (arrowheads). S, sphenoid sinus; PE, posterior ethmoidal sinus; A, anterior ethmoidal sinus; arrowheads, SER; 1, inferior turbinate; 2, middle turbinate; 3, superior turbinate; arrows, basal lamella.


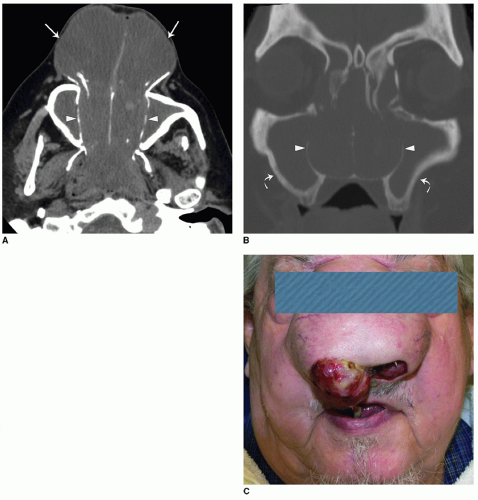
Figure 27.7 Sinonasal polyposis. A: Axial CT image shows complete opacification of the nasal cavity with soft tissue density masses projecting through the nostrils (arrows). There is bony thinning of the walls of the nasal cavity (arrowheads). B: Coronal CT image show nasal cavity opacification with thinning of the walls of the nasal cavity (arrowheads). There is also opacification of the maxillary sinuses with bony sclerosis and thickening (curved arrows). C: Photograph of polyps causing cosmetic deformity of the nose.


Other Inflammatory Sinus Lesions

Mucoceles are cysts lined by pseudostratified ciliated columnar epithelium (Fig. 27.8) and are most frequently observed in the frontal sinus followed by the ethmoidal, maxillary, and sphenoid sinuses. They are believed to form because of chronic obstruction of a sinus ostium, leading to accumulation of fluid within the sinus cavity and slow asymptomatic expansion of the sinus. Imaging typically demonstrates an enlarged completely opacified sinus with rounded contours and thinning of sinus walls. The density of the opacified sinus is usually low, representing fluid, but the sinus density can also be high as mucus becomes inspissated. Large mucoceles can lead to cosmetic deformities such as orbital proptosis and obstruct adjacent drainage pathways.

The less common complication of a chronically obstructed sinus is involution of the sinus, known as atelectatic sinus or silent sinus syndrome (Fig. 27.9). This forms because of negative intrasinus pressure and is most commonly seen in the maxillary sinus. The imaging findings are thinner sinus walls that are bowed or pulled inward to the center of the sinus. There may be cosmetic deformity or enophthalmos as the orbital floor bows down.

Retention cysts are common incidental findings in the maxillary and sphenoid sinuses. They are submucosal

collections of fluid (serous retention cysts) or collections from an obstructed seromucinous gland (mucous retention cysts). They most frequently occur in the maxillary antrum and appear as smooth, outwardly convex soft tissue density masses. On CT, it is difficult to differentiate a cyst from a polyp since both have soft tissue density. On MRI, a cyst does not enhance except for its mucosal surface. A polyp represents hyperplastic mucosa and will solidly enhance.


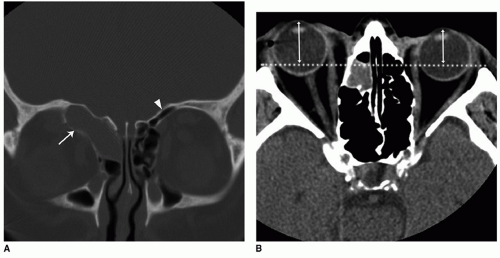
Figure 27.8 Frontal sinus mucocele with proptosis. A: Coronal CT image shows rounded expansion of the right frontal sinus with bony thinning (arrow) compared to the normal left frontal sinus (arrowhead). B: Axial CT image shows right proptosis due to mass effect from the mucocele. The dotted line is the interzygomatic line and allows comparison of the position of the right and left globe (double arrowed lines).


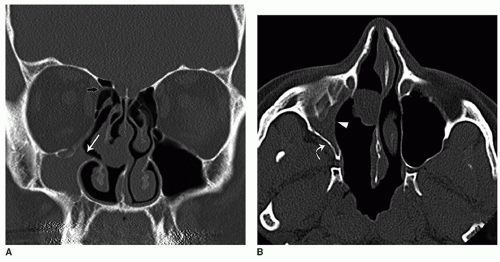
Figure 27.9 Atelectatic sinus. A: Coronal CT image shows a smaller right maxillary sinus. There is lateral rotation of the uncinate process (white arrow) that widens the space between the uncinate process and the middle turbinate. Note also the normal “nipple sign” indicating the anterior ethmoidal foramen (black arrow). B: Axial CT image shows smaller right maxillary sinus with inward bowing of the posterior (curved arrow) and medial walls (arrowhead) of the maxillary sinus. The atelectatic sinus predisposed the patient to complications during endoscopic sinus surgery (ESS).


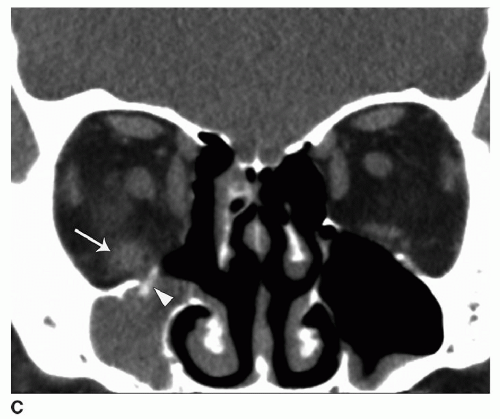
Figure 27.9 (Continued) C: Postoperative coronal CT image of patient in A and B demonstrating the ESS complication of a fracture to the floor of the orbit (arrowhead) and injury to the inferior rectus muscle with enlargement and fat stranding (arrow). Courtesy of MT Bhatti, MD, Duke University Medical Center.


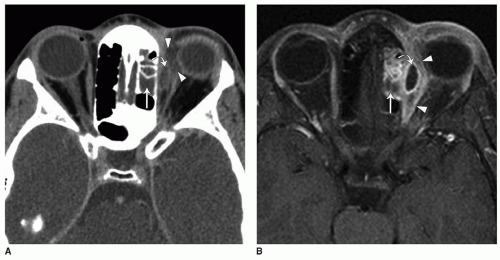
Figure 27.10 Orbital subperiosteal abscess complicating ethmoid sinusitis. A: Axial-enhanced CT image shows left ethmoid sinus opacification from acute sinusitis (arrow) and left orbit extraconal fat stranding (arrowheads). There is a small low attenuation collection (curved arrow) that is better seen on MRI. B: Axial-enhanced fat-saturated T1-weighted image shows left ethmoid sinus mucosal enhancement from acute sinusitis (arrow) and left orbit extraconal fat enhancement (arrowheads). There is a small ring-enhancing collection (curved arrow) representing an abscess.


Evaluating Imaging for Complications and Obstructive Masses

Complications of sinusitis include spread of infection to the orbits, bone, and brain. CT or MRI can readily demonstrate an orbital subperiosteal abscess (Fig. 27.10) and deep extent of infection when there is clinically apparent periorbital cellulitis. Infection of the frontal bone can lead to a subperiosteal abscess known as Pott puffy tumor (6). If this is present, it is important to evaluate for intracranial complications (Fig. 27.11), which can occur with or without bony changes. MRI is more sensitive than CT for intracranial complications such as meningitis, subdural or epidural empyema (Fig. 27.12), brain abscess, and cavernous sinus thrombosis.

The most common cause of sinus drainage pathway obstruction is mucosal thickening, but occasionally the cause for obstruction may be due to anatomic variations and rarely there is an obstructing mass. The best sign of an underlying mass on CT is a soft tissue opacity with bony destruction (Fig. 27.13). In such cases, direct endoscopy and biopsy with or without preoperative MRI is the key to making a diagnosis. Prior to biopsy, it is important to consider whether the mass could be due to herniation of

intracranial contents. Meningoceles and encephaloceles appear on CT as a soft tissue mass abutting the skull base with focal bony dehiscence. The diagnosis is best confirmed with MRI. Meningoceles show T2 hyperintensity due to the presence of cerebrospinal fluid (CSF). Encephaloceles are characterized by a soft tissue mass with signal isointense to gray matter and contiguity to intracranial parenchyma (Fig. 27.14).


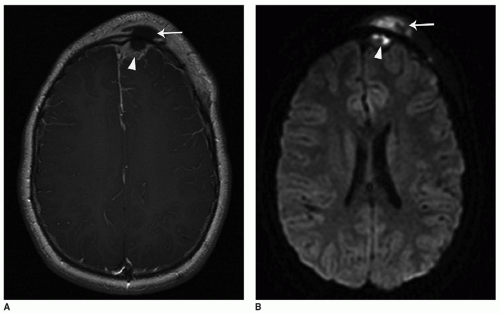
Figure 27.11 Pott puffy tumor with epidural empyema. A: Axial-enhanced T1-weighted image shows a hypointense collection overlying the left frontal bone (arrow) that is continuous with a rim enhancing extraaxial (outside brain parenchyma) collection overlying the left frontal lobe (arrowhead). B: Axial diffusion-weighted image shows bright signal in the collections indicating restricted diffusion. This supports the diagnosis of abscess.


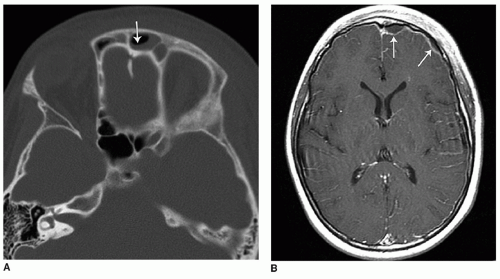
Figure 27.12 Subdural empyema complicating frontal sinusitis. A: Axial CT image shows left frontal sinus opacification with an air-fluid level (arrow) suggestive of acute sinusitis. B: Axial-enhanced T1-weighted MRI image of the brain shows a rim-enhancing crescentic extraaxial collection overlying the left frontal lobe consistent with a subdural empyema secondary to acute sinusitis.
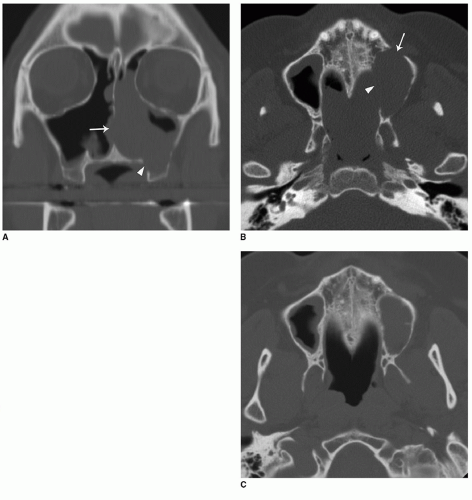


Get Clinical Tree app for offline access