Purpose
To assess the agreement and repeatability of horizontal white-to-white (WTW) and horizontal sulcus-to-sulcus (STS) diameter measurements and use these data in combination with available literature to correct for interdevice bias in preoperative implantable collamer lens (ICL) size selection.
Design
Interinstrument reliability and bias assessment study.
Methods
A total of 107 eyes from 56 patients assessed for ICL implantation at our institution were included in the study. This was a consecutive series of all patients with suitable available data. The agreement and bias between WTW (measured with the Pentacam and BioGraph devices) and STS (measured with the HiScan device) were estimated.
Results
The mean spherical equivalent was −8.93 ± 5.69 diopters. The BioGraph measures of WTW were wider than those taken with the Pentacam (bias = 0.26 mm, P < .01), and both horizontal WTW measures were wider than the horizontal STS measures (bias >0.91 mm, P < .01). The repeatability (Sr) of STS measured with the HiScan was 0.39 mm, which was significantly reduced (Sr = 0.15 mm) when the average of 2 measures was used. Agreement between the horizontal WTW measures and horizontal STS estimates when bias was accounted for was г = 0.54 with the Pentacam and г = 0.64 with the BioGraph.
Conclusions
Large interdevice bias was observed for WTW and STS measures. STS measures demonstrated poor repeatability, but the average of repeated measures significantly improved repeatability. In order to conform to the US Food and Drug Administration’s accepted guidelines for ICL sizing, clinicians should be aware of and account for the inconsistencies between devices.
The number of refractive surgery cases continues to increase, which is in line with patient expectations of achieving a perfect visual outcome, but achieving this demands highly accurate preoperative measures. A primary example of this is the implantable collamer lens (ICL; Staar Surgical, Monrovia, California, USA), a posterior chamber–type phakic intraocular lens designed to be implanted in the ciliary sulcus. The US Food and Drug Administration–approved method of determining ICL size is the conventional STAAR sizing nomogram using 2 ocular parameters: horizontal white-to-white (WTW, distance from limbus to limbus/corneal diameter) and anterior chamber depth (ACD). This method of determining the ICL size relies predominantly on the horizontal WTW measurement, which relies on the assumption of a correlation between the WTW distances and the sulcus iridociliaris.
An incorrect ICL size will result in suboptimal vaulting (distance between the anterior lens surface and the ICL), which is associated with a number of visually significant postoperative complications. Despite efforts to improve the predictability of vaulting following ICL implantation, it remains poor for multiple reasons. High-frequency ultrasound biomicroscopy (UBM) with a wide scanning field has enabled direct measurement of the horizontal sulcus-to-sulcus (STS) diameter. Poor correspondence (г < 0.50) between the horizontal WTW and STS measures has been reported, but the width of the limits of agreement (LoA) reported between the horizontal WTW and STS measures is similar to the repeatability limits of STS estimates. UBM devices have relatively low precision in STS estimates compared to horizontal WTW measures of Scheimpflug imaging or partial low-coherence inferometry—for example, coefficients of variation (CoVs) of 0.9%–2.7% (HiScan) and 5% (VuMax) for STS measures vs 0.7%–1% (Orbscan), <0.5% (Galilei Sirius), 2% (IOLMaster), and 0.2% (Lenstar) for WTW measures. Furthermore, Yokoyama and associates reported a within-subject repeatability (S w ) of approximately 0.53 mm for the Vumax UBM device (confidence interval [CI] of repeatability −1.1 mm, 1.5 mm). Biermann and associates subsequently reported a poor level of agreement between the STS measured by Vumax and the horizontal WTW measured by Orbscan and IOLMaster, with LoA of approximately [−0.7 mm,−0.1 mm] and [−0.4 mm,+0.6 mm], respectively. Because the interdevice agreement between Vumax and Orbscan/IOLMaster is better than the intradevice precision of Vumax, a conclusion of poor agreement is unsupported. In another article on the UBM Artemis device, the CoV for STS measures was estimated to be 0.4%, referencing a study on a metallic bolt (not an eye), before reporting poor agreement between the Artemis UBM and Orbscan. Considering the higher axial resolution of this UBM device compared to the lateral resolution (50 MHz probe: axial resolution 30–40 μm and lateral resolution 50–60 μm) and that central corneal thickness is a more clearly defined anatomic structure with less inhibition of clear imaging, the repeatability of central corneal thickness should be at least as good as that of STS. As the repeatability of the Artemis for central corneal thickness has been established to be ∼2%, it seems reasonable to propose that the CoV of STS measures is at least as wide as that of the CCT, which would translate to a LoA of >±0.25 mm for STS. This would explain 50% of the disagreement observed between STS (Artemis) and horizontal WTW (Orbscan) measures. Thus, different levels of measurement noise/calibration between measurement devices confound comparison.
The following study examines 3 index measures: namely, the STS diameter determined by ultrasound biomicroscopy (HiScan) and the horizontal WTW distance measured by 2 different devices (Pentacam and BioGraph). The repeatability of measures by each device and the agreement between these index measures were assessed in a large number of patients prior to ICL implantation. The BioGraph and HiScan devices were selected based on their high level of precision. Our ultimate aim was to combine these results with those available in the literature and create an interdevice conversion table in order to better comply with the STAAR nomogram for ICL sizing.
Methods
Patients
This study conformed to the tenets of the Declaration of Helsinki and was approved by the ethical committee of the canton of Vaud, Switzerland (Authorization no. 035.0003-48). All patients attended a specialized consultation at the cornea and refractive surgery unit at the Jules-Gonin Eye Hospital, Lausanne, Switzerland, with the desire for refractive surgery.
This assessment of interinstrument reliability and bias used retrospective data from the ICL database for all consecutive patients who underwent preoperative ICL assessment between January 1, 2000 and June 1, 2014. A total of 210 eyes from 107 patients were reviewed, of which 125 eyes from 65 patients had Pentacam measures available, 124 eyes from 64 patients had BioGraph measures available, 116 eyes from 59 patients had UBM data available, and 107 eyes from 56 patients had all 3 measures of appropriate image quality available. No further inclusion or exclusion criteria were applied to the study cohort.
All patients were measured using Pentacam HR and BioGraph as part of the preoperative evaluation for refractive surgery. If the patients were considered to be suitable candidates for ICL implantation, UBM of the ciliary sulcus was performed. Prior to the measurement, 1 drop of pilocarpin nitrate 2% (Bausch and Lomb, Surrey, UK) was administered to the eye in order to achieve the best possible alignment of the UBM handpiece with the horizontal and vertical STS.
Measurements Prior to Implantable Collamer Lens Implantation
Pentacam HR (Oculus; Optikgeräte GmbH, Wetzlar, Germany, software version 1.20r02) was used to make corneal tomography measurements in 25-picture mode. Scans were taken in automatic release mode. If the system considered the measurement to be unreliable, the measurement was repeated. Only measurements with a quality factor (Q) “OK,” as displayed by the system, were used for analysis. Testing was conducted with the patient’s natural pupils under mesopic conditions. The horizontal WTW was determined manually on Scheimpflug image no. 17/25, as it represents the horizontal axis (183 degrees). The caliper function available within the device was used to measure the distance from the anterior corneoscleral transition point on one side to the other ( Figure 1 , Top). Two images taken of the same eye at preoperative follow-up visits were assessed by a single observer to estimate the repeatability of this measure.
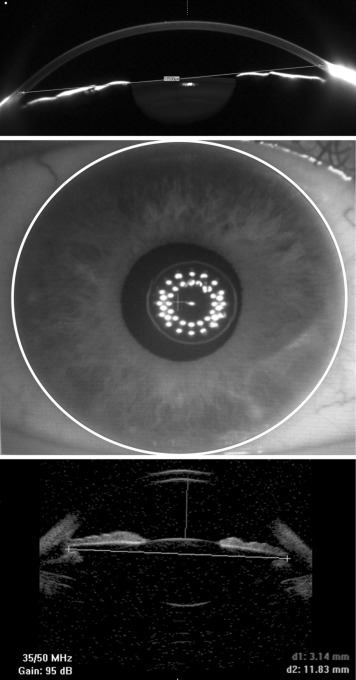
The ALLEGRO BioGraph (Wavelight AG)/BioGraph LS 900 (Haag Streit AG, Koeniz, Switzerland) is a multifunctional device used in preoperative patient evaluation before cataract surgery and other refractive surgery procedures. The measurement is based on optical low-coherence interferometry (OLCI), which captures 16 images in sequence. Along with standard biometry measures, this device provides a measurement of pupil diameter, visual axis, and horizontal WTW diameter ( Figure 1 , Middle).
The high-frequency B-scan diagnostic UBM imaging system (Optikon HiScan; Optikon 2000 SpA, Rome, Italy) employed in the present study can capture the entire anterior segment in a single scan. A probe with a 35 MHz transducer was used for STS measurements. The axial and lateral resolution is 70 μm in the anterior segment with a penetration of 7–8 mm. The caliper function available within the device was used to measure the horizontal ciliary sulcus from one side to the other ( Figure 1 , Bottom). The repeatability of STS measurements was evaluated previously, finding a CoV of 2.7%. To reduce measurement error, 4–6 UBM images were taken and the average STS measure reported (0.9% as estimated by Oh and associates ). A single experienced examiner (S.P.) carried out all UBM measurements.
Statistical Analysis
Data were exported and imported into R version 2.15.120 (R Foundation for Statistical Computing, Vienna, Austria) for analysis. Parameters used in analysis were age, spherical equivalent (SE), axial length (AL), intraocular pressure (IOP), ACD, WTW as measured by Pentacam and BioGraph, and STS as measured by HiScan. Data were split into 3 subgroups for 3 parameters for sub-analysis: ACD (shallow <3.2 mm, medium 3.2 mm–3.4 mm, and deep >3.4 mm), AL (moderate<25.0 mm, long 25.0–27.0 mm, and very long >27 mm), and SE (hyperopia to moderate myopia, up to −6 diopter [D]; high myopia, −6 D to −10 D; and very high myopia, stronger than −10 D). For UBM measures, between 4 and 6 measures were taken, and the average of the full set of measures was used in the agreement analysis. As per the British Standards Institute and the International Organization for Standardization, repeatability (Sr; the within-subject standard deviation for repeated measures with the same observer) was derived using 1-way analysis of variance (ANOVA). For the HiScan device, the STS estimate was the outcome and image number, patient, and eye (right/left) were covariates. For the Pentacam device, the horizontal WTW estimate was the outcome and image number, patient, and eye (right/left) were covariates.
Results
A total of 107 eyes from 56 patients were analyzed. The mean SE ± standard deviation (SD) was −8.93 D ± 5.69 D. The mean AL was 26.67 mm ± 2.44 mm and mean ACD 3.17 mm ± 0.25 mm. The baseline characteristics of these eyes are given in Table 1 with a summary based on SE and astigmatism. Notably, the horizontal WTW measures using the BioGraph device were significantly wider than those from the Pentacam device (bias = 0.26 mm, P < .01, Table 2 ) and the STS measures (bias = 1.17 mm, P < 0.01, Table 2 ). The horizontal WTW measures using the Pentacam device were significantly wider than the STS measures (bias = 0.91 mm, P < .01, Table 2 ). The relationship between horizontal WTW/ACD and horizontal WTW/AL is given in Figure 2 . The horizontal WTW (Pentacam and BioGraph) and STS (UBM) measures were significantly smaller in eyes with shallow ACD (<3.2 mm) than in eyes with medium (3.2–3.4 mm) or deep ACD, with the exception of horizontal WTW measures using the Pentacam device in eyes with deep and shallow ACD. No significant differences were observed in the horizontal WTW measures of eyes in terms of AL, but there were significant differences in the STS measures of moderate vs long or very long eyes ( Figure 2 ). Vertical and horizontal STS diameters were highly correlated ( P < .001), but the vertical STS was significantly longer than the horizontal STS by approximately 0.4 mm and 4% of eyes had the inverse.
| Parameter | Hyperopic/ Moderately Myopic (up to −6.0 D) | Highly Myopic (−6 D to −10 D) | Very highly Myopic (Stronger Than −10 D) | Full Group | Astigmatic Eyes (≥1 D) |
|---|---|---|---|---|---|
| Number of eyes | 17 | 40 | 50 | 107 | 70 |
| SE | +1.90 (± 4.16) | −8.52 (± 1.16) | −12.94 (± 5.69) | −8.93 (± 5.69) | −9.53 (± 5.33) |
| AL | 22.80 (± 1.56) | 26.8 (± 0.97) | 27.88 (± 2.15) | 26.67 (± 2.44) | 26.87 (± 2.46) |
| ACD | 3.05 (± 0.22) | 3.26 (± 0.26) | 3.14 (± 0.23) | 3.17 (± 0.25) | 3.18 (± 0.24) |
| IOP | 14.6 (± 1.9) | 15.5 (± 2.9) | 16.1 (± 2.3) | 15.6 (± 2.5) | 15.6 (± 2.5) |
| WTW Pentacam | 11.91 (± 0.48) | 12.00 (± 0.53) | 11.73 (± 0.47) | 11.86 (± 0.52) | 11.83 (± 0.49) |
| WTW BioGraph | 12.08 (± 0.43) | 12.36 (± 0.49) | 11.93 (± 0.47) | 12.12 (± 0.51) | 12.07 (± 0.48) |
| Horizontal STS UBM | 10.77 (± 0.48) | 11.19 (± 0.57) | 10.81 (± 0.53) | 10.95 (± 0.56) | 10.93 (± 0.61) |
| Vertical STS UBM a | 11.31 (± 0.48) |
| Group | Interdevice Agreement Summary Measures | ||||
|---|---|---|---|---|---|
| Bias | SD | 95% LoA | Pearson | P Value | |
| WTW (Pentacam) vs WTW (BioGraph) | |||||
| Total | −0.26 | 0.34 | (−0.93, 0.41) | 0.743 | <.001 |
| ACD, mm | |||||
| <3.2 | −0.18 | 0.27 | (−0.71, 0.35) | 0.726 | <.001 |
| 3.2–3.4 | −0.23 | 0.40 | (−1.01, 0.55) | 0.604 | <.001 |
| 3.4+ | −0.54 | 0.26 | (−1.05, −0.03) | 0.782 | <.001 |
| WTW (Pentacam) vs STS (HiScan) | |||||
| Total | 0.91 | 0.54 | (−0.15, 1.97) | 0.536 | <.001 |
| ACD, mm | |||||
| <3.2 | 1.07 | 0.47 | (0.15, 1.99) | 0.451 | <.001 |
| 3.2–3.4 | 0.93 | 0.43 | (0.09, 1.77) | 0.650 | <.001 |
| 3.4+ | 0.41 | 0.57 | (−0.71, 1.53) | 0.392 | .08 |
| WTW (BioGraph) vs STS (HiScan) | |||||
| Total | 1.17 | 0.46 | (0.27, 2.07) | 0.644 | <.001 |
| ACD, mm | |||||
| <3.2 | 1.25 | 0.48 | (0.31, 2.19) | 0.412 | .001 |
| 3.2–3.4 | 1.16 | 0.35 | (0.47, 1.85) | 0.737 | <.001 |
| 3.4+ | 0.95 | 0.51 | (−0.05, 1.95) | 0.574 | .008 |
Repeatability of Ultrasound Biomicroscopy Measures
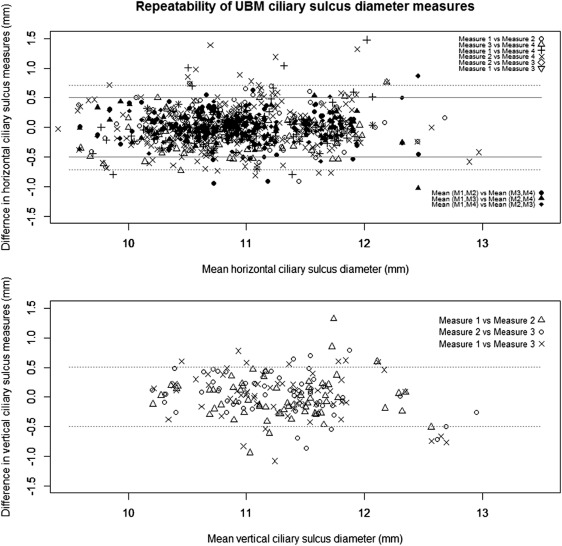
The HiScan UBM measures were less repeatable than expected, with an Sr of 0.39 mm between any 2 images and a 95% CI of ±0.76 ( Figure 3 , Top, dotted horizontal line). The Sr improved to 0.15 mm when the average of 2 measures was used ( Figure 3 , Top, solid horizontal line). Therefore, it is safe to assume that the repeatability is <0.15 mm when the average of 4 or more images was used. Similar repeatability was observed between single measures of vertical STS (Sr = 0.26 mm, Figure 3 , Bottom).
Repeatability of Horizontal White-to-White Pentacam Measures
Two images with image quality rated “OK” within the device software were available for 89 eyes from 48 study patients. The manual method for horizontal WTW assessment showed good repeatability (Sr = 0.13 mm, CoV 1%).
Agreement Between Devices
The agreement between devices was examined using Bland-Altman plots ( Figure 4 ), LoA, and Pearson correlation coefficients. The horizontal WTW measures using the Pentacam and BioGraph devices showed good agreement (г = 0.73) with some systematic bias (−0.26 mm) and relatively tight LoA (95% CI −0.93, +0.41). The horizontal WTW as measured by the Pentacam device and the STS measures showed moderate agreement (г = 0.54) with a large systematic bias (0.91 mm) and wide LoA (95% CI −0.15, 1.97). The horizontal WTW as measured by the BioGraph device with the STS measures showed moderate agreement (г = 0.64) with a larger systematic bias (1.17 mm) and wide LoA (95% CI +0.26, 2.07). The agreement between the ACD measures was better between the BioGraph and Pentacam devices than between these 2 devices and UBM (г = 0.99 vs г = 0.88/0.87).
The relationship between systematic error and noise was examined with respect to SE, ACD, and AL using ANOVA and accounting for pairs of eyes ( Table 2 ). Comparing the horizontal WTW measures by the Pentacam and BioGraph devices, the bias was significantly less in eyes with deep ACD than shallow ACD ( P = .02). The agreement was best between horizontal WTW and STS estimates in eyes with average ACD (BioGraph vs UBM, Pearson г = 0.74).
Table 3 is a device conversion table established from the results of this study and the available literature. A PubMed search was done with the following keywords:
- –
corneal diameter or white-to-white
- –
horizontal ciliary sulcus diameter or sulcus to sulcus or sulcus diameter
- –
repeatability or precision or agreement
- –
Pentacam or IOLMaster or Scheimpflug or Topography or UBM or ultrasound biomicroscopy or Orbscan or Vumax or Galilei or Lenstar or Biograph or Artemis or Hiscan


