Purpose
To evaluate a proposed method for objective measurement of vitreous inflammation using a spectral-domain optical coherence tomography (SD OCT) device in a large cohort of uveitis eyes, including pseudophakic eyes and vitrectomized eyes.
Design
Retrospective, observational cohort study.
Methods
One hundred five uveitis eyes (105 patients) with different vitreous haze score grades according to standardized protocols and corresponding SD OCT images (Cirrus HD-OCT; Carl Zeiss Meditec, Dublin, California, USA) were included. Clinical data recorded included phakic status, previous vitreoretinal surgery, and anterior chamber (AC) cells and flare. SD OCT images were analyzed using custom software that provided absolute measurements of vitreous (VIT) and retinal pigment epithelium (RPE) signal intensities, which were compared to generate a relative optical density ratio with arbitrary units (VIT/RPE-relative intensity) and compared to VHS.
Results
VIT/RPE-relative intensity showed a significant positive correlation with vitreous haze score ( r = 0.535, P < .001) that remained significant after adjusting for factors governing media clarity, such as AC cells, AC flare, and phakic status (R 2 -adjusted = 0.424, P < .001). Significant differences were also observed between the different vitreous haze score groups ( P < .001). Preliminary observation did not observe differences in VIT/RPE-relative intensity values between phakic and pseudophakic eyes (0.3522 vs 0.3577, P = .48) and between nonvitrectomized and vitrectomized eyes (0.3540 vs 0.3580, P = .52), overall and respectively for each vitreous haze score subgroup.
Conclusions
VIT/RPE-relative intensity values provide objective measurements of vitreous inflammation employing an SD OCT device. Phakic status and previous vitrectomy surgery do not appear to influence these values, although these preliminary findings need validation in future studies.
The current method for assessment of the inflammatory status in eyes with uveitis is almost entirely based on subjective clinical estimates according to standardized scales for both anterior and posterior segment. In the case of vitreous inflammation, the gold standard has been the National Eye Institute (NEI) system for grading of vitreous haze, often known as the Nussenblatt scale. This classification is based on estimation of the clarity of the fundus when viewed with the indirect ophthalmoscope and a 20 diopter lens in comparison to a set of reference photographs. The NEI vitreous haze score has been approved as a surrogate endpoint by the United States Food and Drug Administration and is used as a primary outcome measure in the majority of clinical trials in uveitis. Vitreous haze score does, however, have a number of limitations: it is subjective, with only moderate interobserver agreement ; it is noncontinuous, grading disease activity in large steps between vitreous haze score categories; and it is poorly discriminatory at the lower levels of vitreous inflammation that represent the majority of patients with active vitreous inflammation (ie, +0.5, +1 vitreous haze score) and therefore arguably a challenge for clinical assessment, particularly in clinical trial scenarios.
There is consensus in the uveitis community on the need for objective measures of inflammatory activity in sight-threatening uveitis. With this aim, a recent proof-of-concept study demonstrated that spectral-domain optical coherence tomography (SD OCT) images could be processed to obtain objective measurements of vitreous inflammation in eyes with intermediate uveitis, posterior uveitis, and panuveitis. This method was based on the determination of the signal intensity of the vitreous compartment, which was then compared to that of the retinal pigment epithelium (RPE) to generate an optical density ratio with arbitrary units that showed good correlation with vitreous haze score, but further validation was required. First, the original study was too small to allow subgroup analysis of common patient factors that might render the technique unreliable, notably phakic status or previous vitreoretinal surgery. Second, the original study employed an OCT device from a single vendor (Spectralis OCT; Heidelberg Engineering, Heidelberg, Germany), raising the possibility that the method might not be applicable across other medical systems. Third, these preliminary findings needed to be confirmed in a different patient cohort, using a different team of OCT technicians and independent analyzers to ascertain whether the method has applicability to and may be adopted by multiple end users.
To these ends this study aims to evaluate the previously proposed OCT-derived vitritis quantification method in a larger series of intermediate uveitis, posterior uveitis, and panuveitis eyes, using an alternative spectral-domain OCT platform in a geographically and demographically distinct study population. Such data would deliver an independent evaluation of an ability to obtain objective, continuous, and reproducible measurements of vitreous inflammation. A further aim is to determine the influence of phakic status or previous vitreoretinal surgery on these objective measurements.
Methods
All OCT image sets were obtained from patients attending a tertiary referral uveitis clinic (A. Adan) at Institut Clínic d’Oftalmología (ICOF), Hospital Clinic, Barcelona, Spain. Patients included in the study had intermediate uveitis, posterior uveitis, or panuveitis of different etiologies, with varying degrees of vitreous inflammation, and corresponding OCT image sets captured during routine clinical care, from a 6-year period (November 11, 2009-June 2, 2014). This study was approved by the Ethics Committee of the Hospital Clinic, Barcelona and was conducted in accordance with the Declaration of Helsinki.
Clinical Data
Demographic data collected from patients in the study included age, sex, uveitis anatomic location, uveitis etiology, current treatment, and any history of previous intraocular surgery. Clinical characteristics of study eyes collected include the following: (1) best measured visual acuity; (2) presence of keratic precipitates; (3) presence of posterior synechiae; (4) phakic status, classified as (a) phakic, (b) pseudophakic, and (c) aphakic; (5) anterior chamber (AC) activity; and (6) vitreous haze score using standardized protocols according to the NEI and Standardization of Uveitis Nomenclature (SUN) guidelines. All clinical data were collected during routine clinical care in an electronic medical records system and extracted for analysis. Only eyes with complete information of the above fields and corresponding OCT images were included in the analysis ( Supplemental Figure 1 ; Supplemental Material available at AJO.com ).
Optical Coherence Tomography Image Acquisition Protocol
All SD OCT image sets included in this study were acquired using a spectral-domain OCT system (Cirrus HD-OCT; Carl Zeiss Meditec, Dublin, California, USA) with the standard “Macular Cube” protocol. The Macular Cube protocol consists of 128 horizontally oriented B-scans acquired in a continuous, automated sequence and covers a 6 mm × 6 mm area. Each B-scan is 6 mm in length and composed of 512 equally spaced transverse sampled locations. The enhanced depth imaging mode was not used in any case, and the point of maximum sensitivity or zero delay line was maintained in the vitreous side. For the purposes of this study, only scans centered in the fovea were analyzed.
Qualitative Analysis of Optical Coherence Tomography Images
SD OCT images were qualitatively analyzed to assess the presence of (1) hyperreflective dots, larger and with greater density than background speckle noise as surrogate marker of cellular infiltrates into the vitreous ; (2) presence of epiretinal membrane preventing adequate transmission of light to the retinal pigment epithelium; and (3) severe anatomic disruption of retinal integrity and outer retinal layers/RPE status, preventing adequate delineation of the retinal pigment epithelium compartment of interest for the quantitative analysis. All cases with (2) and (3) were excluded from the subsequent quantitative analysis. Examples of clinical cases excluded are described in Supplemental Figure 2 (Supplemental Material available at AJO.com ).
Quantitative Analysis of Optical Coherence Tomography Images
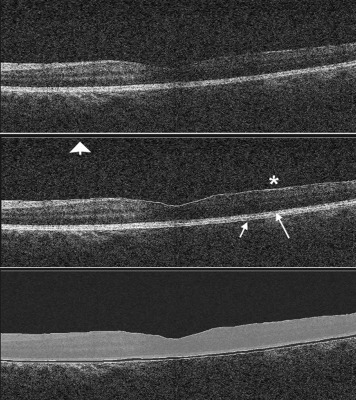
Raw SD OCT images were exported from the Cirrus HD-OCT system and imported into OCTOR (Doheny Eye Institute, Los Angeles, California, USA), custom grading software that allows manual delineation of boundaries that define the compartments of interest. In each case, boundaries were manually segmented as per a previously described protocol for 3 B-scans passing through the foveal central subfield (central subfield of the Early Treatment Diabetic Retinopathy Study chart) by an experienced grader (J.Z.V.) masked to clinical vitreous haze score values. The boundaries were as follows: (a) vitreous top, the uppermost extent of vitreous space included in the OCT image; (b) internal limiting membrane (ILM), the inner boundary of the neurosensory retina; (c) RPE-inner limit, the inner boundary of the RPE; and (d) RPE-outer limit, the outer boundary of the RPE. These boundaries delineate the following spaces: (1) vitreous, defined as the space between the vitreous top and ILM (except cases with incomplete posterior vitreous detachment, where the innermost limit of the vitreous hyaloid was chosen, as including this retrohyaloid space filled with optically hyporeflective aqueous may underestimate the absolute intensity of the compartment); and (2) RPE, defined as the space between the RPE-inner and the RPE-outer boundaries ( Figure 1 ). The intensity of all pixels included in each of these compartments was summed to generate a corresponding mean OCT intensity value for the total scanned area, described as “VIT-absolute intensity” and “RPE-absolute intensity,” respectively. Finally, an arbitrary ratio was generated with these 2 values and expressed as “VIT/RPE-relative intensity” (VIT-absolute intensity/RPE-absolute intensity).
Statistical Methods
Descriptive and frequency statistics were used to assess qualitative variables. Normality of quantitative variables (ie, VIT/RPE intensity ratios) was examined using histograms. To assess differences in VIT/RPE mean intensity between study groups, nonparametric Mann-Whitney U test and Kruskal-Wallis test were employed for 2-to-2 and ≥3 groups comparisons, respectively. Correlation between VIT/RPE intensity ratios and vitreous haze score was analyzed using nonparametric Spearman test, and a multivariable regression model was applied to assess the effects of clinical characteristics on SD OCT intensity values. Visual acuity (VA) measured in Snellen notation was converted to logMAR (logarithm of the minimal angle of resolution) equivalents for the purpose of statistical analysis. VA values recorded as counting fingers (CF), hand movements (HM), and perception of light (PL) were converted to 2.1, 2.4, and 2.7 logMAR, respectively. A P value of less than .05 was considered statistically significant. All statistical analysis was performed using SPSS 15.0 software (SPSS Inc, Chicago, Illinois, USA).
Results
Baseline Characteristics
Among the cohort of patients seen in the uveitis unit in the study period, 105 eyes with intermediate uveitis, posterior uveitis, or panuveitis had complete clinical data with corresponding OCT images and were included in the study ( Supplemental Figure 1 ; Supplemental Material available online at AJO.com ). Demographics and baseline characteristics of study eyes are summarized in Table 1 , disclosed by total eyes and eyes with and without vitritis (vitritis defined as vitreous haze score ≥+0.5) for comparison purposes.
| Total Uveitis Eyes (N = 105) | Uveitis Eyes No Vitritis (N = 54) | Uveitis Eyes Vitritis (N = 51) | |
|---|---|---|---|
| Age, mean ± SD | 45.3 ± 16.4 | 46.6 ± 14.8 | 44.0 ± 17.9 |
| VA, mean ± SD (logMAR) | 0.30 ± 0.38 | 0.28 ± 0.4 | 0.33 ± 0.35 |
| Phenotypic diagnosis, no. (%) | |||
| Behçet | 24 (22.8) | 14 (25.9) | 10 (19.6) |
| Birdshot | 22 (20.9) | 10 (18.5) | 12 (23.5) |
| Sarcoid | 14 (13.3) | 9 (16.6) | 5 (9.8) |
| Nondifferentiated | 11 (10.4) | 3 (5.5) | 8 (15.6) |
| Pars planitis | 8 (7.6) | 5 (9.2) | 3 (5.8) |
| VKH | 6 (5.7) | 2 (3.7) | 4 (7.8) |
| Multiple sclerosis | 4 (3.8) | 1 (1.8) | 3 (5.8) |
| Other | 16 (15.2) | 10 (18.5) | 6 (11.7) |
| Uveitis anatomic classification, no. (%) | |||
| Intermediate | 34 (32.3) | 14 (25.9) | 20 (39.2) |
| Posterior | 36 (34.2) | 19 (35.1) | 17 (33.3) |
| Panuveitis | 35 (33.3) | 21 (38.8) | 14 (27.4) |
| Keratic precipitates, no. (%) | 11 (10.4) | 4 (7.4) | 7 (13.7) |
| Posterior synechiae, no. (%) | 7 (6.6) | 5 (9.2) | 2 (3.9) |
| Phakic status, no. (%) | |||
| a. Phakic | 71 (67.5) | 35 (64.7) | 36 (70.5) |
| Clear lens | 47 (44.7) | 22 (40.7) | 25 (49.0) |
| Cataract | 24 (22.8) | 13 (24.0) | 11 (21.5) |
| b. Pseudophakic | 30 (28.5) | 16 (29.6) | 14 (27.4) |
| c. Aphakic | 4 (3.8) | 3 (5.5) | 1 (1.9) |
| d. Posterior capsular opacification, no. (%) | 6 (5.7) | 3 (5.5) | 3 (5.8) |
| AC cells, no. (%) | |||
| 0 | 85 (80.9) | 52 (96.2) | 33 (64.7) |
| 0.5+ | 8 (7.6) | 2 (3.7) | 6 (11.7) |
| 1+ | 8 (7.6) | 0 (0) | 8 (15.6) |
| 2+ | 3 (2.8) | 0 (0) | 3 (5.8) |
| 3+ | 0 (0) | 0 (0) | 0 (0) |
| 4+ | 1 (0.9) | 0 (0) | 1 (1.9) |
| AC flare, no. (%) | |||
| 0 | 96 (91.4) | 54 (100) | 42 (82.3) |
| 1+ | 6 (5.7) | 0 (0) | 6 (11.7) |
| 2+ | 2 (1.9) | 0 (0) | 2 (3.9) |
| 3+ | 1 (0.9) | 0 (0) | 1 (1.9) |
| 4+ | 0 (0) | 0 (0) | 0 (0) |
| Vitreous haze score, no. (%) | |||
| 0 | 54 (51.4) | 54 (100) | 0 (0) |
| 0.5+ | 21 (20) | 0 (0) | 21 (41.1) |
| 1+ | 18 (17.1) | 0 (0) | 18 (35.2) |
| 2+ | 9 (8.5) | 0 (0) | 9 (17.6) |
| 3+ | 3 (2.8) | 0 (0) | 3 (5.8) |
| 4+ | 0 (0) | 0 (0) | 0 (0) |
Optical Coherence Tomography–Derived Measurements of Vitreous Intensity
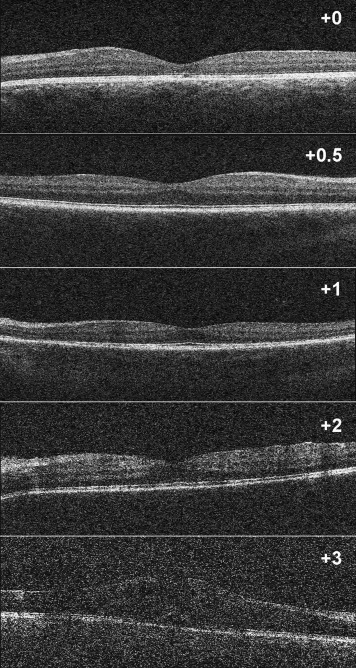
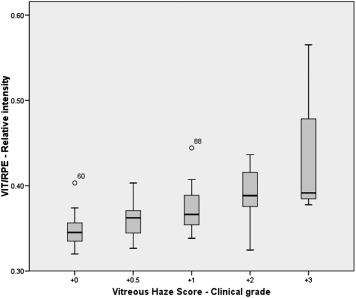
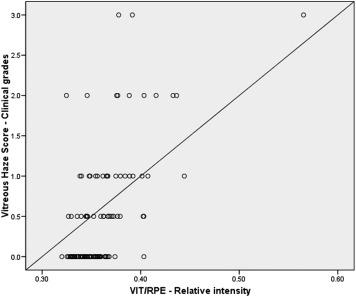
The OCT-derived VIT/RPE-relative intensity measurements for each vitreous haze score grade are represented in Figures 2 and 3 and Table 2 . Significant differences were observed between eyes without vitritis (vitreous haze score = 0, median 0.3456, interquartile range 0.024) and eyes with vitritis (vitreous haze score ≥+0.5, median 0.3670, interquartile range 0.040) ( P < .001). Differences in VIT/RPE-relative intensity values were also significant between study eyes, disclosed by vitreous haze score clinical grade ( P < .001) ( Figure 3 ). A significant correlation was observed between VIT/RPE-relative intensity measurements and vitreous haze score clinical grade ( r = 0.535, P < .001), AC cells ( r = 0.246, P = .01), and AC flare ( r = 0.215, P = .02). No significant differences were observed for VA ( r = 0.182, P = .06); however, once eyes with very poor VA were excluded from analysis (3 eyes excluded: CF, n = 2, and HM, n = 1), this correlation was also significant ( r = 0.198, P = .04). Figure 4 represents the correlation between VIT/RPE-relative intensity values and vitreous haze score clinical grades. After adjusting for factors governing media clarity (such as AC cells, AC flare, and phakic status) in a stepwise multivariable model, VIT/RPE-relative intensity values remained independently associated with vitreous haze score clinical grades (R 2 -adjusted = 0.424, P < .001).
| Vitreous Haze Score | VIT/RPE Relative Intensity (Median) | P Value a |
|---|---|---|
| 0 | 0.3456 IQR 0.022 (n = 54) | (reference) |
| 0.5+ | 0.3623 IQR 0.027 (n = 21) | .009 |
| 1+ | 0.3663 IQR 0.036 (n = 18) | <.001 |
| 2+ | 0.3884 IQR 0.063 (n = 9) | .002 |
| 3+ | 0.3915 IQR n/a (n = 3) | <.001 |
| 4+ | n/a (n = 0) | n/a |
| Total (n) | 105 |
Influence of Phakic Status
Among the 105 eyes included in the study, 69 were phakic (65.7%), 32 were pseudophakic (30.5%), and 4 were aphakic (3.8%). No significant differences were observed in VIT/RPE-relative intensity values between phakic (median = 0.3522, interquartile range = 0.028) and pseudophakic eyes (median = 0.3577, interquartile range = 0.027) ( P = .48). When eyes were categorized by vitreous haze score clinical grades, no significant differences were observed in the VIT/RPE-relative intensity values between phakic and pseudophakic eyes ( Figure 5 ) with a vitreous haze score of 0 (median = 0.3461, interquartile range = 0.021 vs median = 0.3483, interquartile range = 0.025, P = 0.91), +0.5 (median = 0.3595, interquartile range 0.027 vs median = 0.3646, interquartile range = 0.031, P = .91), or +1 (median = 0.3642, interquartile range = 0.037 vs median = 0.3658, interquartile range = 0.029, P = .87), respectively ( Table 3 ). For purposes of clarity, aphakic eyes (n = 4) and eyes with vitreous haze score ≥2 (n = 12) have not been included in Figure 5 .


