Purpose
To compare optical coherence tomography (OCT) retinal nerve fiber layer (RNFL) thickness, specificity, and glaucoma discriminating ability prior and following adjustment to the fovea-disc angle axis.
Design
Cross-sectional observational study.
Methods
Fovea-disc angle was measured in 282 healthy subjects (normative database), 46 nonglaucomatous myopic subjects, and 86 glaucomatous subjects. The fovea-disc angle was determined using the Cirrus PanoMap feature after registering the macular ocular fundus image to the peripapillary ocular fundus image. RNFL prediction limits, specificity, and glaucoma discrimination ability were determined before and after adjustment to fovea-disc angle axis.
Results
The mean fovea-disc angles were 7.4 ± 4.1 degrees (normative database), 7.1 ± 4.3 degrees (myopic subjects), and 7.6 ± 4.2 degrees (glaucomatous subjects) (all P > .05). Standard and fovea-disc angle–adjusted RNFL thicknesses showed small significant differences in quadrants and larger differences in clock-hour sectors (all P < .05), without consistent patterns in the direction of the change. The specificity remained unchanged for all parameters in normative database subjects after adjustment to fovea-disc angle. The number of sectors with improved specificity and those with worsened specificity did not differ significantly in the first (8 vs 6), second (5 vs 8), and random (6 vs 7) normative database half (all P > .05). In myopic subjects, the specificity improved and worsened in 4 sectors in each case. The glaucoma discriminating ability significantly increased in 6 sectors and decreased in 5 others.
Conclusion
Correcting the RNFL profiles using the fovea-disc angle axis had no consistent effect on the thickness, specificity, and glaucoma diagnostic performance of RNFL parameters. This phenomenon may be specific to different OCT platforms.
Assessment of the ocular fundus with ophthalmoscopy, slit-lamp biomicroscopy, and imaging using photography or fundus scanning devices is a critical component of glaucoma diagnosis and follow-up assessment. Although fundus photography remains an important tool in glaucoma diagnosis and follow-up, its value is limited by its qualitative and subjective interpretation. For these reasons, fundus photography may be less useful than digital imaging modalities, such as optical coherence tomography (OCT), that provide objective and reproducible quantitative information on retinal layers (ie, retinal nerve fiber layer, RNFL) and the optic disc. The ocular fundus has a number of anatomic landmarks, notably the optic disc and the fovea. Automated detection of these 2 major landmarks is critical and usually is the initial step for registration and subsequent processing of retinal images on digital imaging modalities such as OCT. These 2 landmarks are also spatially interrelated. Despite substantial interindividual differences, mean values of fovea-disc angle ranging between −5.6 degrees and 7.7 degrees have been reported using various techniques.
Fovea-disc distance and angle have recently attracted some research interest, particularly in the field of glaucoma. For example, in a recent perspective paper that evaluated current spectral-domain (SD) OCT methods for assessing the optic nerve head (ONH) topography, it was proposed that neuroretinal rim as well as peripapillary RNFL thickness parameters be landmarked to the fovea–Bruch membrane opening (BMO) center axis instead of the horizontal meridian. Not doing so, it was hypothesized, likely decreases both the diagnostic performance of these SD OCT structural parameters and the structure-function relationship. Subsequently, He and associates showed that minimum rim width (MRW) and clock-hour RNFL values are significantly affected following this process in normotensive and hypertensive glaucomatous patients. Another study in nonglaucomatous myopic subjects indicated that fovea-disc angle was a significant determinant of peripapillary RNFL thickness. Whether landmarking RNFL thickness measurements to fovea-BMO center axis truly improves the diagnostic performance of OCT RNFL parameters remains controversial. In this study, we investigated the effect of landmarking peripapillary RNFL to fovea-disc angle on RNFL thickness, RNFL thickness specificity, and the glaucoma diagnostic accuracy of RNFL thickness. The study was designed to test the hypothesis that such a correction improves the diagnostic performance because the fixation axis becomes closer to the optical axis.
Methods
Study Dataset
The study was approved by the University of North Carolina at Chapel Hill Institutional Review Board, adhered to the tenets of the Declaration of Helsinki, and conformed to Health Insurance Portability and Accountability Act regulations. The OCT RNFL data used in this study are those of 282 healthy subjects from the Cirrus HD-OCT normative database, 86 glaucomatous patients (46 mild, 23 moderate, 17 severe by Hodapp-Anderson-Parrish criteria ; visual field mean deviation: −7.4 ± 6.3 dB) from the Ganglion Cell Analysis FDA registration (GCA) study, and 49 nonglaucomatous myopic subjects (mean spherical equivalent: −4.6 ± 2.1 dB) from another earlier study.
Data Handling
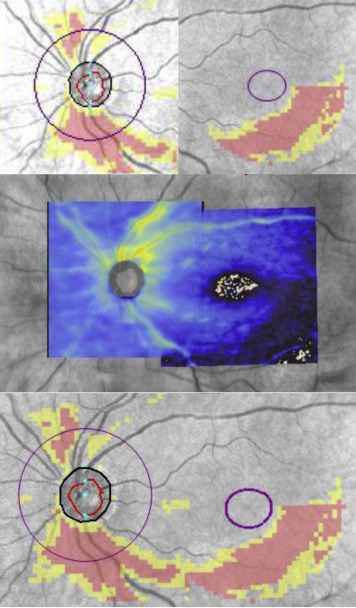
Temporal-superior-nasal-inferior-temporal (TSNIT) profiles were extracted and used to generate average, quadrant, and clock-hour RNFL thicknesses. For each subject, the prototype Cirrus PanoMap feature and other custom analysis tools were used to register the macular OCT fundus image to the peripapillary ocular fundus image. An illustrative example of the PanoMap export image is shown in Figure 1 . The fovea-disc angle was determined using the PanoMap feature as follows: the affine transform parameters used by the algorithm were used to calculate the relative positions of the optic disc and macular centers for fovea-disc angle calculation. This was also done externally in Matlab using the disc positions and the affine transform parameters outputted from the registration exerciser.
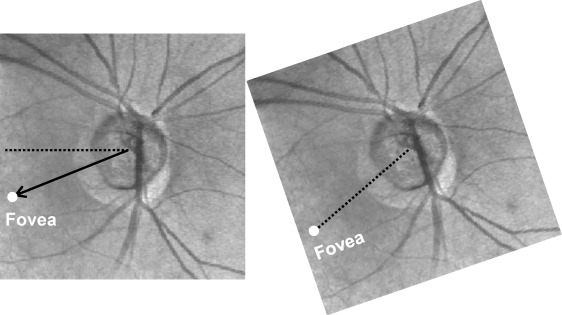
The fovea-disc angle, determined by the horizontal meridian through the center of the ONH and the axis passing through the fovea and the ONH center ( Figure 2 , Left) was used to correct the start of the TSNIT profile to a common landmark ( Figure 2 , Right). One set of nonparametric normative limits (1%, 5%, and 95%) was generated for both the standard and the corrected data from all of the normal eyes. Then halves of the normal eyes (first half, second half, and a randomly selected half) were selected to generate a second set of 5% limits. The remaining halves of the eyes from each set were used to test the specificities. The myopic subjects were also used to separately test the 95% specificity on the full set of normative limits.
The locations of the RNFL TSNIT profile peaks and the blood vessel bundle peaks for the normative database and nonglaucomatous eyes were also determined using custom code. The RNFL peak index was found by running a localized peak finder algorithm on the RNFL TSNIT profile for each subject and then prioritizing the peaks that were closest to the canonical average RNFL profile from averaging the 282 normative database RNFL TSNIT profiles together (custom MATLAB code). This process was not performed in glaucomatous eyes because it was not likely to work very well owing to loss of thickness in the peaks. Blood vessel peaks were found by deriving a blood vessel map, extracting the TSNIT profile of the blood vessel map around the same RNFL TSNIT circle, and running a similar peak finder to the RNFL peak.
Statistical Analysis
All statistical analyses in this investigation were performed in MATLAB (R2012B). Paired t tests were used to compare standard and corrected RNFL data after landmarking to fovea-BMO. Receiver operating characteristics (ROC) analyses, including area under the curve (AUC) values, were calculated for each sector. Pairwise comparisons between standard and corrected AUCs were computed using the DeLong method. The correlation between the locations of the RNFL peaks and both the fovea-disc angle and the blood vessel peaks were compared by calculating the Pearson correlation coefficient. Statistical significance for tests was set at P < .05.
Results
Effect of Fovea-Disc Angle Axis Correction on Retinal Nerve Fiber Layer Thickness
The fovea-disc angles across the study populations were 7.4 ± 4.2 degrees for all 3 study groups combined, 7.4 ± 4.1 degrees in the 282 subjects from the Cirrus normative database, 7.6 ± 4.2 degrees for the glaucomatous subjects, and 7.1 ± 4.3 degrees in the nonglaucomatous myopic subjects (all P > .05). Figure 3 shows the fovea-disc angle of 6 different eyes, as indication of fovea-disc variability among individuals. The 1%, 5%, and 95% normative limits for the standard and fovea-disc-corrected RNFL TSNIT profiles were calculated from the full normative database set (n = 282) and are illustrated in Figure 4 at a reference age of 46.7 years (the mean age of the normative database population). The mean TSNIT in each case is also shown for illustration purposes. Overall, the net effect of the correction on the limits was a “bulk” shift in the size of the mean fovea-disc angle (7.4 degrees) to the right. The same analysis performed in nonglaucomatous myopic subjects and in subjects with glaucoma yielded the same trends as in the normative database set; individual examples of RNFL TSNIT profile against the age-corrected normative limits in these 2 groups of subjects are shown in Supplemental Figure 1 (supplemental material available at AJO.com ).
The mean thicknesses of the 17 RNFL parameters in the 282 subjects from the normative database prior to and following fovea-disc correction are presented in Figure 5 . No changes in the average RNFL values were observed after correction, the correction being merely a circular shift. Small but significant changes were observed in the RNFL quadrant thicknesses, whereas larger significant changes occurred in clock-hour thicknesses (all P < .05). Similar trends were observed in the standard deviation and coefficient of variation values ( Supplemental Figure 2 , available at AJO.com ). However, there were no discernible spatial patterns in the direction of the change in the various RNFL parameters, as some increased while others decreased.
Effect of Fovea-Disc Angle Axis Correction on False-Positive Rates and Glaucoma Diagnostic Accuracy
The false-positive rates using the 95% limits derived from the normative database subjects (all 282, first half, second half, or random half) and the nonglaucomatous myopic subjects performed with and without fovea-disc correction failed to show a consistent pattern as to which method has a better specificity ( Table 1 ). The pre- and post-fovea-disc correction specificity of RNFL thickness remained the same (4.96%) for all 17 RNFL parameters in the 282 subjects from the normative database. In the first half, the specificity remained unchanged for global RNFL and 2 clock hours following fovea-disc correction; it improved in 3 quadrants and 5 clock hours but worsened in 1 quadrant and 5 other clock hours. In the second half, the specificity worsened in 3 quadrants and 5 clock hours, improved in 1 quadrant and 4 clock hours after correction, and did not change in 3 clock hours. When fovea-disc correction was applied to the random half of the normative database subjects, the specificity remained the same in 3 clock hours, decreased in 2 quadrants and 5 clock hours, and increased in 2 other quadrants and 4 clock hours. For the group of nonglaucomatous myopic subjects, the specificity did not change for global RNFL, in 1 quadrant and 7 clock hours, it decreased in 2 quadrants and 2 clock hours, and it increased in 1 quadrant and 3 clock hours.
| Parameter | Normals | 1 st Half | 2 nd Half | Random Half | Myopic Subjects | |||||
|---|---|---|---|---|---|---|---|---|---|---|
| Std | FDA | Std | FDA | Std | FDA | Std | FDA | Std | FDA | |
| Global | 4.96 | 4.96 | 6.38 | 6.38 | 0.71 | 0.71 | 9.22 | 9.22 | 16.33 | 16.33 |
| Temporal quadrant | 4.96 | 4.96 | 12.77 | 9.93 | 0.71 | 2.13 | 4.26 | 4.96 | 6.12 | 4.08 |
| Superior quadrant | 4.96 | 4.96 | 7.09 | 9.93 | 4.96 | 3.55 | 2.84 | 2.13 | 14.29 | 12.24 |
| Nasal quadrant | 4.96 | 4.96 | 7.09 | 5.67 | 2.84 | 4.26 | 3.55 | 5.67 | 22.45 | 22.45 |
| Inferior quadrant | 4.96 | 4.96 | 5.67 | 4.96 | 2.84 | 4.26 | 7.80 | 6.38 | 10.20 | 12.24 |
| Clock hour 9 | 4.96 | 4.96 | 11.35 | 10.64 | 2.84 | 3.55 | 2.13 | 2.13 | 10.20 | 10.20 |
| Clock hour 10 | 4.96 | 4.96 | 17.02 | 12.06 | 0.00 | 0.00 | 7.80 | 6.38 | 2.04 | 4.08 |
| Clock hour 11 | 4.96 | 4.96 | 14.89 | 17.02 | 0.00 | 0.00 | 9.22 | 4.26 | 4.08 | 4.08 |
| Clock hour 12 | 4.96 | 4.96 | 1.42 | 2.84 | 7.80 | 12.77 | 0.00 | 0.00 | 8.16 | 12.24 |
| Clock hour 1 | 4.96 | 4.96 | 4.26 | 2.13 | 7.09 | 9.93 | 4.96 | 2.13 | 28.57 | 16.33 |
| Clock hour 2 | 4.96 | 4.96 | 5.67 | 4.96 | 4.96 | 5.67 | 4.96 | 6.38 | 22.45 | 22.45 |
| Clock hour 3 | 4.96 | 4.96 | 3.55 | 4.26 | 6.38 | 4.96 | 3.55 | 4.26 | 6.12 | 6.12 |
| Clock hour 4 | 4.96 | 4.96 | 5.67 | 5.67 | 4.96 | 4.96 | 2.84 | 2.84 | 10.20 | 6.12 |
| Clock hour 5 | 4.96 | 4.96 | 0.71 | 2.84 | 10.64 | 11.35 | 4.26 | 2.84 | 22.45 | 22.45 |
| Clock hour 6 | 4.96 | 4.96 | 3.55 | 3.55 | 9.22 | 8.51 | 7.80 | 5.67 | 12.24 | 12.24 |
| Clock hour 7 | 4.96 | 4.96 | 10.64 | 7.80 | 3.55 | 2.13 | 7.09 | 12.77 | 2.04 | 6.12 |
| Clock hour 8 | 4.96 | 4.96 | 3.55 | 7.80 | 6.38 | 3.55 | 2.84 | 5.67 | 2.04 | 2.04 |
The results of the pairwise comparison of AUC values of the 17 RNFL measured before and after fovea-disc correction are presented in Table 2 . The AUCs of 6 RNFL parameters (global, superior and inferior quadrants, and clock hours 9, 1, and 5) showed no significant differences (all P > .05) following the correction. The temporal and nasal quadrants significantly improved their AUCs following fovea-disc correction, but the AUCs were only fair (0.70–0.79). Among the remaining 9 clock hours, the AUC increased in 4 but decreased in 5 of them, without consistent pattern with regard to direction of the change.
| RNFL Parameter | Regular AUC | Corrected AUC | P |
|---|---|---|---|
| Global | 0.9618 | 0.9618 | 1.00 |
| Temporal quadrant | 0.7346 | 0.7583 | <.01 |
| Superior quadrant | 0.9576 | 0.9579 | .90 |
| Nasal quadrant | 0.6928 | 0.7181 | <.01 |
| Inferior quadrant | 0.9630 | 0.9594 | .14 |
| Clock hour 9 | 0.5880 | 0.5689 | .18 |
| Clock hour 10 | 0.7825 | 0.7300 | <.01 |
| Clock hour 11 | 0.9091 | 0.8718 | <.01 |
| Clock hour 12 | 0.8780 | 0.9146 | <.01 |
| Clock hour 1 | 0.8800 | 0.8787 | .90 |
| Clock hour 2 | 0.7498 | 0.7901 | <.01 |
| Clock hour 3 | 0.5280 | 0.5658 | <.01 |
| Clock hour 4 | 0.6328 | 0.5728 | <.01 |
| Clock hour 5 | 0.8428 | 0.8291 | .13 |
| Clock hour 6 | 0.9178 | 0.8946 | <.01 |
| Clock hour 7 | 0.9507 | 0.9675 | <.01 |
| Clock hour 8 | 0.7266 | 0.8466 | <.01 |
Stay updated, free articles. Join our Telegram channel

Full access? Get Clinical Tree


