Purpose
To evaluate the response of the lacrimal function unit in Sjögren syndrome (SS)-associated dry eye patients exposed to 2 simulated daily life environmental conditions.
Design
Prospective crossover pilot study.
Methods
Fourteen female SS dry eye patients were exposed for 2 hours to a controlled normal condition (23 C, 45% relative humidity, and air flow 0.10 m/s) and a controlled adverse condition that simulates desiccating stress (23 C, 5% relative humidity, and air flow 0.10 m/s). The following dry eye tests were performed before and after the exposure: tear osmolarity, phenol red thread test, conjunctival hyperemia, fluorescein tear break-up time, corneal fluorescein staining, conjunctival lissamine green staining, and Schirmer test. Levels of 16 molecules were analyzed in tears by multiplex immunobead analysis.
Results
Clinical evaluation showed lacrimal functional unit impairment after the desiccating stress: significantly increased tear osmolarity (315.7 ± 3.0 vs 327.7 ± 5.1 mOsm/L, P = .03), conjunctival hyperemia (1.3 ± 0.1 vs 1.6 ± 0.1, P = .05), and corneal staining in temporal (3.5 ± 0.5 vs 4.7 ± 0.4, P = .01) and nasal (3.6 ± 0.5 vs 4.5 ± 0.5, P = .04) areas. Tear concentrations increased for interleukin-1 receptor antagonist (16 557.1 ± 4047.8 vs 31 895.3 ± 5916.5 pg/mL, P = .01), interleukin-6 (63.8 ± 20.2 vs 111.5 ± 29.6 pg/mL, P = .02), interleukin-8 (2196.1 ± 737.9 vs 3753.2 ± 1106.0 pg/mL, P = .03), and matrix metalloproteinase-9 (101 515.6 ± 37 088.4 vs 145 867.1 ± 41 651.5 pg/mL, P = .03). After the simulated normal condition, only a significant increase in nasal corneal staining (2.9 ± 0.5 vs 3.6 ± 0.5, P = .03) was observed.
Conclusions
Even a short exposure to a desiccating environment can produce a significant deterioration of the lacrimal function unit in female SS dry eye patients. The often unnoticed exposure to these conditions during daily life may increase inflammatory activity rapidly, triggering an ocular surface deterioration.
Dry eye disease is characterized by ocular discomfort, visual disturbance, and tear film instability, as well as increased tear film osmolarity and lacrimal functional unit inflammation. It is considered one of the most common eye disorders among adults worldwide. Its prevalence has been estimated to be 4.34% in men and 7.8% in women in the United States. It is also one of the main reasons for seeking eye care among older people because its overall risk rises by 1.06 for each increased decade. Sjögren syndrome (SS) is a chronic systemic autoimmune disease characterized by lymphocytic infiltration of the exocrine glands and mucosal epithelia, resulting in dry eye as well as dry mouth. This condition causes one of the most severe types of dry eye disease; the prevalence of its primary type varies greatly, from 0.09% to 2.7% depending on the diagnostic criteria used. However, what is really evident is that SS has a strong female propensity, with ratios (female to male) as high as 20:1 reported in some populations.
Ocular discomfort (including dry eye feeling) is the second most reported symptom in artificially created environments, where people living in urban areas spend most of their time. These indoor environments tend to alter the tear film because of their low humidity, and high air flow occurring inside conventional buildings, airplanes, and vehicles also tends to produce dry eye. The use of visual display terminals has grown exponentially worldwide, which further negatively impacts dry eye prevalence. The percentage of office workers using these devices and being diagnosed with dry eye has increased up to 10% and 21% in male and female Japanese office workers, respectively. Adverse environmental conditions could trigger the exacerbation of properly managed dry eye patients or borderline subjects. Therefore, our research group and others have studied the clinical and tear changes occurring in dry eye patients after exposing them to several desiccating conditions to evaluate how the lacrimal functional unit responds to a controlled adverse environment. However, we were not able to find in the literature reports addressing the variation of tear molecules occurring only in SS-associated dry eye patients when being exposed to controlled adverse conditions, in spite of the following 2 well-known facts: first, inflammation plays a major role in dry eye disease ; and second, concentrations of some tear molecules in severe dry eye patients are consistently different from those of healthy subjects.
The analysis of the changes occurring in tear molecules of SS dry eye patients could be interesting from a therapeutic viewpoint, because this biochemical assessment could provide information regarding the mechanism of the acute exacerbations that these severe dry eye patients frequently suffer. Consequently, the purpose of the present study was to analyze how the lacrimal functional unit of SS dry eye patients is affected, from a clinical and biochemical standpoint, after exposing them to desiccating conditions while performing daily living tasks within an environmental chamber.
Methods
Participants
This prospective crossover pilot study adhered to the tenets of the Declaration of Helsinki and was approved by the University of Valladolid Ethics Committee. All candidates provided informed consent. The study was double masked and the same examiner always performed the clinical tests. Dry eye patients were recruited among level 3, as classified by the International Dry Eye Workshop dry eye severity grading scheme.
During a preliminary visit, the recruited SS dry eye patients were screened for the following inclusion criteria: Ocular Surface Disease Index score ≥33 and a corneal fluorescein staining ≥grade 2 (Oxford scale). Patients showing a corneal fluorescein staining grade 2 needed a tear break-up time <3 seconds to be included in the study following severe dry eye diagnosing criteria recently established by Baudouin and associates. The recruited SS dry eye patients had been previously diagnosed with SS following the American European Consensus Group criteria. We included only female patients to prevent misinterpretation of data because of the female-to-male prevalence ratio reported in SS. Exclusion criteria were pregnancy or nursing, contact lens wear, any ocular surgery within the last 6 months, any acute or chronic ocular disease other than dry eye, concomitant allergies (even if mild), and any systemic anomaly (except SS) that contraindicated being subjected to any environmentally controlled condition. Patients were not recruited if they were using topical cyclosporine A eye drops within 3 months prior to the screening visit and/or topical corticosteroids within 1 month prior to that preliminary visit. Any other topical treatment was an exclusion criterion. Only artificial tears and lubricants were allowed to be used as needed. All participants were instructed not to instill any eye drop within the 4 hours prior to any evaluation. The eye having more severe corneal fluorescein staining was selected.
Environmental Conditions
All patients were exposed for 2 hours to 2 different environmental conditions in 2 different sessions while performing near vision tasks (reading, playing cards, etc), within an environmental chamber located inside the Controlled Environmental Research Laboratory (University of Valladolid, Valladolid, Spain). The environmental conditions were the following: (1) simulated adverse condition of 23 C, 5% relative humidity, and a low air flow of 0.10 m/s; and (2) simulated normal condition of 23 C, 45% relative humidity, and 0.10 m/s air flow. The order of the exposure to each condition was randomized and separated by 2–5 days.
Examination Procedure
All individuals were evaluated twice: immediately before and immediately after the 2-hour exposure. The examinations were performed in the sequence outlined below, with a 2- to 5-minute interval between tests.
- (1)
Modified Single-Item Score Dry Eye Questionnaire (Simmons PA. IOVS, 2003;44. ARVO E-Abstract. B287). This questionnaire assesses the ocular discomfort due to symptoms of dryness, ranging from “none” to “severe” (0–4 scale); however, we added a visual analog scale (0–10 scale) to increase test sensitivity as previously performed, and evaluated the following items: dryness, grittiness, stinging, pain, itching, sensitivity to light, and blurred vision. We averaged all items to compute the total modified Single-Item Score Dry Eye Questionnaire score. Thus, the maximum possible score was 10.
- (2)
Tear osmolarity. This was assessed using the TearLab osmometer (TearLab Corporation, San Diego, California, USA).
- (3)
Phenol red thread test (Zone Quick Test; Menicon Company Ltd, Nagoya, Japan). The thread was placed over the external canthus, and the length of the wetted thread was read 15 seconds later.
- (4)
Conjunctival hyperemia. Nasal and temporal bulbar areas were assessed independently based on the Efron scale. The final score was the average of the values.
- (5)
Tear sample collection. A 2 μL tear sample was collected from the external ocular canthus using a glass capillary tube (Drummond Scientific, Broomall, Pennsylvania, USA), avoiding reflex tearing as much as possible. Samples were diluted 1/10 in a 0.5 mL microtube (Sarstedt AG & Co, Nümbrecht, Germany) containing ice-cold Cytokine Assay Buffer (Merck Millipore, Millipore Iberica, Madrid, Spain) and frozen at −80 C until analysis.
- (6)
Tear break-up time. This was defined as the time between the last of 3 blinks and the appearance of the first dry spot after instillation of 5 μL of 2% sodium fluorescein. This procedure was repeated 3 times, and the final tear break-up time value was the average.
- (7)
Corneal fluorescein staining. This was evaluated using a cobalt-blue filter over the light source slit-lamp biomicroscope (SL-8Z; Topcon Corp, Tokyo, Japan) and a yellow Wratten #12 filter (Eastman Kodak, Rochester, New York, USA) 2 minutes after instillation of 5 μL of 2% sodium fluorescein. The Oxford (0–5 score) and the Baylor schemes were used for assessment.
- (8)
Conjunctival lissamine green staining. Lissamine green strips (GreenGlo; HUB Pharmaceuticals, LLC, Rancho Cucamonga, California, USA) were wetted with 25 μL sodium chloride and then gently applied into the inferior fornix. One minute later, staining was evaluated following the Oxford scheme.
- (9)
Schirmer test without topical anesthesia. One Schirmer sterile strip (Tearflo; HUB Pharmaceuticals, LLC) was placed in the lateral canthus of the inferior lid margin. The length of wetting was measured after 5 minutes, with eyes closed.
Analysis of Tear Molecules
Two commercial immunobead-based arrays were used to analyze 16 molecules in tear samples with Luminex IS-100 equipment (Luminex Corporation, Austin, Texas, USA). The concentrations of epidermal growth factor (EGF), chemokine (C-X3-C motif) ligand 1 (CX3CL1)/fractalkine, interferon (IFN)-γ, interleukin (IL)-1β, IL-2, IL-6, chemokine (C-X-C motif) ligand 8 (CXCL8)/IL-8, IL-10, IL-12p70, IL-17A, IL-1 receptor antagonist (IL-1RA), chemokine (C-X-C motif) ligand 10 (CXCL10)/interferon gamma-induced protein 10 (IP-10), chemokine (C-C motif) ligand 5 (CCL5)/regulated on activation, normal T-cell expressed and secreted (RANTES), tumor necrosis factor (TNF)-α, and vascular endothelial growth factor (VEGF) were measured simultaneously with a 15-plex assay (HCYTO-60K 15X-Milliplex; Millipore Iberica, Madrid, Spain). The matrix metalloproteinase-9 (MMP-9) concentration was measured in a separate assay with an MMP-9 single-plex assay (HMMP2-55K Panel 2, Milliplex; Millipore Iberica), which recognized both the MMP-9 inactive zymogen and MMP-9 active forms. The samples were analyzed following the manufacturer’s protocol, as previously described. The minimum detectable concentrations (in pg/mL) for molecules analyzed were as follows: IFN-γ and TNF-α, 0.1; CXCL8/IL-8 and IL-17A, 0.2; IL-2, IL-6, and IL-10, 0.3; IL-1β and IL-12p70, 0.4; CCL5/RANTES, 1; CXCL10/IP-10, 1.2; EGF, 2.7; IL-1RA, 2.9; VEGF, 5.8; CX3CL1/fractalkine, 6; and MMP-9, 10. Data were stored and analyzed with the “Bead View Software” (Upstate-Millipore Corporation, Watford, UK). In some samples, the assayed molecule was undetectable. To include those samples in the statistical analysis, we assigned each the minimum detectable value provided by the assay manufacturer, as previously reported. However, molecules that were detected in less than 50% of the samples were not statistically analyzed any further.
Data Analysis
Data were expressed as the mean ± standard error of the mean (SEM) regardless of data normality. Statistical analyses were performed using the Statistical Package for the Social Sciences software (SPSS 19.0 for Windows; SPSS Inc, Chicago, Illinois, USA) and R software by a licensed statistician. For comparisons between clinical dry eye tests performed before and after the environmental exposure, as well as before the exposure during both conditions, the Wilcoxon test was used. For tear molecule concentrations, we performed the same comparisons, but we used a parametric t test after performing a logarithmic transformation (log 2) as previously performed. Spearman correlation coefficients between parameters were calculated to determine what variables could predict the inflammatory response and to explore relationships between the changes in tear molecule concentrations and clinical variables. Two-sided P values ≤ .05 were considered statistically significant.
Results
Screening Visit
A total of 14 SS dry eye female subjects (aged 58.9 ± 2.8 years; range, 40–75) were recruited. Mean SS disease duration was 8.1 ± 3.8 years. At inclusion visit, the mean Ocular Surface Disease Index, corneal fluorescein staining (Oxford scheme), and tear break-up time values were 57.0 ± 5.1 units, 2.7 ± 0.3 units, and 1.6 ± 0.2 seconds, respectively. Four out of the 14 SS patients recruited were also diagnosed with meibomian gland disease.
Clinical Tests
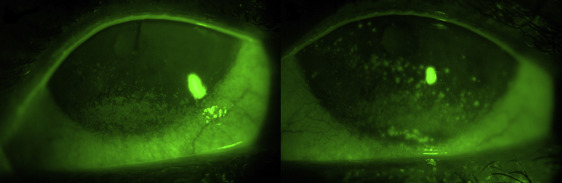
Clinical test outcomes are summarized in Table 1 . There were no significant differences between dry eye test scores obtained before undergoing either exposure. After 2-hour exposure to the adverse condition, SS dry eye patients experienced a significant worsening for tear osmolarity ( P = .03), conjunctival hyperemia ( P = .05), and corneal fluorescein staining in the nasal (3.6 ± 0.5 vs 4.5 ± 0.5, P = .04) and temporal ( P = .01) areas ( Table 1 and Figure ). After 2-hour exposure to the normal condition, SS dry eye patients showed only a significant increase of corneal fluorescein staining in the nasal area ( P = .03) ( Table 1 ). No patients suffered any adverse event throughout the whole study.
| Dry Eye Disease Test | Exposure | Normal Condition Mean ± SEM | Adverse Condition Mean ± SEM | P Value b |
|---|---|---|---|---|
| Modified SIDEQ | Pre | 4.5 ± 0.5 | 4.8 ± 0.8 | .67 |
| Post | 3.1 ± 0.6 | 3.6 ± 0.6 | ||
| Tear osmolarity | Pre | 320.9 ± 4.7 | 315.7 ± 3.0 | .24 |
| Post | 317.5 ± 5.1 | 327.7 ± 5.1 a | ||
| Phenol red thread test | Pre | 13.6 ± 1.8 | 13.4 ± 1.6 | .93 |
| Post | 13.7 ± 2.0 | 12.3 ± 1.3 | ||
| Conjunctival hyperemia (mean) | Pre | 1.5 ± 0.1 | 1.3 ± 0.1 | .25 |
| Post | 1.6 ± 0.1 | 1.6 ± 0.1 a | ||
| T-BUT | Pre | 1.3 ± 0.1 | 1.3 ± 0.1 | 1.0 |
| Post | 1.5 ± 0.2 | 1.2 ± 0.1 | ||
| Corneal fluorescein staining (Oxford scheme) | Pre | 2.4 ± 0.2 | 2.5 ± 0.2 | .16 |
| Post | 2.3 ± 0.2 | 2.7 ± 0.2 | ||
| Corneal fluorescein staining (Baylor scheme) | ||||
| Central | Pre | 2.1 ± 0.4 | 2.1 ± 0.5 | 1.0 |
| Post | 2.1 ± 0.4 | 2.6 ± 0.6 | ||
| Nasal | Pre | 2.9 ± 0.5 | 3.6 ± 0.5 | .29 |
| Post | 3.6 ± 0.5 a | 4.5 ± 0.5 a | ||
| Temporal | Pre | 3.4 ± 0.4 | 3.5 ± 0.5 | .83 |
| Post | 3.5 ± 0.5 | 4.7 ± 0.4 a | ||
| Superior | Pre | 0.9 ± 0.4 | 1.2 ± 0.4 | .39 |
| Post | 1.0 ± 0.5 | 1.6 ± 0.4 | ||
| Inferior | Pre | 5.1 ± 0.3 | 4.7 ± 0.4 | .30 |
| Post | 4.9 ± 0.5 | 5.4 ± 0.4 | ||
| Lissamine green conjunctival staining | Pre | 2.0 ± 0.3 | 1.9 ± 0.3 | .83 |
| Post | 2.1 ± 0.3 | 1.9 ± 0.3 | ||
| Schirmer test (no anesthesia) | Pre | 4.1 ± 0.7 | 4.1 ± 0.6 | .90 |
| Post | 5.2 ± 0.6 | 5.4 ± 0.7 |
a P ≤ .05: Comparison by Wilcoxon test before (pre) and after (post) 2-hour exposure.
b P value corresponding to comparisons between dry eye disease test scores obtained prior to undergoing both exposures.
Tear Cytokines/Chemokines and Matrix Metalloproteinase-9 Levels
Among the 16 molecules analyzed in tears, 8 (EGF, fractalkine, IL-1RA, IL-6, IL-8, IP-10, VEGF, and MMP-9) had a detection rate above 50% for both conditions. Consequently, these 8 were statistically analyzed; concentrations are summarized in Table 2 . Mean concentration values of molecules with a detection rate <50% are also provided ( Supplemental Table , available at AJO.com ).
| Tear Molecules a | Exposure | Normal Condition | Adverse Condition | P Value c | ||
|---|---|---|---|---|---|---|
| Concentration (pg/mL) Mean ± SEM | Detection Rate (%) | Concentration (pg/mL) Mean ± SEM | Detection Rate (%) | |||
| EGF | Pre | 434.9 ± 157.6 | 78 | 300.2 ± 75.5 | 85 | .48 |
| Post | 459.7 ± 135.4 | 71 | 249.7 ± 77.0 | 64 | ||
| CX3CL1/fractalkine | Pre | 1701.3 ± 493.1 | 85 | 1002.6 ± 225.2 | 93 | .65 |
| Post | 1631.0 ± 447.3 | 85 | 1673.2 ± 431.7 | 93 | ||
| IL-1RA | Pre | 36 395.4 ± 8949.9 | 93 | 16 557.1 ± 4047.8 | 100 | .01 |
| Post | 39 091.7 ± 8810.6 | 93 | 31 895.3 ± 5916.5 b | 100 | ||
| IL-6 | Pre | 157.9 ± 83.8 | 85 | 63.8 ± 20.2 | 57 | .08 |
| Post | 235.2 ± 92.5 | 71 | 111.5 ± 29.6 b | 71 | ||
| CXCL8/IL-8 | Pre | 3567.4 ± 1340.4 | 93 | 2196.1 ± 737.9 | 100 | .17 |
| Post | 4400.7 ± 1490.5 | 93 | 3753.2 ± 1106.0 b | 100 | ||
| CXCL10/IP-10 | Pre | 51 746.1 ± 9410.2 | 93 | 50 737.1 ± 8831.1 | 100 | .94 |
| Post | 48 376.9 ± 11 280.1 | 93 | 57 798.6 ± 7667.5 | 100 | ||
| VEGF | Pre | 935.4 ± 299.4 | 57 | 677.5 ± 258.1 | 78 | .35 |
| Post | 1079.2 ± 246.0 | 93 | 951.5 ± 285.0 | 85 | ||
| MMP-9 | Pre | 48 585.8 ± 21 312.8 | 78 | 101 515.6 ± 37 088.4 | 85 | .32 |
| Post | 36 423.2 ± 12 829.0 | 78 | 145 867.1 ± 41 651.5 b | 85 | ||
a Only the 8 molecules that had detection rate ≥50% out of the 16 measured are shown.
b P ≤ .05: Comparison by t test before (pre) and after (post) 2-hour exposure to each environmental condition.
c P value corresponding to comparisons by t test between tear molecule concentrations obtained prior to undergoing both exposures.
Stay updated, free articles. Join our Telegram channel

Full access? Get Clinical Tree


