PRINCIPLES, TECHNOLOGIES, AND CLINICAL APPLICATIONS OF CORNEAL TOPOGRAPHY/TOMOGRAPHY
More than two-thirds of the refractive power of the eye is derived from the air-tear film interface on the anterior corneal surface. Consequently, the cornea accounts for approximately 43 diopters (D) to the total 60D of refractive power of the eye. Both the anterior (90%) and the posterior (10%) surfaces contribute to the total power of cornea. The central cornea is steeper than the peripheral cornea (prolate) which has the advantage of reducing spherical aberrations. Any minute change in the shape of the cornea can cause a change in refractive power of the eye. The importance of the cornea on visual function has been the impetus for the development of instruments to measure the complex shape, thickness, and refractive power of the cornea. Corneal topography/tomography demonstrates the variations on the surface of the cornea. It is used to diagnose and follow pathology, plan refractive surgery, and evaluate postoperative results. Classic corneal topography is based on the principle of reflection of concentric lighted rings on the cornea. Over time, various corneal imaging instruments have been designed based on necessity and available technology. These include conventional keratometry, Placido disk imaging, raster photogrammetry elevation based technology, slitscanning topography, Scheimpflug imaging, ultrasound digital topography and optical coherence tomography (OCT). Raster photogrammetry, slit-scanning topography, Scheimpflug imaging, optical coherence tomography (OCT), and ultrasound digital topography are termed “tomography” systems due to creation of 3-dimensional image from a 2-dimensional image.
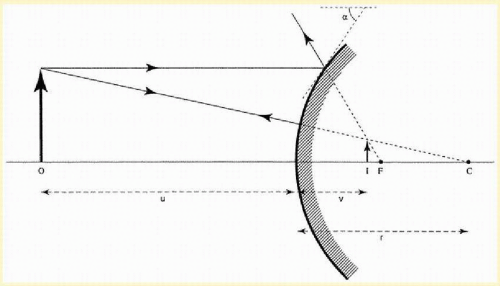
The keratometer and Placido disk are reflection-based methods. An object (multiple points or mires) of known diameter and distance from the cornea is projected onto the central corneal zone. The cornea acts like a convex mirror, reflecting light, and a virtual upright image is produced. The ratio of the image and object diameters is used to estimate the radius of curvature along a particular meridian (
Fig. 112.1). Keratometers are highly accurate for regular spherocylindrical surfaces such as the central zone of a normal cornea, but they have limited value in irregular corneas. They measure the central 3 mm of the cornea, which only accounts for 6% of the entire surface. The keratometer provides no information as to the shape of the cornea either inside or outside the contour of the mires. In addition, standard keratometers have less accuracy for corneal powers below 36 D and above 50 D, although they have a theoretical range of 30 to 60 D.
A Placido disk reflects a series of concentric rings, or mires, off the cornea. Each mire produces an upright virtual image in the anterior chamber (about 4 mm behind the corneal vertex) of the subject’s eye.
1 The distance between each mire to the corneal apex is compared to the image’s distance to the corneal apex. The ratio of image distance to mire distance determines the anterior corneal curvature along any particular meridian. Placido devices include photo-keratoscopes (Corneoscope) and computerized videokeratoscopes (e.g., TMS-Tomey Corporation, Nagoya, Japan; Optikon 2000-Rome, Italy; Magellan Mapper-Nidek, Fremont, California; Topolyzer-Alcon, Fort Worth, Texas; EyeSys 3000-EyeSys Vision Inc., Houston, Texas; ATLAS 9000-Carl Zeiss Meditec, Jena, Germany). Placido disk systems have distinct advantages over the keratometer. The photokeratoscope can measure 12 mires over 70% of the corneal surface and over an almost infinite diopteric range. The computerized videokeratoscope assumes that the corneal surface is spherical and of uniform refractive index; it can measure 15 to 38 mires over 95% of the corneal surface and has a theoretical range of 8 to 110 D.
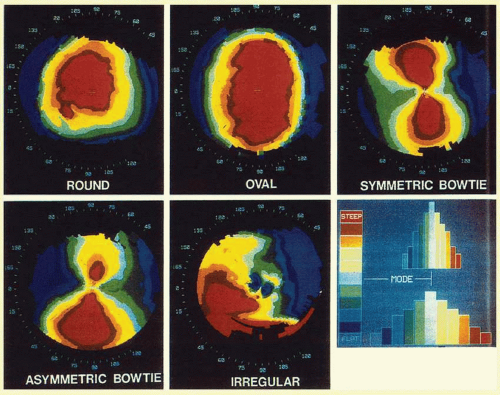
2Videokeratoscopes display topographical information using a variety of maps. A picture of the cornea can also be provided as a raw image. This allows the clinician to recognize distortions of the tear film and poor image centration that may compromise the accuracy of the videokeratoscopy. The data are then presented as a color map with either an absolute or a normalized scale. On color maps, the warmer colors (red, orange, and yellow) represent the steeper areas; the cooler colors (blue and green) represent the flatter regions. The absolute scale is a fixed system in which each color is consistently assigned to a particular curvature or power. This facilitates the comparison of topographies between patients and over time in the same patient. Each videokeratoscope has its own absolute color map with fixed dioptric intervals covering the range of corneal powers. The normalized (relative) scale maximizes the utilization of all possible colors to evaluate a specific cornea. The color map with a normalized scale has narrower intervals between the assigned colors. Although the normalized scale allows the clinician to evaluate a particular topography with greater detail, it makes comparison between examinations difficult because the scale may have changed in range and dioptric interval. Another option available to the clinician is the adjustable scale, which allows the clinician to customize the step interval and dioptric range of the contours.
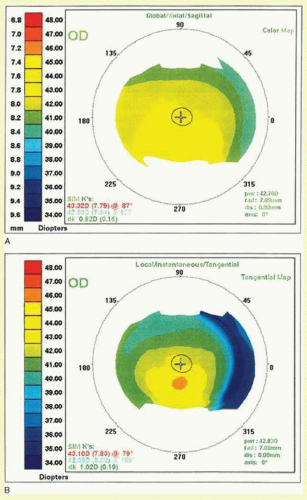
Placido disk devices use axial (sagittal, global, average, or standard), tangential (instantaneous, true, or local), or refractive power maps to calculate radius of curvature (
Fig. 112.2). The axial map measures the perpendicular distance from the tangent at a point to the optical axis and therefore has a spherical bias. This gives a global description of shape, but may be less accurate in the corneal periphery and in corneas with irregular surfaces. On the other hand, a tangential map displays the radius of curvature of a point with respect to its neighboring points along a specific meridian. It has less spherical bias than an axial map and therefore may be preferred to assess the corneal periphery or in irregular corneas. The refractive map uses Snell’s law to measure the focal power of the cornea.
The videokeratoscope computer program generally gives the clinician several options for delineating the major and minor axes for a given cornea. The orthogonal axes mark the major and minor axes as measured at the central 3-mm zone. The zonal axes mark the major and minor axes at the 3-mm as well as the 5- and 7-mm zones. This allows the clinician to quickly assess whether there is a shift in the major and minor axes with progression toward the corneal periphery. The instantaneous axes option draws a continuous line from the center of the cornea to the periphery, showing the true major and minor axes at any given diameter (
Fig. 112.3).
Data can also be manipulated by videokeratoscope computer programs to glean desired information. Crosssectional maps display the theoretical elevation and depression of the anterior corneal surface along any given meridian. Difference maps can compare pre- and posttreatment corneal topographies by subtracting the first map from the second. Statistical indices, which are often used in clinical studies, can also be obtained using computer programs.
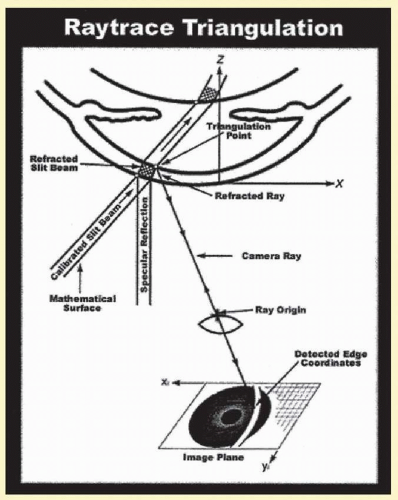
Raster photogrammetry (e.g., PAR-PAR Technology, New Hartford, New York) is another projection-based system that produces an elevation map of the cornea. Its advantages are that it measures the entire corneal surface, up to 12 mm, can also measure irregular or deepithelialized or keratectomized corneas, and can be used intraoperatively. A projector casts a grid onto a corneal surface coated with fluorescein dye. The fluorescein dye produces light emissions from the surface of the cornea. Two or more camera systems at different angles to the cornea from the projector image the grid (fluorescence-based photography). The rays intersect in 3-dimensional (3D) space, creating the elevation map. It has the added advantage of rapid image acquisition and being less sensitive to focusing.
3,
4 and
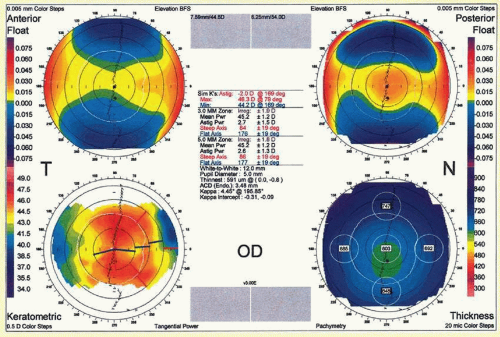
5Scanning slit topography (e.g., Orbscan IIz; Bausch & Lomb, Rochester, New York) is a projection-based method that uses a series of slit-beam images to generate data regarding anterior surface curvature, posterior surface curvature, and pachymetry. Therefore, the cornea is represented as a 3D structure. Two technologies are used in this particular system, the scanning slit-beam system and the Placido disc system. A slit lamp projects a beam at 45 degrees onto the cornea. Twenty slits are projected sequentially on the eye from the left side, and 20 slits from the right, for a total of 40 slits that produce 240 data points per slit (
Fig. 112.4). These points form the source for the mathematical calculation and are used to compute four elements of the anterior segment: anterior and posterior elevations, corneal power, and pachymetry maps. The elevations and depressions are recorded in 5
µm increments. Height maps have a colored reference scale and display elevations in warm colors and depressions in cool colors. The distance between the anterior and the posterior surfaces is the corneal thickness. Corneal thickness measured by the Orbscan is 7% thicker than the gold standard ultrasound pachymetry measurements
6,
7 (
Fig. 112.5).
The Orbscan is also capable of calculating corneal power. Mean power maps show the variation of spherical power by calculating the arithmetic average of the principal curvatures for each data point. Astigmatic power maps represent absolute local cylinder over the corneal surface. It is obtained by calculating the arithmetic difference of the principal curvatures for each data point. In addition, axial, tangential, and Snell power maps are available, based on the same principles as the Placido disk systems.
Scheimpflug imaging attains a wide depth of focus, providing sharp images that include information from the anterior corneal surface through to the posterior crystalline lens capsule (anterior segment of the eye). There are two Scheimpflug systems available on the market, the Pentacam (Oculus Inc., Wetzlar, Germany) and Galilei dual Scheimpflug analyzer (Ziemer Group, Port, Switzerland).
The Pentacam consists of two cameras, a central camera monitoring the fixation and the Scheimpflug camera scanning the optical cross-sections of the anterior segment.
8 In a span of 2 seconds, 25 to 50 images are captured by the camera yielding about 12,500 to 25,000 data points. These data points are used in computing anterior and posterior sagittal and tangential curvature, anterior and posterior elevation maps, corneal pachymetry from limbus-limbus, anterior chamber depth, anterior chamber angles, corneal and anterior chamber volumes, pupil diameter, and lens thickness. In addition, the equivalent keratometry reading calculated by Pentacam can be used for the corneal power after kerato-refractive surgery to calculate intraocular lens power.
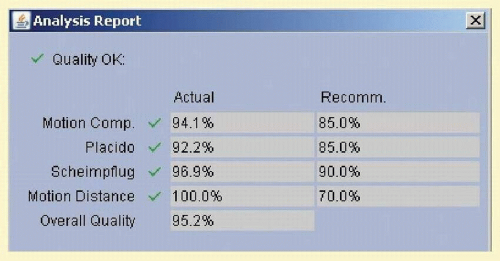
The Galilei dual Scheimpflug analyzer integrates a Placido disk and a dual rotating Scheimpflug system (two cameras 180 degrees apart) to compensate for error associated with single scans at an oblique angle. During the rotating scan, Placido disk and Scheimpflug images are simultaneously acquired to obtain the information on the curvature and elevation of the cornea, respectively. In a span of 1 to 2 seconds approximately 122,000 data points are measured per scan. The dual camera configuration captures two Scheimpflug slit images from opposite sides of the slit beam and simultaneously tracks decentration due to eye movements, resulting in highly reliable pachymetry and posterior curvature data. The quality of the acquired scans need to satisfy the minimum percentage required by the instrument; the percentages are automatically calculated by the internal software for different parameters, such as motion compensation, Placido, Scheimpflug images, and motion distance (
Fig. 112.6).
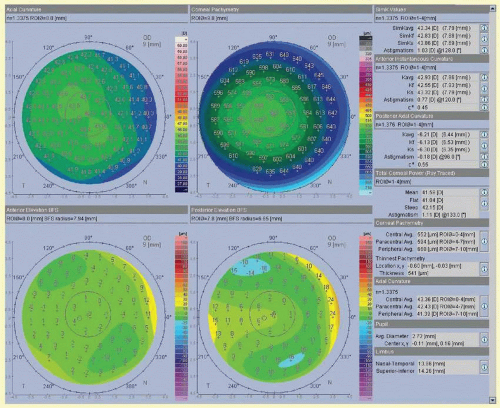
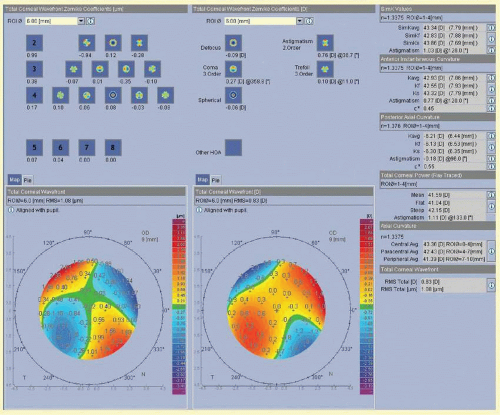
The refractive report consists of four fixed maps (anterior axial curvature, pachymetry map, anterior elevationBest Fit Sphere, posterior elevation-Best Fit Sphere) and a set of parameters that provide a comprehensive overview of the cornea (
Fig. 112.7). The various parameters include:
Anterior Curvature: SimKavg is the arithmetic mean or average of the steep and flat axis (SimKf, SimKs), which are calculated from the pair of meridians 90 degrees apart with the greatest difference in average power, from 0.5 to 2.0 mm distance from the center.
Posterior curvature parameters are calculated with the indices of refraction of the cornea (1.376) and aqueous humor (1.336).
Total Corneal Refractive Power (mean, flat, steep, astigmatism, central Avg [0 to 4 mm], Paracentral Avg [4 to 7 mm], Peripheral Avg [7 to 10 mm]): It is calculated by ray-tracing through the anterior surface and posterior surface using Snell’s Law and the thin lens equations.
Corneal pachymetry: The mean corneal pachymetry at the central zone (0.0 to 4.0 mm), paracentral zone (4.0 to 7.0 mm), peripheral zone (7.0 to 8.0 mm), and thinnest pachymetry.
Limbus (Nasal-Temporal, Superior-Inferior): The maximum length in the horizontal and vertical directions of the ellipse respectively.
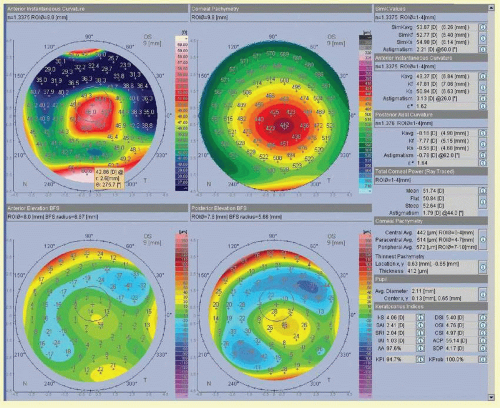
The keratoconus report consists of keratoconus indices (
Table 112.1), which are based on formulas of Placido device, and simulated on the Galilei by translating the ring numbers used in the original Placido equations into corneal regions in the Galilei
9,
10 (
Fig. 112.8).
Wavefront maps of the total cornea (front and back surfaces) are displayed in micron as well as in diopter. The individual coefficients are displayed for the second, third, and fourth order aberrations; the orders five to eight are displayed in a summarized fashion (
Fig. 112.9).
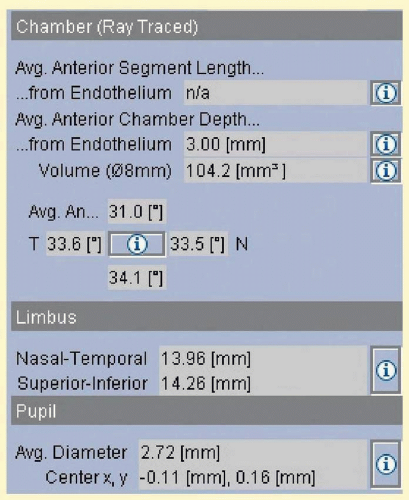
The IOL power report shows the anterior chamber depth when the pupil is well dilated, volume and iridocorneal angle (temporal, superior, nasal, and inferior quadrants). These values are measured between the corneal endothelium and the anterior surface of the lens; the volume is calculated over a diameter of 8.0 mm (
Fig. 112.10).
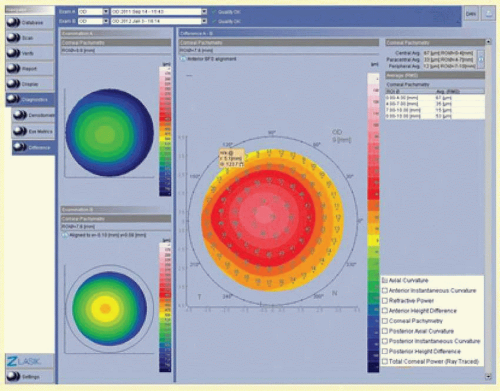
Difference maps (A – B difference) can be used to compare various parameters (axial curvature, anterior instantaneous curvature, refractive power, anterior height difference, corneal pachymetry, posterior axial curvature, posterior instantaneous curvature, posterior height difference, and total corneal power) between two visits to follow a specific pathology or to compare pre- and postoperative results (
Fig. 112.11).
Galilei also has the facility to connect to FEMTO LDV laser using Z Lasik report. Scanning the report in by the FEMTO LDV helps in transferring the patient’s data from Galilei to FEMTO LDV electronically, thus eliminating sources of error during data entry and also minimizing the laser setup time.
Wang et al.
11 have shown that the Galilei had excellent repeatability for corneal powers, pachymetry, and anterior chamber depth measurements, and Menassa et al.
12 have shown low intraobserver and interobserver variation for central corneal thickness and power. The central corneal thickness measurements made with the Galilei showed good correlation and agreement with those made with ultrasound.
13The Artemis very high-frequency (VHF) digital ultrasound arc-scanner (ArcScan Inc., Morrison, Colorado) was designed for imaging and measuring the whole anterior segment to improve anatomical diagnosis for surgical planning and postoperative diagnostic monitoring. Using a broadband 50 MHz VHF ultrasound transducer, Bscans are acquired as arcs that follow the surface contour of anterior segment structures. Digitized ultrasound data are then transformed using digital signal processing technology (I-scan). Thickness profiles are calculated based on data from four meridional B-scans, comprised of eight semi-meridians. Performing a 3-dimensional scan set with the Artemis 1 takes approximately 2 to 3 minutes per eye. The axial measurement precision for the entire anterior segment (15-mm-wide) is approximately 1
µm, while the lateral precision is 0.12 mm for measuring angle-toangle dimensions, and 0.22 mm for sulcus-to-sulcus dimensions. The resolution of the Artemis, when set to scan the cornea, is sufficient to distinguish individual corneal layers such as the epithelium, stromal component of a LASIK flap, residual stromal bed. Work done by Reinstein et al.
14,
15 and
16 on the utility of the VHF digital ultrasound arcscanner to differentiate layers of the cornea and anterior segment highlights the usefulness of this technology in differentiating normal and keratoconic corneas, changes induced in the cornea as a consequence of LASIK, and also helps in anatomical surgical planning and postoperative monitoring of phakic IOLs.
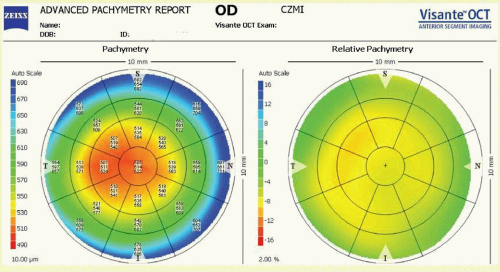
Visante anterior segment optical coherence tomography (Carl Zeiss Meditec, Inc., Dublin, California) imaging is based on the principle of measuring the delay of light (wavelength 1310 nm) reflected from tissue structures. Optical coherence tomography (OCT) employs low-coherence interferometry to compare the delay of tissue reflections against a reference reflection. The pachymetry scan can be either in standard pachmetry map (8 sequential images) or global pachymetry map (16 sequential images). The relative pachymetry map compares the patient’s pachymetry map with the standard normal cornea (550
µm) (
Fig. 112.12). The pachymetry data (central 5 mm) can be used to help diagnose keratoconus based on the average thickness of the inferior octant minus the average thickness of the superior octant (cutoff: >-45
µm), the average thickness of the inferotemporal octant minus the average thickness of the superonasal octant (cutoff: >-45
µm), minimum pachymetry of <470
µm, minimum-maximum pachymetry >-100
µm. When Visante OCT (pachymetry, posterior surface, power) is linked with Humphrey ATLAS corneal topographer (Placido disk-axial, instantaneous, anterior elevation, wavefront), all the parameters of the cornea can be analyzed.
17,
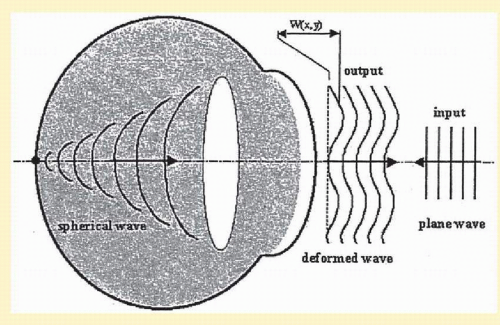
18The latest technology is that of wavefront sensors, which evaluate the sum of refractive effects of the cornea, lens, media, and retina. Wavefront sensor technology dates from the 1970s, when Josef Bille, at the University of Heidelberg, applied astronomical principles to the study of the eye. Lightwaves from distant stars traveling through the atmosphere and entering a telescopic lens should be virtually flat. However, interference from the atmosphere produces aberrations in the wavefront. Bille recomposed the imperfect wavefronts into a perfectly round image through the use of different mirrors. Fritz Zernike (1934) described a set of polynomials representing a particular type of optical aberration. Aberrations can also be represented using Fourier series. Fourier full reconstruction is faster and more accurate than Zernike reconstruction, and better represents ocular aberrations of highly aberrated eyes.
19 Today, wavefront technology is designed to evaluate refractive errors and correct optical aberrations, and it has been applied to laser refractive surgery. Wavefront technologies commercially available to measure aberrations include Tscherning aberroscope, differential skiascopy, Hartmann-Shack sensor, and ray tracing. In Hartmann-Shack technology, a laser beam is projected through the cornea, lens, and media onto the fovea; the reflected beam of light produces wavefronts that are captured by a grid of lenses and sensors that lie in a conjugate plane to the cornea. The wavefront’s angle of incidence to the lens is recorded by the sensor. The shape of the wave can be reconstructed from the direction in which the wave is traveling at each of the grid lenses (
Fig. 112.13). Regions of the wave that are out of phase with a reference point such as the front of the wave can be detected. A computer program develops a color map representing total ametropia at different points. Wavefront maps can determine whether the wave emitted from one part of the optical system is out of phase with a wave emitted from another region. The discrepancy in phases can be measured in microns and corresponds to the depth of ablation necessary to produce a flat wavefront. A lens can be formulated to compensate for the aberration, creating a customized ablation pattern. In ray tracing technology, forward aberrations of light passing into the eye are measured, which are considered more physiologic in analyzing vision. Ray tracing technology has certain advantages over other technologies as laser spots projected through the entrance pupil can be controlled with the software; there is no confusion in the analysis between the entrance pupil and the reflected location from the retina due to rapid sequential capturing of the data.
20,
21,
22,
23 and
24