Purpose
To evaluate corneal air-puff deformation responses and ocular geometry as predictors of Marfan syndrome.
Design
Prospective observational clinical study.
Methods
Sixteen investigator-derived, 4 standard Ocular Response Analyzer (ORA), and geometric variables from corneal tomography and optical biometry using Oculus Pentacam and IOL Master were assessed for discriminative value in Marfan syndrome, measuring right eyes of 24 control and 13 Marfan syndrome subjects. Area under the receiver operating characteristic (AUROC) curve was assessed in univariate and multivariate analyses.
Results
Six investigator-derived ORA variables successfully discriminated Marfan syndrome. The best lone disease predictor was Concavity Min (Marfan syndrome 47.5 ± 20, control 69 ± 14, P = .003; AUROC = 0.80). Corneal hysteresis (CH) and corneal resistance factor (CRF) were decreased (Marfan syndrome CH 9.45 ± 1.62, control CH 11.24 ± 1.21, P = .01; Marfan syndrome CRF 9.77 ± 1.65, control CRF 11.03 ± 1.72, P = .01) and corneas were flatter in Marfan syndrome (Marfan syndrome K mean 41.25 ± 2.09 diopter, control K mean 42.70 ± 1.81 diopter, P = .046). No significant differences were observed in central corneal thickness, axial eye length, or intraocular pressure. A multivariate regression model incorporating corneal curvature and hysteresis loop area (HLA) provided the best predictive value for Marfan syndrome (AUROC = 0.85).
Conclusions
This study describes novel biodynamic features of corneal deformation responses in Marfan syndrome, including increased deformation, decreased bending resistance, and decreased energy dissipation capacity. A predictive model incorporating HLA and corneal curvature shows greatest potential for noninvasive clinical diagnosis of Marfan syndrome.
Marfan syndrome is an autosomal dominant connective tissue disorder caused by mutations in FBN1 . Clinical diagnosis currently conforms to the Ghent criteria, most recently revised in 2010. These diagnostic criteria have evolved since the original description by Antoine-Bernard Marfan in 1896, reflecting challenges presented by a broad phenotypic spectrum and the age-dependent nature of individual abnormalities, as well as advances in our understanding of the genetic etiology of Marfan syndrome and differentiation from related conditions. Early diagnosis is of crucial importance in Marfan syndrome owing to the life-threatening sequelae of cardiac and vascular pathology. While the estimated prevalence of Marfan syndrome has been cited at 2–3 in 10 000, an exact prevalence is difficult to measure owing to presumed underdiagnosis of this condition.
The role of the ocular examination in diagnosing Marfan syndrome has gained prominence with the revised Ghent criteria, as the presence of ectopia lentis with aortic dilation (Z-score ≥2) is currently sufficient for diagnosis. However, the only other ocular feature officially considered in diagnosis is myopia greater than 3 diopters (D), which has questionable specificity for this condition. The potential for ocular abnormalities to aid in diagnosis may be much greater than currently acknowledged, as fibrillin-1 microfibrils that are abnormally formed owing to the disease-causing mutations in FBN1 are widely distributed in the human eye. Histologic study of fibrillin-1 microfibrils in the Marfan syndrome eye found differences in both quantity and quality of microfibrils, and it is possible that the impact of their malformation likely leads to global ocular changes.
Investigation of biomechanical and dynamic changes in tissues that contain abnormal fibrillin-1 is a reasonable next step in refining the approach to diagnosing Marfan syndrome. Abnormalities in corneal biomechanical properties, or, more precisely, behavior as measured by the techniques used in the present study, have been detected in a variety of corneal disorders and postoperative conditions, including Fuchs dystrophy, post–laser in situ keratomileusis (LASIK) eyes, and keratoconus, a disease characterized by stromal degeneration and disruption of Bowman membrane, of which fibrillin-1 is a component. Differences between normal and Marfan syndrome corneas have been previously observed at the microscopic and clinical levels. Specifically, Iordanidou and associates evaluated Marfan syndrome corneas using confocal microscopy and found highly reflective interconnected lines between keratocytes in the extracellular matrix of over half of Marfan syndrome corneas, and brightly reflective particles in the endothelium in Marfan syndrome corneas exclusively. Additionally, clinical differences in corneal curvature have been observed repeatedly, as numerous studies have found the Marfan syndrome cornea to be flatter than non–Marfan syndrome corneas. Based on these many observations of differences in the Marfan syndrome cornea, it is reasonable to suspect that corneal deformation responses in Marfan syndrome may also be altered.
Biomechanical behaviors of the cornea can be assessed in vivo using the Ocular Response Analyzer (ORA). To date, only 1 study has investigated the biomechanical behavior in the corneas of individuals with Marfan syndrome. Here we expand on the investigation of alterations in biomechanical behavior in corneas of individuals with Marfan syndrome, using investigator-derived ORA variables described by Hallahan and associates and found to have high predictive value for detecting keratoconus. We assess the capacity of the corneal deformation responses to predict a diagnosis of Marfan syndrome both independently and in conjunction with geometric measurements of the Marfan cornea, including corneal curvature, central corneal thickness, and axial eye length. Through this investigation, we explore the possibility of a novel diagnostic algorithm that may be clinically useful in diagnosing future cases of Marfan syndrome.
Methods
Study Design
This prospective, observational clinical study followed the tenets of the Declaration of Helsinki and complied with the Health Insurance Portability and Accountability Act. The project was prospectively approved by the Institutional Review Board of the Cleveland Clinic. Participants were evaluated between September 2012 and June 2013 and provided informed consent for the study.
Two groups of participants were included in this study. One group included individuals with a confirmed diagnosis of Marfan syndrome per the 1996 or 2010 Ghent criteria, based on clinical examinations from ophthalmology, cardiology, and medical genetics, and were all established patients from the Cole Eye Institute, Cleveland Clinic or the University Hospitals Case Medical Center. Participants were evaluated between October 2012 and July 2013. Individuals who had undergone any kind of ocular surgery or who only had a suspected diagnosis of Marfan syndrome were excluded from this study. The second group included healthy age-matched volunteers without history of Marfan syndrome or other connective tissue diseases or conditions that could affect the health and shape of the cornea, such as keratoconus. In total, 13 right eyes of participants with a confirmed diagnosis of Marfan syndrome and 24 right eyes of age-matched controls were evaluated in this study.
Measurements
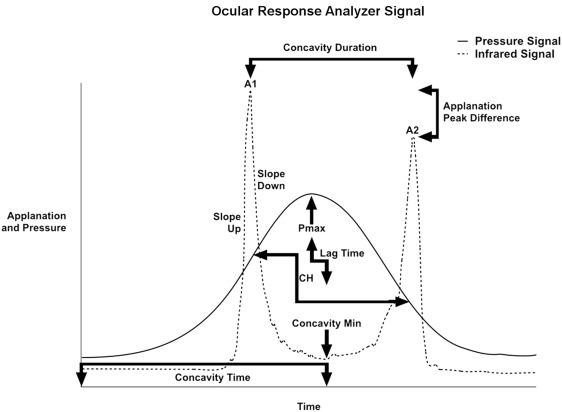
The ORA (Reichert Ophthalmic Instruments, Buffalo, New York, USA) assesses corneal biomechanical behavior through measurement of corneal hysteresis (CH) and other features of the corneal deformation response. Hysteresis is a measurement of the energy absorptive capacity of viscoelastic tissues that undergo time-dependent strain upon deformation. The ORA measures corneal hysteresis through application of a variable air impulse to the central cornea with simultaneous monitoring of the magnitude of corneal deformation using an infrared electro-optical collimation detector system. The pressure and deformation data can be exported for custom analysis. An illustrative example is provided in the Figure , with the solid line depicting the pressure applied to the cornea and the dotted line representing corneal deformation. The intensity of photons reflected off the cornea is greatest when the corneal surface is relatively planar, which occurs at relative applanation. The cornea passes through 2 points of applanation as it indents and regains shape. The ORA measures corneal hysteresis as the difference in external pressure at these 2 points of applanation, P1 and P2.
The ORA also measures the corneal resistance factor (CRF), which is related to the same pressure values from which corneal hysteresis is derived. CRF is biased toward the pressure required to achieve applanation during inward deformation of the cornea owing to its definition by (P1 − [kP2]). The constant k was set empirically by the manufacturer to 0.7 to increase association with central corneal thickness. The ORA also provides 2 measurements of intraocular pressure, Goldmann-correlated and corneal-compensated IOP, both of which are included as basic measurements in this study.
The 16 investigator-derived variables included in this study were previously described in detail. The variables were derived from specific aspects of the ORA waveform and are grouped accordingly. These groups include variables derived from applanation signal intensity (A1, A2, Applanation Peak Difference, Concavity Min, Concavity Mean), applied pressure (CRF, CH, P1, P2, P1P2Avg, Pmax), and response time (Concavity Duration, Concavity Time, Lag Time). Variables were also derived from combinations of these properties, including applanation signal intensity as a function of response time (Slope Down, Slope Up), pressure and applanation signal intensity (hysteresis loop area [HLA]), and pressure and time (Impulse). The relationship of many of these variables to the ORA waveform is depicted in the Figure .
Measurements of ocular geometry were obtained in all patients at the same visit as ORA measurements and included axial eye length (IOL Master; Carl Zeiss Meditec, Dublin, California, USA), as well as corneal curvature (mean simulated K values) and central corneal thickness using rotating Scheimpflug tomography (Pentacam; Oculus, Wetzlar, Germany).
Statistical Analysis
The estimated sample size required to detect a 1-unit difference in CH at the 0.05 significance level was calculated using Minitab based on published standard deviations with 80% power. A group size of 10 was estimated to be sufficient. Mean and standard deviation values and 2-sample unpaired t tests were calculated for all variables (Minitab v17; Minitab Inc, State College, Pennsylvania, USA).
To assess the predictive ability of the 23 measurements taken (including the standard and user-derived ORA variables, as well as geometric measurements), we first calculated the area under the receiver operating characteristic (AUROC) curve for each variable and tested for significant differences in their predictive ability to correctly classify Marfan syndrome patients. These tests indicated that no one variable was better than any of the others in this regard. We then generated multivariable models and tested the models for improvement in predictive ability relative to the simple univariate models. The 23 variables were first tested for independence from one another using the co-linearity diagnostic methods of condition indices and variance inflation factors.
The variables were tested in 2 groups: specifically, all variables together and the 16 investigator-derived variables alone. The final assessment of the matrix indicated that 10 of the variables from the list of 23 exhibited sufficient independence from one another (maximum condition index <10, maximum variance inflation factor <10). The results of a similar analysis for the 16 investigator-derived variables indicated that 8 were sufficiently independent to be included in a multivariable study.
Two separate multivariable models were constructed using the 2 separate groups of independent variables. Multivariate backward logistic regression methods were used to generate reduced models for both sets of variables. A reduced model is one containing only statistically significant variables ( P < .05). For both sets of variables, the final model reduced to 2 terms. These 2 terms were used to generate an AUROC curve and the resultant curve was tested against the various single-variable model AUROC curves to check for improvement in sensitivity and specificity (SAS v9.3; SAS Institute, Cary, North Carolina, USA).
Results
Demographics and clinical findings in study participants are summarized in Table 1 . The 2 diagnostic groups were successfully age matched. The 2 study groups were roughly similar ethnically, as both were predominantly white. Specifically, the Marfan syndrome group included 10 white (77%), 2 African-American (15%), and 1 Hispanic (8%) participants. The control group included 17 white (71%), 4 Asian (17%), 2 Asian/Indian (8%), and 1 African-American (4%) participants. The corneas of individuals with Marfan syndrome were significantly flatter than those of controls, with K mean of 41.25 ± 2.09 D for Marfan syndrome corneas. There were no significant differences in the other basic measurements collected for the study participants, including corneal-compensated intraocular pressure, Goldmann-correlated intraocular pressure, central corneal thickness, or axial length.
| Variable | Control | Marfan Syndrome | P Value |
|---|---|---|---|
| Number of eyes | 24 | 13 | |
| Age | 29.5 ± 11.7 | 33.5 ± 20.0 | .5 |
| IOPcc (mm Hg) | 14.9 ± 3.3 | 15.5 ± 3.3 | .6 |
| IOPg (mm Hg) | 15.2 ± 3.9 | 14.1 ± 3.1 | .4 |
| Central corneal thickness (μm) | 561.3 ± 23.9 | 552.5 ± 42.4 | .5 |
| Corneal curvature (Kmean, diopters) | 42.70 ± 1.81 | 41.25 ± 2.09 | .046* |
| Axial length (mm) | 24.04 ± 1.31 | 24.61 ± 1.41 | .07 |
Ocular Response Analyzer measurements are included in Table 2 , including investigator-derived and 2 standard ORA biomechanical variables (CH, CRF). Six of the 16 investigator-derived variables and both standard variables were significantly different between the 2 groups. These included variables from 3 categories: those derived from applanation signal intensity (Group 1: Concavity Min, Concavity Mean), from pressure measurements (Group 2: Corneal Resistance Factor, Corneal Hysteresis, P1, P2, P1P2Avg), and from the combination of pressure and applanation signal intensity (Group 5: HLA).
| Group | Variable | Operational Definition | Control | Marfan Syndrome | |
|---|---|---|---|---|---|
| Mean ± SD | Mean ± SD | P Value | |||
| 1: Applanation signal intensity | A1 | Peak intensity of first applanation event | 705 ± 89 | 629 ± 146 | .1 |
| A2 | Peak intensity of second applanation event | 649 ± 80 | 567 ± 161 | .1 | |
| Applanation Peak Difference | A2 − A1 | −56 ± 105 | −62 ± 106 | .9 | |
| Concavity Min | Minimum applanation intensity between A1 and A2 | 69 ± 14 | 48 ± 20 | .003* | |
| Concavity Mean | Mean applanation intensity between A1 and A2 | 173 ± 25 | 145 ± 31 | .01* | |
| 2: Pressure signal | CRF (mm Hg) | Corneal resistance factor (P1 − 0.7P2) | 11.0 ± 1.7 | 9.5 ± 1.6 | .01* |
| CH (mm Hg) | Corneal hysteresis (P2 − P1) | 11.2 ± 1.2 | 9.8 ± 1.7 | .01* | |
| P1 (mm Hg) | Pressure at first applanation event | 55.6 ± 7.2 | 47.9 ± 7.8 | .007* | |
| P2 (mm Hg) | Pressure at second applanation event | 44.3 ± 6.1 | 38.1 ± 6.3 | .008* | |
| P1P2Avg (mm Hg) | (P1 + P2)/2 | 49.9 ± 6.6 | 43.0 ± 7.0 | .008* | |
| Pmax (mm Hg) | Peak value of pressure signal | 488.6 ± 40.1 | 470.6 ± 34.1 | .2 | |
| 3: Temporal response variables | Concavity Duration (msec) | Time lapse between A1 and A2 | 10.88 ± 0.64 | 10.93 ± 0.53 | .8 |
| Concavity Time (msec) | Time from onset of applied pressure to Concavity Min | 13.62 ± 3.65 | 13.34 ± 4.48 | .9 | |
| Lag Time | Time between Pmax and Concavity Min | 2.58 ± 2.75 | 2.35 ± 4.06 | .9 | |
| 4: Applanation intensity and response time | Slope Down (msec −1 ) | Negative slope of the first applanation peak, from peak to inflection point | −7 ± 205 | −71 ± 189 | .4 |
| Slope Up (msec −1 ) | Positive slope of the first applanation peak, from inflection point to peak | 84.5 ± 31.5 | 73.6 ± 34.4 | .4 | |
| 5: Pressure and applanation intensity | HLA | Area enclosed by pressure vs applanation function | 38 863 ± 13 668 | 26 412 ± 15 699 | .03* |
| 6: Pressure and time | Impulse | Area under pressure vs time curve | 10 063 ± 3228 | 10 170 ± 2812 | .9 |
The AUROC values for all biomechanical and geometric variables that were found to have significantly better diagnostic capability than by chance are displayed in Table 3 . The Youden index was used to identify cutoff values for each of these variables with corresponding sensitivity, specificity, and positive and negative predictive values. When assessed individually, the best-performing variable was Concavity Min (AUROC 0.80, cutoff 51.01, sensitivity 54%, specificity 96%), an indirect measurement of corneal bending resistance.
| Group | Variable | AUROC | P Value | Confidence Interval | Cutoff | Sensitivity (%) | Specificity (%) | PPV | NPV |
|---|---|---|---|---|---|---|---|---|---|
| Applanation signal intensity | Concavity Min | 0.80 | .008 | (0.65, 0.95) | 51.01 | 54 | 96 | 88 | 79 |
| Concavity Mean | 0.79 | .02 | (0.63, 0.95) | 163.33 | 85 | 67 | 58 | 89 | |
| Pressure | CRF (mm Hg) | 0.74 | .02 | (0.57, 0.92) | 10.30 | 85 | 63 | 53 | 88 |
| CH (mm Hg) | 0.77 | .01 | (0.60, 0.94) | 10.90 | 77 | 71 | 59 | 85 | |
| P1 (mm Hg) | 0.76 | .01 | (0.60, 0.93) | 51.80 | 85 | 67 | 58 | 89 | |
| P2 (mm Hg) | 0.75 | .01 | (0.58, 0.92) | 41.01 | 85 | 63 | 55 | 88 | |
| P1P2Avg (mm Hg) | 0.76 | .01 | (0.59, 0.92) | 46.35 | 85 | 67 | 58 | 89 | |
| Pressure and applanation intensity | HLA | 0.72 | .03 | (0.54, 0.89) | 26 213.84 | 54 | 88 | 70 | 78 |
| Geometric measurements | Corneal curvature (Km, D) | 0.72 | .04 | (0.54, 0.90) | 41.40 D | 62 | 79 | 62 | 79 |
Stay updated, free articles. Join our Telegram channel

Full access? Get Clinical Tree


