Computed Tomography of the Orbit
James A. Garrity
Julie R. Gilbertson
In general, there are two types of change: revolutionary and evolutionary. Introduction of computed tomography (CT) in 1969 constituted the former. Continued evolutionary changes to CT hardware and software since then have ensured that CT remains a valuable tool in the evaluation of orbital disease. Noteworthy changes include helical scanning (continuous gantry movement combined with continuous data acquisition) with faster and higher resolution scanning (64-slice scanning is now current state-of-the-art). This chapter reviews recent highlights involving CT and reaffirms CT’s role in the evaluation and management of neuro-ophthalmic and orbital diseases, especially for trauma, proptosis, and childhood leukocoria.1,2
Computed tomography revolutionized the fields of neuro-ophthalmology and orbital diseases by its ability to show many of the lesions responsible for various clinical symptoms and signs. Magnetic resonance imaging (MRI) has surpassed CT in terms of clinical utility in most neuro-ophthalmic applications, such as the evaluation of cranial nerve palsies and optic nerve lesions, especially if intracranial extension is suspected. CT remains a quick, clinically effective, and cost-effective method for evaluating most orbital problems. Most orbital lesions are adequately visualized, which is helpful with differential diagnosis or planning a surgical approach to minimize morbidity. Evaluating for intralesional calcium and the effects on adjacent bone are better appreciated with CT. The strength of being able to evaluate bone also is one of the weaknesses in that visualization of the orbital apex is compromised by the dense bone. Although one may be able to imply certain characteristics of tissue type with CT, MRI is better. Finally, in certain instances, CT and MRI are complementary, such as with a patient with an ethmoid sinus tumor who also has an opacified frontal sinus. Bony changes around the ethmoid sinus are seen with the CT, but MRI is valuable in differentiating tumor from benign inflammatory sinus disease (Fig. 24.1).
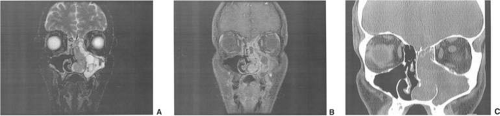 Figure 24.1. Nasal cavity squamous cell carcinoma and complementary roles of computed tomography (CT) and magnetic resonance imaging (MRI). Coronal fast spin echo (FSE) T2 MR image (A) and coronal postcontrast T1 with fat saturation MR image (B) demonstrate a T2 hypointense-enhancing mass (shown by *) in the left nasal cavity, which can be differentiated from the adjacent T2 hyperintense benign inflammatory secretions. Corresponding coronal CT image (C) demonstrates soft tissue opacification of the left nasal cavity, ethmoid and maxillary sinuses. Differentiation between tumor and inflammatory disease is best depicted on MR, and often difficult on CT. |
Computed tomography traces its beginnings to research initiated by Hounsfield in Great Britain in 1969. Scanning was accomplished by inserting a patient’s head into a latex cap that projected into a plastic water-containing box. The head was scanned by a slit x-ray beam, and the emergent photons were detected by two crystal photomultiplier detectors that moved parallel to and in accurate alignment with the x-ray tube across the patient’s head. Data were displayed on an 80 × 80-matrix cathode ray tube in which the brightness of each point was proportional to its absorption coefficient. Initial slices (axial only) were 13-mm thick, although 8-mm slices could be produced. Scanning times ranged from 5 to 10 minutes per slice. Iodinated contrast material was not used.
Computed tomography of the head was introduced into clinical practice in the United States in June 1973. Two reports detailing early experience quickly followed.3,4 Orbital applications of this new technique were subsequently developed in 1974.5,6
The early CT scanners (EMI scanners) were specifically designed for scanning the head, and technical difficulties were encountered in obtaining tomographic slices sufficiently low to visualize the entire orbit adequately. Multislice CT scanning has evolved from 4-, 8-, and 16-, and now to 64- and 128-slice technology. Most large and academic medical centers now utilize current state-of-the-art 64-slice CT scanning systems. This provides superior image quality at the highest speed and a reduced radiation dose. The improved spatial resolution now attainable with current reconstruction algorithms allows the patient to be scanned in a single helical acquisition with reconstructions performed in any desired plane. This eliminates the need for direct coronal acquisitions, reducing the radiation dose by 50%. Current radiation dose (CTDI-vol) is 58 mGy at our institution for a typical orbit study in an adult, which involves a single helical acquisition on a Siemens Sensation 64-slice CT scanner. This is compared with 127.8 mGy performed in a two pass examination in both the axial and coronal planes. Direct coronal imaging is often uncomfortable for the patient, and many patients are unable to perform adequate neck extension. The rapid single acquisition scanning also allows most pediatric patients to be scanned without the need for sedation, and it is also ideal for the unstable trauma patient.
Optimal visualization of the orbit requires imaging from at least two planes. Formerly, direct coronal views were preferable to orbit reconstructions, which are typically performed in both the axial and coronal plane at 2.5-mm slice thickness and increment, using both the soft tissue and bone kernel. Additional 0.75-mm slice thickness and increment reconstructions are often performed on select orbit examinations. Contrast-enhanced orbit studies are typically obtained after a brief delay following contrast administration. Dual phase or multiphase scanning can also be performed, which involves scanning during both arterial and venous phases.
If it is not possible to obtain satisfactory reconstructed coronal views, then attempt to obtain direct coronal views because of better resolution.7,8 They can be obtained by having patients lie either prone or supine, extending their neck, and angulating the gantry sufficiently to provide coronal imaging while avoiding artifacts from the teeth. Direct coronal scans also should be no thicker than 3 mm.
After the orbit has been visualized adequately, it also has been our practice to obtain 10-mm axial slices through the remaining portion of the head to complete the study. Intravenous contrast material usually is given, although the low-density orbital fat produces an inherent high level of contrast for most orbital CT studies. Intravenous administration of iodinated contrast medium is most helpful in detecting intracranial extension of an orbital process or identifying a pathologic process involving the optic nerve or sheath, most notably optic nerve sheath meningioma. We usually administer 100 mL of contrast at a rate of 40 mL at 1 mL/sec, then 60 mL at 2 mL/sec. This is followed by a saline flush of 35 mL at 2 mL/sec. The total delay before scanning is 80 seconds. Specific contraindications for contrast material include allergy or renal failure.
If a patient with severe Graves’ orbitopathy, in whom the diagnosis is not in question, requires orbital CT scanning, it generally is performed without intravenous contrast.9 The administered iodine load would interfere with therapy directed at the thyroid gland and generally is not necessary to evaluate muscle enlargement or other features of Graves’ orbitopathy.
For proper interpretation, it is not necessary to understand all of the technical aspects of CT scanning, just as it is not necessary to understand completely the inner workings of a personal computer to benefit from it. Familiarity with certain terms and concepts, however, facilitates a more fundamental appreciation for some of the limits of CT scanning.
The CT image consists of a matrix (or grid) of small squares known as pixels. Resolution is increased by increasing the numbers of pixels that are used to create the image. Total pixel number is limited by image contrast necessary to differentiate the various tissue densities in the image. A higher numbered matrix is composed of smaller pixels. A voxel is the three dimensional (3D) counterpart that includes the added dimension of slice thickness.
By altering window setting and level of attenuation on the console, subtle differences in tissue composition or bone changes can be appreciated. Window setting refers to the amount of the pixel sampling used by the computer to determine image contrast. Level refers to the scale of density used by the computer to create the image. Both the window setting and level of attenuation are extremely important, for example, when evaluating lesions in the fossa of the lacrimal gland, when the surrounding bone must be examined carefully for either pressure thinning or tumor erosion.
The display console also has the ability to move a cursor to any area on the screen. The computer can then examine this area to determine its density. By convention, these density units are called Hounsfield units. Air and fat have the lowest values, whereas bone has the highest.
An appreciation for the various pathologic processes that affect the orbit is facilitated by an understanding of the normal orbital anatomy (Fig. 24.2). The orbit is a pyramid-shaped bony structure bounded inferiorly by the maxillary sinus, medially by the ethmoidal sinus, and superiorly by the frontal sinus. The sphenoidal sinus, which is situated posteriorly along the medial orbital wall, has a common wall with the optic canal. The lacrimal gland lies within its fossa located in the superior temporal aspect of the orbit and can be seen on both axial and coronal views.
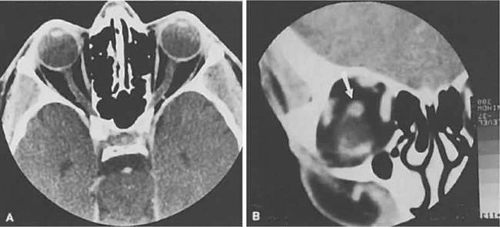 Figure 24.2. Normal anatomy. A. Axial scan through the plane of the optic nerve. Note the normal size of the horizontal rectus muscles and the undulating course of the optic nerve. B. Coronal view of the right orbit. The plane of section is slightly oblique to avoid dental artifacts and is immediately behind the right globe, which is partially volume averaged inferiorly. The arrow points to the optic nerve. |
The extraocular muscles (EOM), with the exception of the inferior oblique, originate from the annulus of Zinn in the orbital apex. The inferior oblique takes its origin from the frontal process of the maxilla and is seen occasionally on CT imaging. The superior oblique, after originating from the annulus, courses along the superior nasal orbital wall just above the medial rectus muscle before passing through the trochlea. The rectus muscles conveniently form a muscle cone, which is sometimes helpful in terms of differential diagnosis. Before thinner axial slices and multiplanar imaging were available, an enlarged inferior rectus muscle often was imaged as an apical mass, especially if dysthyroid optic neuropathy was present. The importance of imaging from two different planes cannot be overemphasized in this situation.
The superior ophthalmic vein (SOV) is an important vascular structure to recognize. It begins in the superior nasal quadrant near the trochlea before coursing posteriorly and laterally beneath the superior rectus muscle, exiting the orbit through the superior orbital fissure. Drainage is into the cavernous sinus. Asymmetric enlargement, especially in the presence of an ipsilateral cavernous sinus enlargement, suggests a vascular anomaly, which may require selective carotid angiography for further definition. Enlargement of one or multiple EOM in this setting is likely. The SOV also can be enlarged as a result of any process impeding drainage from the orbital apex, such as dysthyroid orbitopathy or metastatic disease.
The optic nerve occupies the central intraconal space. By necessity, the nerve has a certain amount of slack, which is necessary to permit movement of the globe. In the axial plane, the optic nerve has an undulating course and thus may appear thicker or thinner as a result of partial volume averaging as it passes in and out of the axial plane. It is imperative to recognize this normal pattern for proper interpretation of axial images.
The optic nerve itself is invested by the same meningeal layers that cover the brain, and the intracranial space may extend along the course of the optic nerve to the back of the globe. Enlargement of this space may be recognized as pseudomeningoceles of the optic nerve sheath. It is sometimes possible to tell whether the nerve, the sheath, or both are enlarged by CT scanning, although MRI affords the better view and can answer the question regarding what is enlarged.
Vascular Lesions of the Orbit
The orbital manifestations of a vascular process are dependent on whether the lesion is on the venous or the arterial circulation. Patients with distensible venous lesions (varix) characteristically report a history of intermittent proptosis with either a Valsalva-type maneuver or having the head in a dependent position. Suspicion of a venous varix should alert the radiologist to perform the scan before and after a Valsalva maneuver.10,11 Color flow Doppler imaging showing reversal of flow during a Valsalva maneuver also is a helpful finding. Phleboliths may or may not be present. Another clue to the diagnosis of a varix is the location, many times in the posterior, inferior lateral orbit, seemingly coming out of the inferior orbital fissure near the apex. Lesions that appear to change size or shape from the axial view to the coronal view (with patient repositioning) also have turned out to represent a varix based on our experience; however, this particular finding is not an issue if the CT scanner does not require patient repositioning (Fig. 24.3).
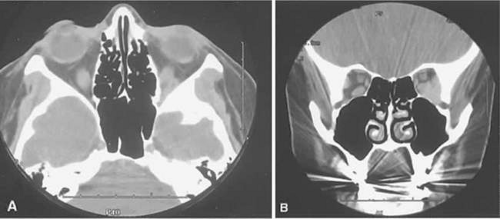 Figure 24.3. Orbital varix. A. Axial view shows a small soft tissue mass within the inferolateral left orbital apex. B. Coronal view with patient repositioned prone with neck extension. Increased venous pressure distends the varix, accounting for increased size. |
Arterial lesions may either have high or low flow. The high-flow lesions are carotid cavernous sinus fistulas and result from a direct communication between the carotid artery and the cavernous sinus. These arise spontaneously or as a result of trauma. The orbit is involved as an innocent bystander, because all signs and symptoms of orbital involvement follow from the retrograde transmission of increased venous pressure from the cavernous sinus. EOM generally are enlarged, as is the SOV. The ipsilateral cavernous sinus also is enlarged. Intercommunication between the cavernous sinuses also may account for the occasional bilateral findings.
Low-flow lesions result from increased blood flow through the cavernous sinus, but the intracavernous carotid artery itself is intact (an indirect fistula) (Fig. 24.4). These typically are dural-cavernous sinus fistulas. A high index of suspicion may be required to diagnose these, but a fairly stereotyped presentation is a unilateral red-eyed glaucoma with proptosis. Abduction weakness also may be present. Enlargement of one or more EOM along with an enlarged SOV are noted with CT scanning. A small lesion may escape detection with CT scanning and require high-resolution MRI or magnetic resonance angiography (MRA) or even selective internal and external carotid angiography for diagnosis if a high degree of clinical suspicion exists. In a patient with a known dural fistula, a sudden and dramatic deterioration in the clinical picture may be seen with a thrombosis of the SOV.12 The radiographic picture, at least regarding the CT appearance, probably will not change. MRI or MRA can nicely show the thrombosis in the SOV.
 Figure 24.4. Dural-cavernous sinus fistula. Axial view showing a dilated superior ophthalmic vein (SOV; arrows). Note the normal-sized SOV in the contralateral orbit. |
The finding of an enlarged SOV is most often associated with vascular lesions involving the orbit. The differential diagnosis of this finding is listed in Table 24.1.13
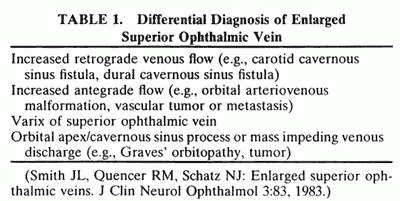 |
Inflammation of the Orbit
In a qualitative way, CT scanning has redefined some of the concepts regarding nonspecific orbital inflammations (orbital pseudotumor). We now appreciate that any or all structures within the orbit or orbits can be affected. Inflammation can be localized to an EOM (myositis), lacrimal gland (dacryoadenitis), optic nerve sheath (perioptic neuritis), orbital soft tissues (nonspecific inflammation), posterior scleritis, or trochlea (trochleitis). No satisfactory explanation about why or how this inflammation occurs and remains so localized exists, although some types may be associated with various systemic diseases, such as sarcoidosis, Wegener’s granulomatosis, or other vasculitic conditions.
The CT characteristics of each subgroup are different and are considered separately. The nonspecific inflammation, if diffuse and acute, can affect the entire orbit with an amorphous infiltrate, which enhances with contrast (Fig. 24.5). 14,15 The inflammation has been reported on occasion to spill over into the nasal.16,17,18,19 and intracranial compartments.20,21,22,23,24,25,26,27,28,29,30 Chronic inflammation also can appear dense and relatively homogeneous. The margins may or may not be regular, and the lesions usually enhance with contrast. Changes in the adjacent bone, either sclerosis, hyperostosis, or both, were seen on the CT in 30 (17%) of 176 patients with biopsy-proved pseudotumor.31
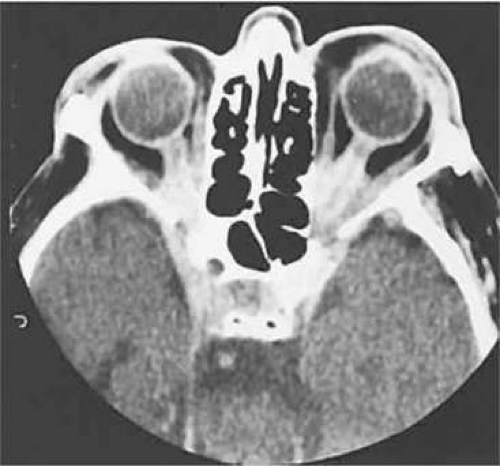 Figure 24.5. Chronic “sclerosing” inflammatory orbital pseudotumor. Axial view with enhancing amorphous infiltration involving each orbital apex and enveloping the optic nerves and rectus muscles. |
The CT evaluation of orbital myositis may show diffuse irregular enlargement of one or more EOM; enlargement can be bilateral (Fig. 24.6). In contradistinction to Graves’ orbitopathy, involvement of the tendinous insertion and edema of the adjacent fat may be noted. Other conditions associated with EOM enlargement are listed in Table 24.2.32,33,34
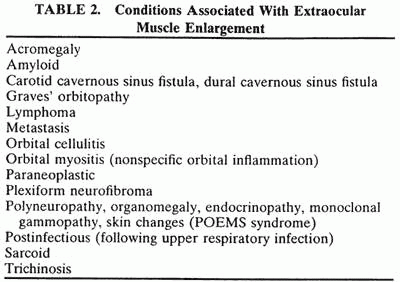 |
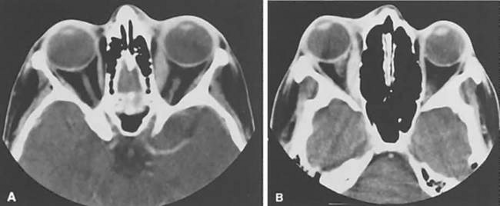 Figure 24.6. Orbital myositis. A. Note increased attenuation with enhancement of the thickened medial rectus and thickened scleral insertion. B. Thickening of the medial rectus muscle along the entire length of muscle is more evident. |
Nonspecific inflammatory dacryoadenitis shows enlargement of the lacrimal gland, which typically molds to the shape of the globe (Fig. 24.7). The adjacent bone is normal, and contrast enhancement of the gland usually is fairly homogeneous. Bilateral involvement may be apparent with certain conditions, such as Sjögren’s syndrome, sarcoidosis, lymphoma, or even Graves’ orbitopathy, although enlarged EOM in the latter condition might make this a more obvious diagnosis.
 Figure 24.7. Nonspecific inflammatory dacryoadenitis. Axial (A) and coronal (B) postcontrast views of a homogeneously enhancing mass of the right lacrimal gland. Note the similarity to Figure 24.19. |
On most occasions, the inflammatory categories listed earlier are idiopathic and nonspecific. Involvement of the adjacent paranasal sinuses should alert the clinician to the possibility of a systemic process, such as Wegener’s granulomatosis.35,36,37,38,39
Perioptic neuritis and trochleitis are the least common of the orbital inflammations. Clinically, perioptic neuritis shows signs of optic nerve dysfunction with pain and proptosis. The optic nerve may enhance, resembling acute optic neuritis40 or an optic nerve sheath meningioma.41
Stay updated, free articles. Join our Telegram channel

Full access? Get Clinical Tree


