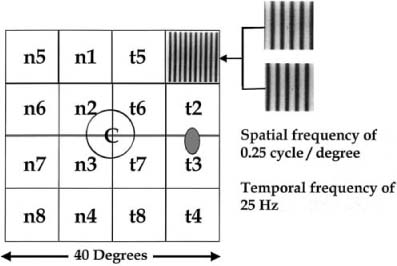
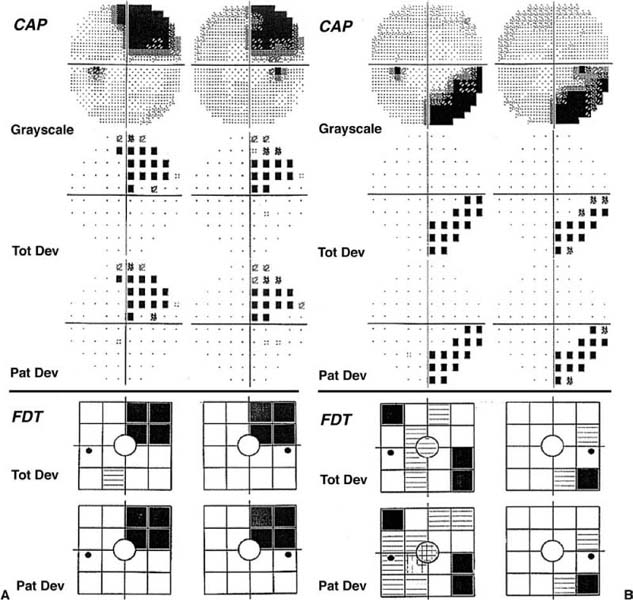
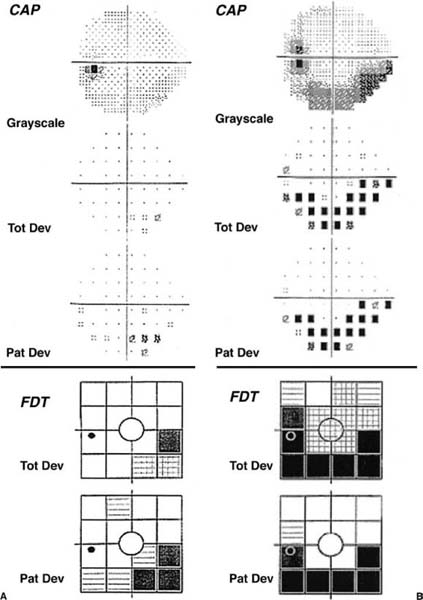
Chapter 4 The cornerstone of the sensory visual system examination is visual field testing. This chapter reviews the commonly used and currently available methods of perimetry, discusses the strengths and weaknesses of each method, and discusses interpretation of perimetry results. Confrontation visual field examination is rapid, reliable, and easy to perform. It is tailored to the clinical situation. Most examiners test patients monocularly using double simultaneous finger counting to survey the visual field for any dense quadrantic defect. Finger counting is followed by a test of the central visual field to evaluate for the presence of relative visual field defects. One such test is to have the subject look at the examiner’s face and report any difference from the expected. Another is to use two red objects and compare perception of the eyes or parts of the visual field. Unfortunately, for optic nerve–related visual field defects, finger confrontation identifies only ~10% of defects, whereas bedside confrontation techniques yield defects in about one third of patients with abnormalities on formal perimetry.1 Color confrontation techniques fare better with chiasmal defects, detecting about three fourths of patients.1 Even by combining seven confrontation visual field tests, only about half of perimetrically identified defects are found.2 Therefore, formal perimetry is usually necessary when the patient has visual loss not explained by a general ophthalmologic examination. Manual perimetry is most commonly performed utilizing the Goldmann bowl perimeter. Screening for glaucomatous defects is usually performed with the I4e and I2e isopters. Because the visual field inside 10 degrees is not a productive area for testing early in the glaucoma patient’s course, isopters smaller and dimmer than the I2e are usually not done. However, the dimmer isopters are the most sensitive ones for diseases that affect the foveal and parafoveal projections, and should be used routinely for general screening and neuro-ophthalmologic disorders. Failure to use a dim stimulus like the I1e results in an incomplete examination of the central 10 degrees. Manual perimetry with the Goldmann perimeter has many advantages. Since the perimetric stimulus presentation is done by a human, subjects can be cheered on, coerced, or cajoled into performing. When the perimetrist senses subject fatigue, a rest break is given. Unlike the fixed, 6-degree spaced grid of conventional automated perimetry, Goldmann perimetry has custom test point locations along with improvisation of strategies based on concurrent findings. Specific exploration strategies can be used for individual concerns. This allows for much more accurate mapping of defect shape. This can be invaluable for the topographic localization of visual field defects. However, manual perimetry is less sensitive than conventional automated perimetry due to stato-kinetic dissociation and may be more time consuming. Its most severe limitation, though, is that many perimetrists are not adequately trained.3 This may be worse than no perimetry at all. A standard automated static perimetry technique has evolved with the following characteristics: (1) Goldmann size III stimulus; (2) 31.5-asb background; (3) stimuli presented on a 6-degree spaced grid, offset 3 degrees from the horizontal and vertical meridia within the central 30 degrees of the visual field; (4) variation of stimulus luminance during the examination over a 4-log unit (40 dB) range; and (5) use of a 4 dB/2 dB staircase procedure to estimate detection thresholds (now often in concert with maximum likelihood methods). Typically, with the 4/2 staircase method, 52 or 76 thresholds of the central 21 or 27 degrees are determined in 10 to 20 minutes of testing per eye; the computer processes the data and summary statistics are calculated. Variations on this theme are available, but the 6-degree spaced grid has become standard. When threshold static perimetry of the central 10 degrees is needed, a 2-degree spaced grid is commonly used. Few other testing strategies are necessary or popular for conventional automated perimetry. Automation of perimetry has produced many benefits. Because of the delegation of stimulus presentation control and response recording to a computer, variability due to technique differences among perimetric examiners has been eliminated. Automation has also allowed static perimetry, a more sensitive method of testing, to become clinically practical. Sophisticated statistical analyses have been developed, many in an attempt to determine what constitutes the earliest or most subtle change in visual function. Unfortunately, in spite of control of more parameters, variability of conventional automated perimetry in areas of visual field damage remains high.4–6 Werner7concluded that clinicians should not make judgments about progression of disease in glaucoma subjects without at least six automated visual fields in hand. Data from simulations suggest at least eight visual field examinations are necessary.8 Some of the problems of automated perimetry are summarized by Glaser9: “Every physician who takes advantage of ‘high tech’ perimetry should undergo automated perimetry. Veterans of this optopsychic trip will attest to the need for a common ground between extensive point-threshold plotting and more practical screening procedures that do not exhaust patients, many of whom have seen quicker days. Amen.” Automated perimetry has been criticized for using too simple a stimulus. The test procedure is time consuming, boring and a difficult task for subjects to maintain attention to. Unfortunately, it is very susceptible to artifact (see below). Most importantly, its variability increases exponentially with decreasing sensitivity. This means that as the patient’s vision worsens, it becomes more and more difficult to correctly differentiate visual field fluctuation from true visual field change. However, automated perimetry is more sensitive than kinetic perimetry (statokinetic dissociation) and it is superior for quantitation of visual sensitivity. In spite of these problems and others, automated perimetry is replacing manual perimetry in ophthalmology clinics. Automated perimetry can be normal in some patients even if there is optic atrophy, a relative afferent pupillary defect, or other objective evidence of optic nerve damage. New forms of perimetry have been developed to detect early optic nerve disease. These are discussed below. Frequency doubling perimetry was developed for screening populations for evidence of glaucomatous damage to the optic nerve. Seventeen frequency-modulated, contrast stimuli are used (Fig. 4–1). It has been validated thoroughly for this purpose in normals and glaucoma subjects.10,11 As a glaucoma-screening device, the sensitivity of frequency doubling technology (FDT) perimetry is similar to that of conventional automated perimetry and its specificity is excellent.10,12 This has been extended to include other optic neuropathies (Fig. 4–2).13 Unfortunately, many hemianopic defects are missed with currently available FDT devices. This is due to light scatter across the vertical midline, the poor spatial resolution of the tests (only 17 stimuli) (Fig. 4–1), and camouflage of the hemianopic defect by the presence of scattered abnormal test locations (Fig. 4–3). However, the test is rapid, has good patient acceptance, and is an excellent screening device. Although this method has promise, it can be endorsed at present only for screening and evaluation of patients with optic neuropathies. The second version of FDT, called the Humphrey Matrix, uses smaller frequency doubled stimuli (5-degree diameter stimuli) with many more test locations. The test locations match the 6-degree spaced grid of conventional automated perimetry. This improves the resolution of the technique and mostly solves the hemianopia sensitivity problem discussed above. The large stimuli promote low variability and may prove useful for following patients. FIGURE 4–1 A 25-Hz alternating sinusoidal contrast grating stimulus used in frequency doubling perimetry, demonstrating the 10-degree-diameter test locations. FIGURE 4–2 A: A woman with idiopathic intracranial hypertension has in inferior arcuate defect well defined on both tests. B: A 28-year-old patient with idiopathic intracranial hypertension has an inferior arcuate defect seen on both tests. CAP, conventional automated perimetry; FTD, frequency doubling technology. Short wavelength sensitive perimetry is a modification of conventional automated perimetry. To isolate the blue cone system, a bright yellow background is used in combination with a Goldmann size V blue stimulus. Although the test is able to detect visual field defects in glaucoma patients before conventional automated perimetry, its high retest variability and poor patient acceptance limit its clinical use.14 FIGURE 4–3 A: A 53-year-old woman with a temporal lobectomy has a right superior homonymous quadrantanopia seen well with both tests. B: A 78-year-old man has a macular sparing congruous right inferior homonymous hemianopia with CAP due to a left occipital stroke. The defect is present on FDT, but noise from scattered abnormal test locations obscures identification of the homonymous hemianopia. The peripheral visual field is optimized for motion perception; it is therefore a very logical candidate for a visual stimulus. Various types of motion perimetry have been developed. All three prototypes, like SWAP, are able to detect visual field defects before they are apparent on conventional automated perimetry. Motion detection perimetry has been shown to have a low retest variability. None of these prototypes is commercially available. Another movement has been to develop “objective” perimetry. Kardon and coworkers15 have pioneered pupil perimetry. A Goldmann size V stimulus at maximum intensity is used, and pupil contraction amplitude is measured. Visual field defects can be plotted with patients only having to look at the central fixation stimulus and keep their eyes open. It is especially useful for malingerers. The multifocal visual evoked potential is an exciting new instrument developed by Sutter.16 The multifocal visual evoked potential (VEP) derives electrical potentials from 60 visual field test locations. Subjects view a changing checkerboard-like pattern, and electrical potentials are recorded from occipital electrodes. It requires only that the patient attend to a central stimulus. A study comparing conventional automated perimetry with the multifocal VEP in 30 glaucoma patients found a good concordance of visual field defects with the two methods.17 This is another test that has an important application for malingerers. With the many methods available, it can be confusing for the physician as to which one to choose. Because only conventional automated perimetry and Goldmann perimetry are usually available, we will limit our discussion to this choice. If a patient has visual loss of undetermined cause, the shape of the visual field defects is usually of critical importance. For example, central scotomas that do not connect to the blind spot usually indicate retinal disease, whereas cecocentral defects most often identify optic nerve disease. The 6-degree spaced grid of conventional automated perimetry may be inadequate resolution to delineate the shape of some visual field defects. In this setting, where the etiology of the visual loss is not yet determined, Goldmann perimetry is often superior. However, it is dependent on the availability of a well-trained perimetrist. If sensitivity is of utmost importance, automated perimetry is chosen. A typical example of this statokinetic dissociation is shown in Fig. 4–4. Lastly, because automated perimetry surveys only the central 21 (24–2 program) or 27 degrees (30–2 program), shape information outside the central field is lost (Fig. 4–5).
CHOICE AND INTERPRETATION OF VISUAL FIELD TESTING
STANDARD METHODS FOR PERIMETRY
CONFRONTATION VISUAL FIELD EXAMINATION
MANUAL PERIMETRY
AUTOMATED PERIMETRY
NOVEL METHODS FOR PERIMETRY
SHORT WAVELENGTH SENSITIVE PERIMETRY
MOTION PERIMETRY
PUPIL PERIMETRY
MULTIFOCAL VISUAL EVOKED POTENTIAL (SEE ALSO CHAPTER 46)
CHOOSING A METHOD FOR PERIMETRY
INTERPRETATION OF PERIMETRY RESULTS
RELIABILITY CRITERIA
Stay updated, free articles. Join our Telegram channel

Full access? Get Clinical Tree


