Burden of Blindness and Visual Impairment in the Population
James M. Tielsch
People do not really go blind by the million. They go blind individually, each in his own predicament.
—Sir John Wilson
Sir John Wilson eloquently described the primary motivating force behind all efforts involved in programs for the prevention of blindness and subsequent disablement. Although each individual case of blindness has its own story, the common features of these stories are what offer us the opportunity to interrupt the cycle of disease and inadequate care that lead to blindness. An epidemiologic or statistical approach identifies these common features, permits an assessment of the magnitude and severity of the problem, and identifies the primary disease entities responsible. Such information allows programmatic efforts to be effectively targeted at the most important problems and provides data against which such intervention programs can be evaluated. Until recently, however, adequate data have not been available on a population basis in the United States, and even now, nationally representative data on causes of blindness do not exist. International comparisons are problematic as well, with large variations in the diagnostic criteria used to determine causes of blindness.
SOURCES AND LIMITATIONS OF DATA
Information on the magnitude and severity of the blindness problem in the United States has come from numerous sources of varying quality and completeness. Beginning in 1830, the decennial census had been the principal source of information for estimating the number of blind persons in the nation.1 However, these data were based not on objective examinations, but on responses to a questionnaire. There was serious concern that this approach to measurement of the problem was inadequate due to a lack of standardization of the definition of blindness and to reluctance on the part of the population to report blind persons living in their homes. As a result, the routine collection of blindness data during the census was discontinued after 1930.2 The prevalence of blindness based on the 1930 census and defined as an inability to read even with the aid of glasses was 5.17 per 10,000 population.1
Blindness Registers
Registration of blind persons has been a popular approach to identifying and recording the number and characteristics of blind persons. Laws establishing blindness registers have been in place in selected states, including the first in Connecticut in 1893, to the most recent addition occurring in New Hampshire in 1970.3 As of 1986, blindness registers were in place in 27 of the 50 states in the United States.3 Reporting is mandatory in 12 states; however, only in Massachusetts does the law provide sanctions against those who fail to report.3
Properly used and maintained, blindness registers offer a cost-efficient method to collect detailed information on the magnitude and causes of blindness in defined populations. They also permit an analysis of trends over time in new registrations (incidence) and can assist in identifying a population to which services can be directed. However, the usefulness of such registries is directly related to their completeness and the consistency with which the data for each registrant are collected. Unfortunately, all blindness registries in this country, and most in other countries as well, significantly under ascertain blind persons.2,4 In addition, because of the social service benefits associated with being registered and the differential access to and utilization of eye care services, it is likely that the level of under ascertainment varies among different subgroups of the population. Another problem with registry data relates to the standardization of diagnostic criteria used to define the cause of blindness. Not all registries require cause of blindness information or specify the source of such data. In addition to the variations in diagnostic criteria used by different ophthalmologists, there are no generally accepted rules for cause assignment when there are two or more potential causes either in the same or different eyes of the same person.
Population-Based Surveys
Population-based surveys avoid the selection bias inherent in systems that require voluntary reporting, such as registries, and, assuming they achieve adequate response rates, provide unbiased estimates of the burden of vision loss in a population. A variety of such surveys have been conducted in the United States.
The most regularly conducted is the National Health Interview Survey (NHIS) from the National Center for Health Statistics. As with the previous attempts by the US census, it is based solely on responses to a questionnaire, with vision trouble defined as a positive response to the question: “Do you have any trouble seeing, even when wearing glasses or contact lenses?” Data from the 2003 version of the survey showed an age-adjusted prevalence of 8.8%.5 This prevalence increased with age from 5.2% among those 18 to 44 years, to over 20% among those 75 or older (Fig. 1). Lower socioeconomic status as measured by educational level of the head of the household, family income, or poverty status was also associated with higher reported prevalence of trouble with vision. Adults with family incomes below the poverty line were twice as likely to report trouble with vision as those with incomes ≥200% of the poverty threshold as defined by the U.S. census. While these data are not based on objective examinations and therefore cannot tell us the level of visual acuity loss or its cause, they are the only nationally representative data on functional visual status in the United States.
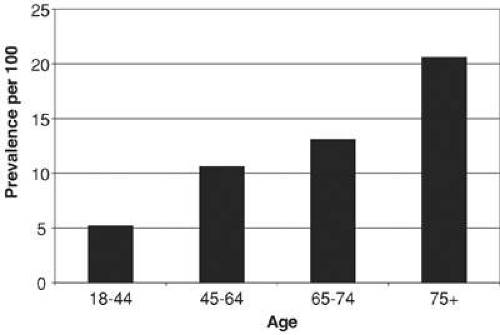 Fig. 1. Prevalence of trouble with vision by age, United States, 2003. (Data from Lethbridge-Çejku M, Vickerie J: Summary health statistics for U.S. adults: National Health Interview Survey, 2003. National Center for Health Statistics. Vital Health Stat 10(225), 2005.) |
The National Health and Nutrition Examination Survey (NHANES) is conducted regularly on a probability sample of the US population. As the effort and cost of this survey is large, it is done less frequently than the NHIS and only occasionally includes measurement of visual acuity and an ocular examination. The most recent data on vision from this survey were collected in 2003–2004 and have yet to be published. Even when published, the sample size of this survey will be inadequate to provide stable estimates on the prevalence of blindness, although data on less severe vision loss will be extremely useful.
The lack of adequate data on prevalence and causes of blindness as well as increasing interest regarding the epidemiology of selected ophthalmic diseases resulted in the conduct of a number of population-based studies in smaller, more selected populations over the past 30 years. These began with the Framingham Eye Study, which examined 2,631 persons 52 to 85 years of age who were survivors of the original Framingham Heart Study cohort.6 A serious limitation in the Framingham study was its lack of generalizability to populations that were not white and middle-upper class.
The modern era of population-based surveys began with the Baltimore Eye Survey conducted in the mid-1980s.7 Following the Baltimore survey were studies from rural Kentucky,8 Beaver Dam, Wisconsin,9 the eastern shore of Maryland,10 southern Arizona,11 and Los Angeles.12 A number of studies have also been done in other developed countries whose populations are similar enough to the United States to provide informative data on the burden of vision loss in the United States. These include studies from Melbourne13 and Sydney,14 Australia, and Rotterdam in the Netherlands.15 More recently, the investigators involved in most of these studies and others have pooled their data and made estimates for the United States as a whole.16
Stay updated, free articles. Join our Telegram channel

Full access? Get Clinical Tree


