Theoretically, ametropia might result from an anomalous dioptric apparatus or from an abnormal axial length of the globe. A dioptric apparatus that brings parallel rays of light to focus either in front of or behind the retina produces myopia or hyperopia, respectively. Obviously, the concept of too strong or too weak a refracting system is relative to a fixed axial length, but ametropia could equally well arise from a fixed dioptric power of an eye and a variable axial length. It is also obvious that refractive errors might arise from a mismatch between these two factors, and there is evidence to support each of these three views. In fact, ametropia is sometimes classified as being refractive, axial, or combination in type.
AXIAL LENGTH AS THE DETERMINANT OF REFRACTION
These theoretic possibilities have considerable practical implications. For almost the past 100 years, it has been widely accepted that refractive error is generally the result of anomalies in axial length.1,2,3,4 For all practical purposes, the hyperopic eye is a short eye, and the myopic eye is a long eye, although a mismatch between an eye’s axial length and its dioptric power also results in ametropia.2 These assumptions have led to an enormous amount of work aimed at disclosing the mechanism whereby the axial length of the eye remains short in some cases and grows abnormally long in others, with most attention having been given to the latter question.5
Steiger6 broke with the older views on the nature of emmetropia and refractive error. No longer regarding average values as constants, he postulated instead a wide range of refractive errors on the basis of distribution actually observed in the corneas of 5000 eyes, that is, a distribution conforming to a normal (or binomial) curve (Fig. 1). His measurements, which showed corneal values extending from 39 to 48 diopters (D) and a lack of any fixed corneal value for emmetropia, enabled Steiger to calculate the axial length in emmetropia as theoretically extending from 21.5 to 25.5 mm.
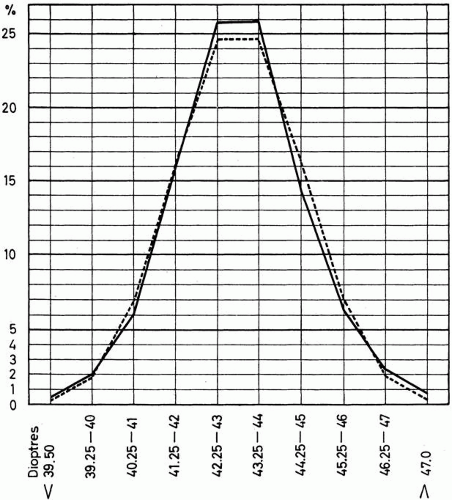 Fig. 1. The normal (binomial) distribution of power of cornea in 5000 eyes in boys. (Steiger A: Die Entstehung der sphärischen Refraktionen des menschlichen Auges. Berlin, Karger, 1913.) |
The rather simple scheme postulated by Steiger is no longer tenable, as it led to a theoretically normal distribution of refractive error (Fig. 2), but his seminal work is the starting point of current ideas about the ocular components and refractive error. Current views are based on knowledge of the distribution of the refractive error in the general population and on the measurement of the various individual components of refraction (corneal power, anterior chamber, crystalline lens anterior and posterior surface curvature and thickness, vitreous chamber depth, and axial length).
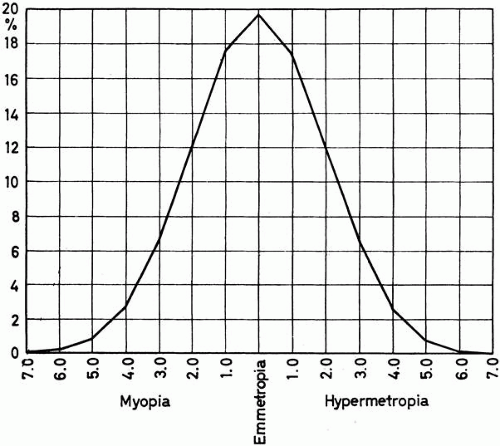 Fig. 2. Theoretic curve of range and distribution of ocular refraction on the assumption of free association of corneal power and axial lengths, both normally distributed. (Steiger A: Die Entstehung der sphärischen Refraktionen des menschlichen Auges. Berlin, Karger, 1913.) |
REFRACTIVE ERROR DISTRIBUTIONS
A number of curves giving the distribution of the different refractions in various sample populations are available. Some of these curves are derived from clinic-based patients and are, therefore, potentially biased. Others deal with specialized populations, such as children or specific ethnic groups. Curves substantially free from selection bias are few. The distribution of refractive error in British national service recruits is depicted in Figure 3 (1033 men).7 No comparable curves are available for women.
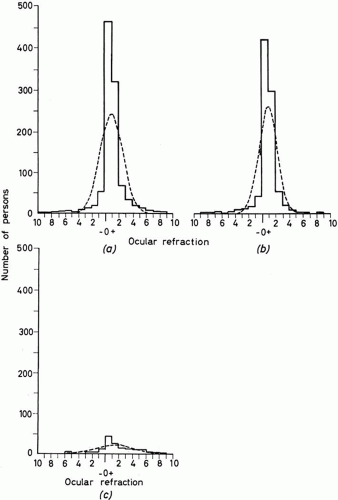 Fig. 3. Curves of distribution of refractive error in 1033 national service recruits in England in 1957. All refractive error in the better eye is shown as the solid line. The broken line represents the underlying normal distribution with the same mean ocular refraction. a. All refractions. b. Spherical refractions (with astigmatism of from 0 to 0.5 D). c. Astigmatic errors (astigmatism of 0.6 D or more with or without a spherical error). (Sorsby A, Sheridan M, Leary GA: Vision, visual acuity and ocular refraction of young men. Br Med J 1:1394, 1960.) |
There are significant deviations from a normal distribution in Figure 3. The peak of the distribution is at approximately +1.00 D of hyperopia and represents a disproportionate number of people with low hyperopia (leptokurtosis). Moderate myopia and hyperopia are underrepresented in the actual data relative to the theoretic normal distribution, and high myopia and hyperopia are overrepresented. In this general population (as shown in Fig. 3), a high proportion has no refractive error by any practical definition. Seventy-five percent of the sample of national service recruits had refractive error between 0.00 and +1.90 D.
The considerable excess of emmetropic and nearly emmetropic refractions in Figure 3 and in other samples excludes the possibility that such refractions are the result of a random combination of components of refraction, whereas the probable excess of high myopes and high hyperopes suggests that these fall outside the mechanism that produces coordinated emmetropic and nearly emmetropic eyes.
OPTICAL COMPONENTS OF REFRACTION
NORMAL DISTRIBUTION AND AGE/GENDER EFFECTS IN CHILDHOOD
Figure 4 from Sorsby’s original work2 shows that although refractive error was not normally distributed but followed the pattern seen in Figure 3, all the individual components were normally distributed. The data in Figure 4 depict the distribution of the components in adults; axial length was calculated from the other variables.
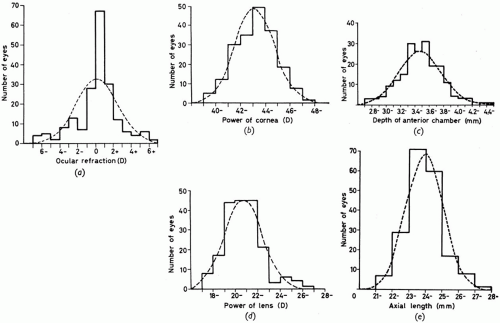 Fig. 4. Curves of distribution of refraction and its components in 194 eyes. Solid line, actual distribution; broken line, normal curve. (Sorsby A, Benjamin B, Davey JB, et al: Emmetropia and Its Aberrations. London, Her Majesty’s Stationery Office, 1957.) |
The Orinda Longitudinal Study of Myopia,8 now continuing as the Collaborative Longitudinal Evaluation of Ethnicity and Refractive Error (CLEERE) Study,9 is the first study to measure all the ocular components in school-aged children. Figure 5 depicts the distribution of the ocular components, and Table 1 describes these data as a function of age and gender.
Table 1. Ocular Components in Children Enrolled at Baseline (1997–98 Academic Year) in the Collaborative Longitudinal Evaluation of Ethnicity and Refractive Error (CLEERE) Study, as a Function of Age and Gender | |||||||||||||||||||||||||||||||||||||||||||||||||||||||||||||||||||||||||||||||||||||||||||||||||||||||||||||||||||||||||||||||||||||||||||||||||||||||||||||||||||||||||||||||||||||||||||||||||||||||||||||||||||||||||||||||||||||
|---|---|---|---|---|---|---|---|---|---|---|---|---|---|---|---|---|---|---|---|---|---|---|---|---|---|---|---|---|---|---|---|---|---|---|---|---|---|---|---|---|---|---|---|---|---|---|---|---|---|---|---|---|---|---|---|---|---|---|---|---|---|---|---|---|---|---|---|---|---|---|---|---|---|---|---|---|---|---|---|---|---|---|---|---|---|---|---|---|---|---|---|---|---|---|---|---|---|---|---|---|---|---|---|---|---|---|---|---|---|---|---|---|---|---|---|---|---|---|---|---|---|---|---|---|---|---|---|---|---|---|---|---|---|---|---|---|---|---|---|---|---|---|---|---|---|---|---|---|---|---|---|---|---|---|---|---|---|---|---|---|---|---|---|---|---|---|---|---|---|---|---|---|---|---|---|---|---|---|---|---|---|---|---|---|---|---|---|---|---|---|---|---|---|---|---|---|---|---|---|---|---|---|---|---|---|---|---|---|---|---|---|---|---|---|---|---|---|---|---|---|---|---|---|---|---|---|---|---|---|
| |||||||||||||||||||||||||||||||||||||||||||||||||||||||||||||||||||||||||||||||||||||||||||||||||||||||||||||||||||||||||||||||||||||||||||||||||||||||||||||||||||||||||||||||||||||||||||||||||||||||||||||||||||||||||||||||||||||
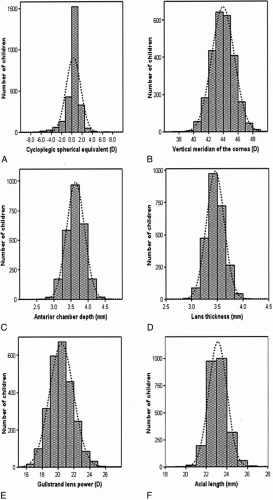 Fig. 5. Distribution of the major ocular components from children enrolled in the Collaborative Longitudinal Evaluation of Ethnicity and Refractive Error (CLEERE) Study in the 1997–98 school year. (Zadnik K, Manny RE, Yu JA, et al for the CLEERE Study Group: Ocular component data in schoolchildren as a function of age and gender. Optom Vis Sci 80:226, 2003.) |
As would be expected with the continued ocular growth of children, there was a significant effect of age on refractive error (spherical equivalent [p < .0001]). Children 6 or 7 years old were more hyperopic than children 9, 10, 11, 12, 13, or 14 years old. Similarly, children 8 years old were more hyperopic than those aged 10 to 14 years, and the mean spherical equivalent for 9-year-olds was greater than for 14-year-olds. Using our a priori criterion for significance (p < .005), there was no difference in the spherical equivalent values obtained from girls and boys (p = .0118).
For corneal power in both the vertical and horizontal meridians, there was a significant effect of gender. Girls, on average, had corneas 0.74 D steeper in the vertical meridian (p < .0001) and corneas 0.63 D steeper in the horizontal meridian (p < .0001) compared with boys. There was no effect of age on corneal power in either meridian (p = .16).
Both age and gender were significantly associated with anterior chamber depth (p < .0001 for both). Children 6 and 7 years old had significantly shallower anterior chambers than did children 9 to 14 years of age. In addition, children aged 8 years had significantly shallower anterior chambers compared with children aged 12 or 13 years. Girls had anterior chambers that were, on average, 0.08 mm shallower than the anterior chambers of boys.
Although the crystalline lens showed a significant thinning effect with age (p < .0001), there was no difference in lens thickness between girls and boys (p = .66). The mean lens thickness was significantly greater for children aged 6 and 7 years compared with children aged 8 through 13 years. There was also a significant difference between the mean at age 8 years and the mean at age 12 years.
Both Gullstrand lens power and calculated lens power showed significant effects of age and gender. Girls, on average, had Gullstrand lens powers that were 0.28 D stronger and calculated lens powers that were 0.80 D stronger than those of boys (p < .0001 for both). As with the other components discussed above, mean differences in both lens power variables were observed as a function of age. The mean Gullstrand lens power was significantly stronger in children aged 6 and 7 years compared with children aged 8 to 14 years, in children aged 8 years compared with children aged 10 to 13 years, and in children aged 9 years compared with those aged 12 years. Calculated lens power differences were observed for children aged 6 compared with those aged 7 to 14 years, children aged 7 years compared with those aged 9 to 14 years, children aged 8 years compared with those aged 9 to 13 years, and children aged 9 years compared with those aged 12 years.
Stay updated, free articles. Join our Telegram channel

Full access? Get Clinical Tree


