Automated Perimetry Diagnostic Modalities in Ophthalmology
Andrew M. Prince
Ann C. Mendoza-Fisher
Nathan M. Radcliffe
Visual field testing has evolved considerably since the advent of automated perimetry. The transition from kinetic to static threshold perimetry has doubtlessly altered our conception of the field of vision. Computerized perimetry has provided a new technology for visual screening and the detection and management of glaucoma and may also be useful in the management of certain neuro-ophthalmologic and posterior segment disorders. Automated threshold perimetry facilitates standardized, accurate, and reproducible visual field testing in any office setting and has allowed for more reliable methods of quantitating the visual field for clinical as well as research purposes.
HISTORICAL OVERVIEW
The delineation of normal and pathologic visual fields has challenged investigators for centuries. Mariotte, in 1668, described the physiologic blind spot, the first identified scotoma. Thomas Young,1 in 1801, was among the first to provide precise measurements of the visual field. Approximately half a century later, von Graefe2 reported characteristic central and peripheral visual field defects in glaucoma and neurologic disorders. Förster3 devised the arc perimeter in 1869, and Bjerrum4 formulated the concept of the tangent screen visual field testing in 1889, which led to the development of quantitative kinetic campimetry. Sloan5 is credited with first describing stationary or static perimetry in 1939, but it was Goldmann6 who, in 1945, standardized instrument variables and introduced what has evolved as the prototype manual kinetic perimeter. Harms and Aulhorn,7 in 1959, combined static and kinetic perimetric methods in designing the Tübingen perimeter. Automated kinetic perimetry was introduced by Dubois-Poulsen and Magis8 in 1966. Lynn and Tate9 developed the first automated static perimeter in 1969. Since then, many other investigators have contributed to the evolution of automated perimetry and the computerized analysis of test data.
Recent advances in visual field testing, qualitative and quantitative algorithms for visual field interpretation, and the need for earlier glaucoma detection make it important for ophthalmologists to comprehend the basic principles and applications of automated perimetry. This warrants familiarity with the basic terminology and principles of kinetic field testing as well as several concepts of visual physiology.
MANUAL PERIMETRY
Traquair10 defined the visual field as an “island of vision in a sea of darkness.” This island or hill of vision was contoured as a three-dimensional graphic representation of differential light sensitivity at each point in the field of vision, with the peak corresponding to foveal fixation. This manner of conception of the field of vision facilitates a clear understanding and comparison of kinetic and static techniques of visual field testing (Fig. 109-1). Perimetric evaluation of the visual field by an examiner without automation may be accomplished by static testing, kinetic testing, or a combination of the two means. Static testing involves presenting stimuli of varying sizes and intensities at a fixed location to determine the presence and depth of a scotoma. In manual kinetic perimetry, a series of stimuli of fixed intensity and size are moved from nonseeing to seeing areas of the visual field. The foci identified kinetically as corresponding to points of equal retinal sensitivity along the various meridians are connected by a curve, constituting an isopter. Each isopter, therefore, represents a horizontal cross section through a given level of the topographic hill of vision (Fig. 109-1). The techniques for kinetically determining a mapping of the visual field include tangent screen, arc perimeter, autoplot, and Goldmann-type perimeters.
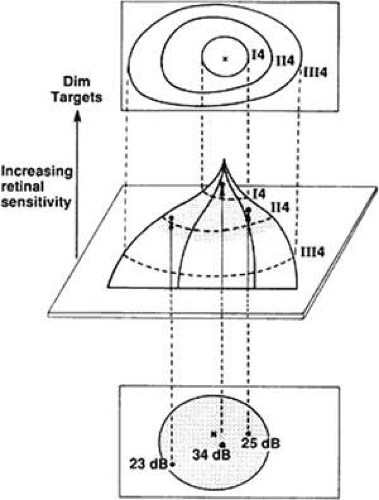 Figure 109.1. Center. A graphic representation of the Traquair island of vision. The island contour represents the field of vision, where the higher a locus is situated on the island, the more sensitive the point on the corresponding visual field at points corresponding to the peak of the island (foveal fixation). Top. The curves (isopters) labeled I4, II4, and III4 on the island of vision connect corresponding areas of equal threshold sensitivity and are plotted (kinetic perimetry). Bottom. The shaded region on the island delineates the area of the visual field to be tested statically. The three points within the shaded area on the surface of the island of vision have a specific height and therefore a threshold value. These values are recorded as points with specific threshold sensitivity values (dB). |
Tangent screen visual field testing represents a form of campimetry, or measurement of the field of vision on a flat surface. Once suspicious areas are identified by kinetic techniques, with white or colored test objects, the depths of scotomas may be further explored by a static method with various stimulus sizes. Screening may also be accomplished by static suprathreshold testing by exploring various regions with a suprathreshold stimulus. Tangent screen field testing is inexpensive and convenient, requires relatively little training, and permits rapid assessment of various pathologic states, particularly in neuro-ophthalmology. However, test parameters such as background illumination are not standardized and stimulus intensity cannot be varied. Also, the chore of monitoring patient fixation rests with the examiner. Visual field testing is generally limited to the central 30°, and evaluation of patient reliability is purely subjective.
Arc perimetry consists of a semicircular white band, with a radius of approximately 330 mm, serving as the background on which stimulus lights are presented. The band may be rotated at various angles to test desired meridians. Many of the same limitations of tangent screen testing are present, although perimetry may be performed beyond 30° as well as centrally.
The introduction of the manual bowl projection perimeter of Goldmann permitted standardization of testing distance, background illumination, stimulus size, and stimulus intensity. The bowl of the Goldmann perimeter measures 300 mm in radius and extends 95° to each side of fixation, enabling central and peripheral field testing. Stimulus size and intensity, measured in the luminance units apostilbs (asb), can each be varied. By manual kinetic techniques, the stimulus is moved at a constant rate from a nonseeing area along each meridian until identified by the patient. Foci of identical retinal threshold sensitivity (isopters) are thereby identified.
Goldmann perimetry can also be used to obtain quantitative information by static threshold testing to further delineate the extent and depth of field cuts by varying stimulus parameters. Static suprathreshold methods may also be used for rapid screening purposes. Test strategies such as the Armaly-Drance technique use both static and kinetic methods. This method uses the Goldmann perimeter with static suprathreshold screening of the central field and static suprathreshold as well as kinetic techniques to explore the periphery.11,12,13,14,15,16
The Harms or Tübingen perimeter is another example of a manual bowl-type perimeter capable of both static and kinetic field testing. The primary intent of the Tübingen perimeter, however, was for static threshold examination because the stimulus intensity may be varied for fixed test objects.7,17
Manual static methods are often fatiguing for the patient and time consuming. Kinetic techniques, although more rapid, are more dependent on patient reaction time and speed of target movement, and are less quantitative. Manual perimetry, in contrast to automated techniques, is certainly less expensive and provides for greater perimetrist–patient interaction. Automated techniques are more reproducible, provide standardized testing strategies, and are less subject to examiner experience and technique.
Many of the principles of visual physiology, testing strategies and patterns, and examination limitations and variables of kinetic perimetry also apply to automated perimetry.
COMPUTERIZED AUTOMATED STATIC PERIMETRY
Computerized automated static perimetry involves determining a map of a field of vision by using a system whose operation is conducted by a machine programmed to perform explicit mathematical calculations (algorithms), taking the place of human operation, effort, and decision making. This does not imply that the automated perimeter can determine who requires an examination, which examination to perform, or the value of the information obtained, nor can it make diagnoses or clinical decisions. It is a tool for obtaining additional diagnostic data to be used in the care of a patient, to be orchestrated by a physician. Several statistical programs have been developed and are also currently underway that can make quantitative assessments of changes observed over time in an individual’s field results or compared to a standardized group.
When the technology for automating perimetry became available, it was determined that automating kinetic perimetry was going to be a more difficult and involved chore than automating static perimetry. Although both would require controlling stimulus intensity and size, automating kinetic perimetry would also demand managing the speed and direction of stimuli in various patterns.
Since the initial prototypes of automated perimetry were introduced, numerous instruments have been made available to clinicians, with some products being discontinued and new ones introduced as several companies changed hands. New machines continue to be made available with repeated improvements in both hardware and software, as a result of progressive advances in research physiology and computer technology. Machines are available with a broad range of capabilities as well as monetary cost. Choosing an instrument and program must involve a careful determination of the purpose of the machine, its cost, capabilities, and ease of use, and the patient population to be tested.
Throughout this chapter, references will be made to and examples given using the Octopus perimeter (Haag-Streit USA)18 and Humphrey Field Analyzer (Carl Zeiss Meditec, Inc.).19 These instruments were chosen because the vast majority of published studies have used these perimeters. There are many other machines available that perform comparably with these devices, and we are not endorsing either of the aforementioned products. Because most instruments have many characteristics in common, including hardware and software, most of the comments and observations made may be applied to any automated perimeter.
ADVANTAGES
Automated perimetry offers numerous advantages over manual techniques. Test administration is more standardized and therefore more reproducible. Less input from a technician is required, minimizing testing variability. Reliability is improved with automated fixation monitoring and reduced examination time for static testing compared with manual static testing. Patient dependability may be quantitated and statistically assessed. Certain instruments provide the ability for data storage, allowing for statistical comparison of sequential fields and transmission of data. In addition, several studies have demonstrated that automated static techniques are as good as or superior to kinetic perimetry in detecting certain field defects.20,21,22,23,24,25,26 Finally, the limitation in manual perimetry of requiring a well-trained and experienced technician is eliminated, with minimal training necessary for machine operation.
DISADVANTAGES
There are, however, disadvantages of automated perimetry. Automated perimeters are markedly more expensive than manual devices, require mechanical servicing, and therefore may have considerable periods of downtime. A significant number of patients do not test well with automated devices but perform well with manual techniques. Full-field threshold testing may be prolonged, limiting the number of patients examined as well as causing patient fatigue, with possibly unreliable data. Alternate testing algorithms have been developed to address these issues by reducing test-taking time.
THRESHOLD
A clear comprehension of the concept of threshold is needed for understanding automated static perimetry. Threshold is defined as the minimal intensity of light at which a stimulus is perceived by the visual system at a specific location in the field of vision. In statistical terms, threshold is defined as the point on a frequency- or probability-of-seeing curve at which a stimulus is perceived 50% of the time. Suprathreshold stimuli are those perceived more than 95% of the time on the frequency-of-seeing curve, or any stimulus brighter than threshold. Infrathreshold stimuli are those perceived with a frequency of <5%, or any stimulus weaker than threshold. In actuality, an automated perimeter determines a threshold value by presenting stimuli of gradually increasing and decreasing intensities, determining the dimmest stimulus presented that is seen and the brightest that is not seen, and either averaging these values or using the last seen or not-seen stimulus as the threshold value. Threshold sensitivity may vary with retinal adaptation (background illumination), stimulus color and size, duration of stimulus presentation, and degree of stimulus movement.27 Static perimetry requires presenting a stimulus of varying intensity at a fixed location to determine the threshold sensitivity at that locus. This technique is performed at every designated location in a preselected area and pattern, and a map of threshold sensitivities for a given field of vision is generated (Fig. 109-1).
LIGHT INTENSITIES
An understanding of the means by which values of light intensities is expressed is essential in analyzing automated visual fields. Apostilbs, an absolute measurement of light intensity reflected from a surface (luminance), are used in quantitative manual perimetry. When expressed in apostilbs, the range of intensities between the dimmest and brightest stimuli produced by a perimeter is quite large, as is the range of intensities of light over which the human eye is sensitive. Because variations in presented light intensities are not perceived in a linear manner but on a relative scale, the decibel scale, a logarithmic scale based on the maximum stimulus a perimeter may produce, proves to be a convenient method for expressing retinal sensitivities. Unlike apostilbs, decibels (dB) are logarithmic units (reciprocal of log intensity in apostilbs) and delineate a certain degree of reduction of a maximum stimulus that may be generated by a given perimeter.28 Intensities are expressed in decibel values where 1 dB is 0.1 log unit. The range of stimuli intensities provided by the Humphrey perimeter is 0 to 10,000 asb, corresponding to 50 to 0 dB, respectively. The Octopus perimeter may generate a range of stimuli from 0 to 1,000 asb, equivalent to 40 to 0 dB, respectively. The higher the decibel value of threshold sensitivity for a given locus in the visual field, the dimmer that intensity is in apostilbs, and the more sensitive the visual system must be at that point for the stimulus to be perceived. Therefore, defective areas of a visual field present themselves as points in the visual field printout with lower decibel values than those in the surrounding normal areas.
MACHINE CHARACTERISTICS
Cupula
Background Illumination
Background illumination also varies among perimeters and is important in its effect on the level of retinal adaptation as well as the degree of contrast that may be generated. The level of background illumination in the Octopus perimeter is 4 apostilbs; the Humphrey Field Analyzer’s is 31.5 apostilbs, similar to the Goldmann perimeter.18,19 Dimmer backgrounds allow a machine to present brighter stimuli to the visual system with respect to background light, which is helpful for evaluating patients with markedly reduced sensitivities. The disadvantage is the risk of shifting retinal sensitivity from the photopic range, with a subsequent alteration in retinal sensitivities. The effect of media opacities to decrease retinal sensitivities may be more pronounced in instruments using lower background illuminations.29 The possible advantages of the brighter background include the shorter time required for adaptation from ambient lighting conditions before test initiation and a testing situation in which the examination is less sensitive to aberrant light. Although white light is typically used, the color of the background illumination can be altered. For example, in short-wavelength automated perimetry (SWAP), discussed later, yellow background illumination is used.
Stimulus Sources
Instruments use three basic stimulus sources. The first is a fiberoptic cable system, with the advantages of low cost, no moving parts, and quiet operation. Its disadvantages include minimal flexibility in that stimuli are at fixed locations, are of fixed size, and cannot individually alter their intensities during any one examination. The light-emitting diode (LED) system has the same advantages and disadvantages as the fiberoptic system but is somewhat more flexible in that intensities of stimuli can be altered individually during a program. An additional disadvantage of both systems is a potentially increased variability of results compared with projection perimeters.30,31 The projection system, used by both the Octopus and Humphrey perimeters, allows the greatest flexibility and versatility in the selection of test point locations as well as stimulus size, intensity, and color. Its disadvantages include expense, noise production, and need for more frequent maintenance. Unlike the fiberoptic and LED systems, the projection method allows for possible adaptation to kinetic capabilities.
Stimulus Size
Most instruments incorporate a stimulus size equal to that of a Goldmann III target (4 mm2, 0.431°). Projection perimeters allow for the use of larger targets, which may allow quantification of focal defects in the presence of generalized field depression and identification of small remaining portions of the visual field in cases of extensive loss.32 LED and fiberoptic cable systems do not allow for the changing of target sizes. Stimulus size may be varied in patients with reduced retinal sensitivities or in algorithms designed to assess the field of vision at a lower spatial resolution (e.g., SWAP).
Stimulus Intensity
The perimeter may be programmed for testing at a fixed intensity or at a few levels of intensity, or to vary intensities for determining threshold sensitivities at test locations. Ranges of stimulus intensities vary among machines. The Humphrey Field Analyzer generates stimuli that range between 0 and 10,000 apostilbs (51–0 dB, respectively); the Octopus provides a range of 0 to 1000 apostilbs (40–0 dB, respectively).18,19 A fixed stimulus intensity in apostilbs has a different value in decibels on machines with different maximum stimuli, because decibels are relative measurements depending on maximum stimuli. A patient’s ability to perceive a stimulus depends on the intensity of the stimulus in addition to the level of background illumination.
Stimulus Durations
Stimulus durations usually range between 0.1 (Octopus) and 0.2 (Humphrey) seconds,18,19 but they can be altered by the examiner with certain instruments. These values have been chosen because it has been shown that duration times >0.5 s have no effect on the ability to detect stimuli by temporal summation, and exposure times >0.2 s correspond to a patient’s reaction time to the stimulus and might cause a shift in fixation.27
Fixation Monitoring
Reliable fixation is essential for automated perimetry. Available techniques include viewing the patient’s eye, electronic eye motion detectors, and blind-spot monitoring. Combinations of these systems are often used by various perimeters. The technician can view the patient’s eye directly either with a telescope or a closed-circuit television monitor. Images of the eye may be taken from a camera coupled to a bowl-centered telescope and then easily viewed by the examiner. Eye movement sensors are the most sensitive fixation deviation detectors. Photoelectric detectors of corneal reflectivity and pupil image monitors are used. The disadvantage of fixation monitoring by electronic sensors is that it may be too sensitive, responding to minor physiologic alterations in fixation such as respirations or blinking. The blind-spot projection technique, the Heijl-Krakau method,33 assumes that if fixation is unchanged during an examination, the blind spot should remain constant. During an examination, the machine presents suprathreshold stimuli into the presumed or previously mapped blind spot. If the stimuli are seen, fixation has changed; if not, fixation has been maintained. The disadvantages include increased testing time and unknown status of fixation between points tested. Another disadvantage is that the visual field being tested may be only a central 10° island (as in advanced glaucoma or retinitis pigmentosa), in which case a physiologic blind spot cannot be localized. If there exists a scotoma contiguous with the blind spot and deviations from fixation occur, if blind-spot checking stimuli are presented in the scotoma, fixation losses will not be detected. The advantage of the blind-spot projection technique is that it is less expensive and sensitive than electronic sensors and does not require technician input. This technique is usually supplemented by a telescope or video monitor, allowing the examiner to oversee fixation. When these techniques are used in combination, as they often are, monitoring of fixation is excellent.
In general, fixation is improved with random presentations of stimuli where patients cannot as easily anticipate the location of the next stimulus. For patients with central scotomas who cannot fixate on a central target, most instruments direct fixation by having patients look at the center of a diamond or cross pattern.
Data Storage
Although not all perimeters have this capability, one of the greatest advantages of computerized automated perimetry is its capacity for data storage. Data are stored on hard disk or a floppy disk; this prevents data loss when the hard copy is inaccessible. Storage of data also permits statistical analysis and manipulations of individual visual fields or serial examinations of the same patient, as well as transfer of information to a central computer or another clinician or researcher. With greater use of electronic medical records, networked transferring of perimetric results has become more important. Most automated perimeters allow networked data transfer of visual field results in both a portable document format (.pdf) and raw data format.
SOFTWARE DESIGN
Testing Patterns
Most instruments make available a series of basic testing patterns, allowing the examiner to choose the area of field to be tested and the density and distribution of points within. The options for areas to be tested include the central 30°, the peripheral 30° to 60° area, full 60°, central 10°, and central 5°. Special test configurations are also available, including glaucoma patterns (central 30° plus peripheral nasal step area and temporal periphery), peripheral nasal step area, temporal crescent region, and neurologic patterns for examining the vertical meridian. Custom tests for obtaining additional detail in certain abnormal areas may be added to any portion of the field in different patterns such as grids, clusters, or individual points. With certain instruments, the examiner has the option of combining several different patterns to increase the density of testing locations or total area tested. Custom tests can be stored and reused in subsequent testing.
Testing Strategies
Two basic categories of testing strategies are offered by most instruments: suprathreshold testing and threshold determinations.34 Either of these modalities of testing can be used with most of the previously discussed patterns or variations thereof.
Screening
Suprathreshold (supraliminal) screening enables rapid discovery of gross field defects. However, the degree of the resolved sensitivity decrease is not determined. A fixed stimulus that is presumed to be threshold at approximately 30° is used for the entire test area, without compensating for the normal contour of the hill of vision—that is, without adjusting for decreased sensitivity with increasing eccentricity (one-level or single-intensity strategy). These suprathreshold stimuli of fixed intensity are presented throughout the designated testing area. The tested points are recorded as either seen or not seen.
An alternative technique is the threshold-related screen. This strategy involves using a varying stimulus intensity at different test points, taking into account the effects of eccentricity on the expected threshold levels. The expected values are determined by either thresholding at two or four points in the field at the initiation of the test (prethresholding) or estimating the height of the hill of vision using age-matched normals. The intensity of the stimuli presented at any given point in the field is suprathreshold, usually 5 to 6 dB brighter than the expected threshold value. The points can be recorded as either seen or not seen (Figs. 109-2 and 109-3). Unseen points can then be tested with maximal stimuli to determine whether they are absolute or relative defects (three-zone strategy). These unseen points may also be thresholded to determine actual sensitivity at these defective locations. Certain strategies allow for testing of additional points around any abnormal points to delineate the size and density of the detected scotoma. The prethresholding strategy compensates for generalized depression, unlike using age-matched normals, better enabling the detection of localized abnormalities.
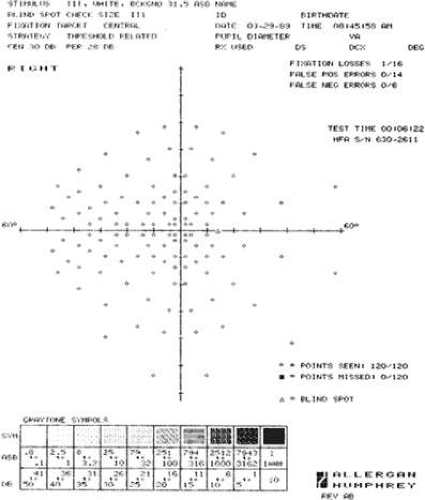 Figure 109.2. Threshold-related screen. This screening examination on the Humphrey Field Analyzer encompasses a full 60° from fixation with 120 test locations. Results will be recorded as either seen (open circles) or not seen (solid squares). The center of the blind spot is designated as a triangle. This is a normal screening visual field examination. |
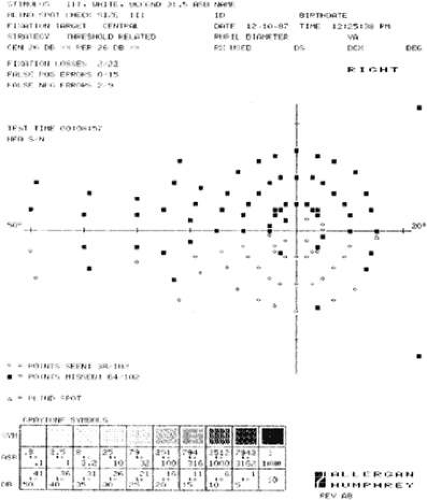 Figure 109.3. Threshold-related screen. This test is an Armaly full-field screening examination, intended for glaucoma testing. The examination emphasizes testing of the central field but includes screening of the peripheral nasal horizontal meridian for nasal steps and temporal periphery for sector defects. This examination is abnormal, demonstrating marked nasal constriction, a dense superior arcuate scotoma, and several abnormal areas in the inferior paracentral region. Full threshold testing is indicated to quantitate the abnormal field. |
To designate the sensitivity level at which the screening test was run, or the height of the patient’s hill of vision, the perimeter reports the central reference level. This represents the extrapolated sensitivity at fixation determined by thresholding several reference points away from fixation.
Threshold Determinations
Threshold determination gives the most accurate and detailed information concerning the quality of a visual field but is the most tedious and time-consuming testing strategy (Figs. 109-4 and 109-5). For example, a normal full-threshold test of the central 30° requires approximately 11 to 13 minutes; a significantly abnormal test may take 50% longer to complete, because thresholding an abnormal point requires more stimulus presentations. This testing modality involves performing the bracketing (“staircase,” “up-and-down”) process at every point tested. A stimulus brighter than the patient’s expected threshold is presented at a point. If the stimulus is seen, stimuli of successively reduced intensity are presented until the stimulus is not seen. Then stimuli of increasingly higher intensity are presented until one is seen. Most instruments use 4-dB increments until threshold is crossed for the first time. Subsequent changes in intensity are usually of 2-dB steps. A point somewhere between suprathreshold and infrathreshold is determined to be threshold for that point. Most perimeters bracket until threshold is crossed twice, from the suprathreshold and infrathreshold directions.
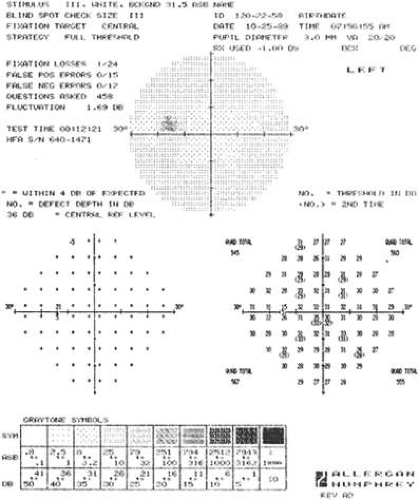 Figure 109.4. Full threshold examination. Program 30-2 of the Humphrey Field Analyzer fully thresholds each of 76 points within the central 30°, spaced 6° apart. Standard data, including program used, testing parameters, patient identification, acuity, pupil diameter, age, and refraction, are given. Reliability parameters and testing time are also recorded. A display of the actual threshold sensitivity values determined for each point tested is given (lower right). Note the quadrant (Quad) totals. In addition, a display of the depth of defect is provided (lower left). In the gray-scale printout (upper), a different symbol is delegated to a series of sensitivity ranges (see key). A symbol is assigned to each of the points tested and a printout is generated. In the numeric printout, note the 12 loci at which a threshold sensitivity value has been determined twice. The differences between the first and second determinations are used to determine the degree of short-term fluctuation. |
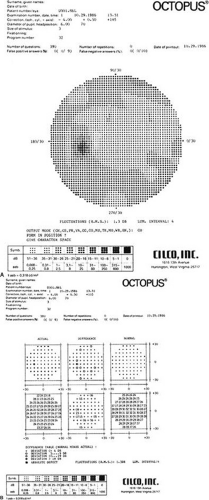 Figure 109.5. A. A cursory review of the gray-scale printout of this Octopus Perimeter 30° full-threshold examination of the central field demonstrates no gross abnormalities in this 34-year-old ocular hypertensive. B. Inspection of the numeric printout of the differences (center, bottom) between actually determined threshold sensitivities (left, bottom) and those expected (right, bottom) reveals several points of minimally reduced sensitivities in the inferior Bjerrum area. These findings are suggestive of the development of early visual field defects and warrant close scrutiny on future testing. Note the use of symbols in the difference display (top, center) using the difference table as a key (bottom). |
Several points in the field are in the process of being thresholded at the same time. Completely thresholding only one point at a time would encourage anticipation and possible loss of fixation by the patient as well as altering local retinal adaptation. At each point examined, a value for retinal threshold sensitivity is generated. Certain instruments begin the full threshold program by determining threshold values at several primary points and then use these points to extrapolate probable threshold levels at adjacent points. These estimated threshold levels are the starting point for full thresholding. Others begin thresholding at an age-corrected expected level.
Several perimeters offer rapid thresholding strategies. One such strategy involves not fully thresholding a point if a 4-dB stimulus above expected threshold is seen. An additional testing strategy involves thresholding of each point in the field, beginning at 2 dB greater than those determined during a previous examination. Another alternative is to screen the field for areas of significantly decreased sensitivity from those established during a previous examination, and then threshold only these areas. The latter strategies save time but risk overlooking small, gradual decreases in sensitivities.
FASTPAC
Humphrey Instruments, Inc., developed a rapid thresholding strategy, FASTPAC, which uses a 3-dB step size and estimates the threshold after only one crossing but thresholds the four primary seed points in a similar manner to standard full-threshold testing. Half of the points start at 1 dB brighter and the other half start at 2 dB dimmer than the predicted threshold values. After a single crossing, the threshold is estimated. Thresholds of locations that differ from expected values by 4 dB or more are then re-estimated. Recent studies have indicated that FASTPAC, although considerably faster than conventional standard threshold strategies, underestimated mean deviation, pattern standard deviation, and corrected pattern standard deviation when compared with the standard algorithm.35,36,37
Swedish Interactive Thresholding Algorithm
In an attempt to create shorter threshold tests with preserved accuracy, a family of new threshold strategies, SITA (Swedish Interactive Thresholding Algorithm), was developed. The SITA strategies use continuous estimation of threshold values and measurement errors throughout the test, using advanced visual field models and mathematical analyses performed in real time. Models are initially based on prior visual fields. Staircase procedures are used to alter stimulus intensities at predetermined test point locations, with interruption of staircases when measurement errors have been reduced to a preset level. This is the main factor involved in test time reduction. Test time is further reduced by eliminating catch trials to determine the frequencies of false-positive answers and by using a more effective timing algorithm. Several studies have demonstrated that SITA strategies reduce automated perimetry testing time while achieving the same or better test quality than standard full-threshold and FASTPAC strategies.38,39,40 The SITA Standard and SITA Fast strategies are available as software implemented on the Humphrey Field Analyzer II.
PRINTOUT
One difficulty in adapting to an automated perimeter is in evaluating the data presentation.41 A standard printout usually includes some or all of the following: the pattern and strategy used, patient’s name and date of birth, date of examination, pupil diameter, visual acuity, correction used, size of stimulus used, fixation target (central vs. diamond pattern), testing time, fixation losses, false-positive and false-negative responses, degree of response fluctuations, and central reference level (Fig. 109-4).
Screening Strategies
Screening programs display, in a framework of symbols corresponding to the pattern used, whether a stimulus was seen or not seen at each point tested (Figs. 109-2 and 109-3). Some perimeters automatically determine whether additional points around detected abnormal points were seen. A multizone strategy delineates, usually by symbols, whether a maximally bright stimulus was seen or not seen, indicating an absolute versus relative scotoma. Actual retinal sensitivities at the abnormal points may be determined and displayed in numeric form (dB) with certain strategies. (See Testing Strategies, Screening.)
Threshold Strategies
Threshold strategies report actual retinal sensitivities at each point tested in numeric form (dB). As in the screening strategies, the sensitivities are displayed in a pattern corresponding to that used in the test. Quadrant totals can also be reported, which is helpful in comparing quadrants within the same examination, those of fellow eyes, or subsequent fields of the same eye (Fig. 109-4). Along with actual values, a display of differences from expected values or depth of defect may be provided. Expected threshold values may be those determined by thresholding several points and extrapolating the remainder of the tested loci or those of age-matched controls collected by the manufacturer. If the actual values are within 4 to 5 dB of expected values, they are considered within the limits of normal variability and may be recorded as “normal,” without a value for difference from expected (Figs. 109-4 and 109-5). This type of display may be reported in numeric decibel values or in symbols, where a specific symbol corresponds to a range of reduction in decibel level. This table is valuable because it is a way to determine abnormal points rapidly. Its drawback is that localized areas that are defective with respect to a patient’s actual field may not be recognized as abnormal if they are within the normal limits of the thresholds expected by the perimeter. (See Testing Strategies, Threshold Determinations.)
A gray-scale printout is generated by delegating different symbols to actual decibel values of threshold sensitivities, with a specific symbol representing a particular range of stimulus intensities. Symbols usually increase in density (darker) as the required threshold intensity increases. Therefore, darker areas indicate a lower differential light sensitivity and lighter areas indicate zones of higher sensitivity. The resultant printout appears to assign a retinal sensitivity to every area of the field tested, but in reality only a limited number of points were actually thresholded. To allow for continuity, values of presumed retinal sensitivity are interposed to unassessed areas of the field. Its appearance therefore resembles a picture simulating isopters. One should use this type of information display with its limitations in mind, because it gives only a gross assessment of the field. Although the clinician accustomed to manual kinetic perimetry results may find it more comfortable to rely on this type of graphic representation, important information may be missed when actual numeric values are not also considered (Fig. 109-5). Static profile printouts of interposed values along specified meridians may also be derived from the data (Fig. 109-6).
Stay updated, free articles. Join our Telegram channel

Full access? Get Clinical Tree


