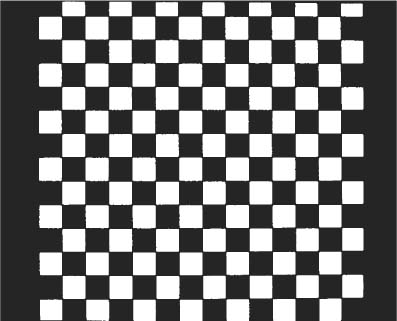
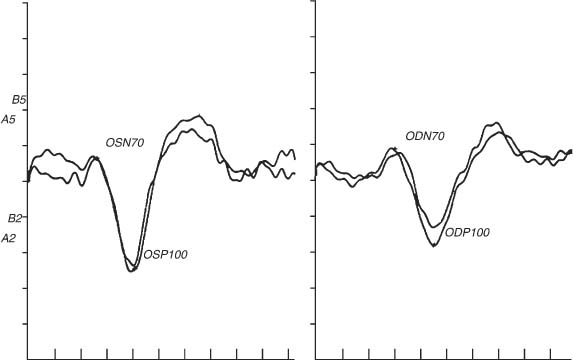
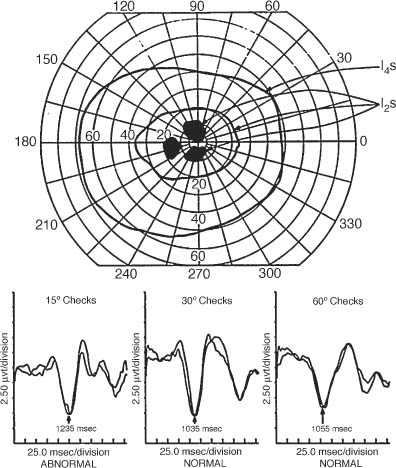
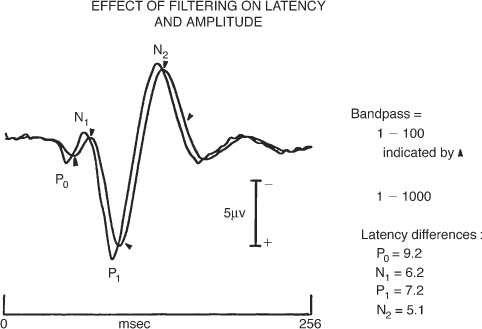
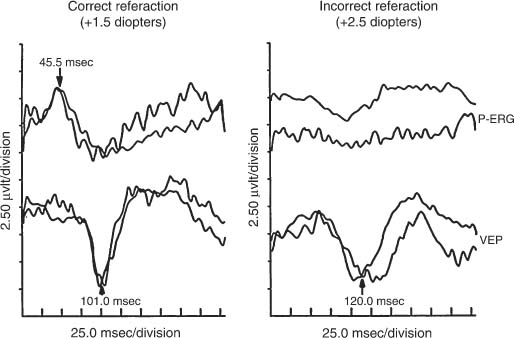
Chapter 46 Visual electrophysiology can be valuable when used as an extension of the clinical examination, but can lead to misdiagnosis when used in isolation of clinical data. The ordering clinician, therefore, should communicate the significant clinical findings to the laboratory. This will prevent mistakes such as performing the wrong test or coming to the wrong conclusion regarding results. For example, not reporting a significant retinal lesion may mislead the laboratory into thinking an abnormal visual evoked potential (VEP) is due to an optic neuropathy. This chapter presents a simplified guide to basic visual electrophysiology testing. It is designed to assist the clinician in interacting with the electrophysiology laboratory. It is divided into three sections. The first explains how these tests are typically done, the second describes specific clinical situations, and the third discusses how to determine if a laboratory is reliable. VEP has been clinically available for three decades. It averages occipital lobe electrical activity evoked from contrast stimulation of the visual system. Despite advances in imaging such as magnetic resonance imaging (MRI), VEP remains a valuable tool to document occult lesions of the central visual channels, typically within the optic nerve. This is particularly true in demyelinating optic neuropathy, which can be missed even with contrast-enhanced or fluid attenuation inversion recovery (FLAIR) MRI scanning. For this test, the patient sits in a comfortable chair and looks monocularly at a TV monitor onto which a slowly reversing checkerboard pattern is projected (Fig. 46–1). Checkerboard stimulation keeps luminance (flashing light) contamination at a minimum, greatly increasing the sensitivity of the test (see later in this chapter). Signal is acquired from the scalp over-lying the occipital area using electroencephalography (EEG) electrodes. Patients typically have three to five electrodes on their scalp for the recording. The actual EEG signal created by contrast stimulation of the visual system is quite small and is usually obscured by background occipital lobe brain activity. Modern VEP technique uses a computer to average this background brain activity. Typically, a hundred stimulations are stored and then averaged. Averaging works by summing the randomly occurring EEG noise and leaving the evoked (and therefore uniform) signal to emerge out of the background brain activity. Once background noise is averaged out, to near zero amplitude, a robust (3 to 10 μV) complex signal with positive and negative peaks emerges. This is the actual VEP signal (Fig. 46–2). This all usually only takes just a few minutes per eye with modern instruments. One eye at a time is tested. Two different check sizes (typically visual angles of 30 and 60 minutes) are used starting with the larger checks. After 100 trials are averaged, the test is repeated in the same eye and compared with the first recording, to ensure waveform reproducibility. This is vital for determining the reliability of the test results. The second eye is tested the same way. Typically another stimulus paradigm is then performed monocularly, using smaller checks in each eye. Different check sizes can be vulnerable to different artifacts. If the visual angle is too small, simple refraction errors or minor retinal lesions can cause VEP abnormality (Figs. 46–3 and 46–4). If the visual angle is too large, there will be more luminance than contrast stimulation of the visual system. In this situation the VEP will be too insensitive to detect smaller lesions of the optic nerve. FIGURE 46–1 Typical checkerboard stimulation used for contrast visual evoked potentials (VEPs). The smaller the checks, the more sensitive the VEP for detecting optic nerve lesions, but the more vulnerable to false negatives such as incorrect refraction (see Fig. 46–3). The pattern-shift VEP has two major wave peaks. The first is a negative wave that usually occurs at around 70 msec and is called the N70. A second peak that is positive usually occurs around 100 msec and is called the P100. The P100 typically is the one measured for abnormality. In normal younger adult males, the P100 typically has a range of normal around 110 msec (accounting for 2.5 standard deviations from the mean in a large population of normals). Variations for age and gender must always be accounted for by studying large normal populations before interpreting these tests. An abnormal VEP in an eye without ocular pathology is pathognomonic for an optic neuropathy (Fig. 46–6). An abnormal VEP in both eyes where there is no ocular disease is consistent with a bilateral optic neuropathy or retrochiasmal disease. Inter-eye difference should also be analyzed. At times the absolute latency of a test is normal but the inter-eye difference can be prolonged and be the only indicator of abnormality. An inter-eye latency difference more than 11 msec for younger adult males is abnormal in many laboratories. Usually, normal amplitudes are around 6±4 μV. Inter-eye amplitude differences are rarely significant because of the large variability, even in normals. Unless the P100 amplitude in one eye is three times smaller than the other, the ratio difference is rarely sufficient to diagnose an optic neuropathy. FIGURE 46–2 Normal visual evoked potential (VEP) performed monocularly in a 30-year-old volunteer. Notice the N70 and P100 VEP waveforms occur at ~70 and 100 msec, respectively, in each eye. Proper electrophysiology technique also dictates that the stimulation be completely reproducible with creation of a second waveform (using the exact same stimulation technique) as demonstrated here. This allows the examiner to be certain that abnormal waveforms are not due to technical error. (See examples of VEP recorded in an optic neuropathy in Figs. 46–6 and 46–17.) FIGURE 46–3 VEP and pattern electroretinogram (PERG) of a 27-year-old volunteer. The panel on the left shows normal waveforms when the subject wears the correct reraction. The panel on the right shows abnormal waveforms to small checks (15 minutes of arc) when the subject uses a refraction slightly above normal. This points out the importance of determining that the subject has the correct refraction before VEP, and demonstrates how (overly) sensitive small checks are to incorrect refraction. There is rarely value to a flash VEP except in extraordinary situations such as in infants or patients completely unable to cooperate. Flash VEP is insensitive to even significant optic nerve abnormalities. Only a small percentage of functional optic nerve axons can produce a normal waveform in flash VEP. Checkerboard stimulation provides the needed sensitivity to detect a subtle optic neuropathy. VEP is usually not necessary to document a typical optic neuropathy. However, a VEP can be of value to document an occult abnormality, suspected but not confirmed on clinical exam. It can also help in explaining unusual clinical situations. For example, in a patient with an apparent optic neuropathy in one eye but no robust afferent pupillary defect, a VEP abnormality in the fellow eye (indicating a bilateral optic neuropathy) explains this unexpected clinical finding. VEP can remain abnormal in a fully recovered optic neuritis, even when virtually every other test converts to normal. Documenting an occult optic neuropathy, even years after the occurrence of a vague visual complaint, can help establish the diagnosis of multiple sclerosis in some cases. VEP is not only a test of optic nerve function but also a very sensitive, although nonspecific, measure of central visual pathways. These pathways originate mostly from ganglion cells that populate the macular area of the retina, then proceed through the optic nerve, cross (in part) at the chiasm, synapse at the lateral geniculate nucleus, and project to the posterior occipital lobes. Any decreased stimulation of these central visual pathways, for example, due to a large maculopathy, vitreous hemorrhage, dense cataract, significant corneal lesions, or inappropriate refraction, can cause an abnormal VEP. In fact, noncompliance (through defocusing, wearing the wrong glasses, or squinting) can also cause volitional abnormality of the VEP (Fig. 46–3). For all these reasons, the electrophysiologist must be certain that no ocular abnormality or noncompliance is present before concluding that a unilateral abnormality of the VEP is due to an optic neuropathy. Conversely, a bilateral VEP abnormality can be due to bilateral ocular, chiasmal, and retrochiasmal lesions. ERG techniques stimulate retina cells, which in turn create a mass response recorded by a corneal electrode. There are many different types including flash (or full-field) ERG (FERG), multifocal ERG (MERG), focal ERG, and pattern ERG (PERG). All except PERG are performed using flashes of luminance (bright light) stimulation. Animal studies conducted in the early 1980s suggest that the FERG a wave arises from photoreceptors and the b wave from Müller cells, whereas the PERG arises from ganglion cells in part. MERG waveforms apparently arise mainly from the bipolar cell layer, and a smaller portion from the photoreceptor. Focal ERG has similar cells of origin. FIGURE 46–4 A 31-year-old man with complaints of visual disturbance in the left eye. Acuity was 20/20 OU, although the chart was read slower with the left eye. Color vision was normal but there was an equivocal afferent pupillary defect in the left eye. Amsler grid revealed a metamorphopsia, and visual fields showed paracentral scotomata. The optic nerve head was normal. There was a vague change in the macular area. VEP testing was done. VEP to small check sizes (15 minutes of arc) was abnormal, whereas those to medium-size (30 minutes of arc) and larger checks (60 minutes of arc) were normal. The patient was orginally labeled as having an optic neuropathy OS, possibly due to multiple sclerosis. Eventually a fluorescein angiogram revealed a cystic macular edema. This case demonstrates three points. First, VEP using smaller checks (15 minutes of arc) may be too sensitive for proper evaluations of optic nerve function. Second, macular lesions can cause abnormal VEP, especially to smaller check sizes. Third, proper clinical information is essential to prevent the electrophysiology laboratory from drawing inappropriate conclusions. FERG has been available for clinical use for more than four decades and is commonly used to document widespread retinal disease, such as retinitis pigmentosa (Figs. 46–8 to 46–13). Although family history and retina appearance alone can diagnose such cases, FERG can confirm the diagnosis. It can also be used to diagnose early cases before there is significant clinical evidence or differentiate this disease from others, such as stationary night blindness. In cases of constricted visual fields without significant retinal findings, an abnormal FERG can detect abnormality caused by cancer-associated retinopathy. FERG recordings do not require averaging because of the large waveforms. (Other types of ERG that are reviewed later are of lower amplitude and do require averaging to eliminate background noise.) To record a FERG, the pupils are maximally dilated and the patient is dark adapted for a minimum of 45 minutes. This allows maximum rod (scotopic) stimulation. A contact lens is then placed on the cornea, or a special electrode is placed on the sclera. A single, high-intensity, luminance stimulation using a red, blue, or white flash is performed using a Ganzfeld stimulator. A Ganzfeld is a bowl-like device in which the patient places his or her face to provide uniform flash stimulation of the retina. Waveforms are normally robust. For a normal rod-dominated FERG, the amplitude can be as high as 250 to 400 μV. Cone (photopic) stimulation is usually above 50 μV for all age groups and can be up to 150 μV in young healthy subjects. Once a waveform is acquired, like all other electrophysiology testing, the procedure is repeated to ensure reproducibility of the waveform. Waveform analysis for FERG includes a wave and b wave amplitude and latency. Unlike the VEP, the FERG usually uses changes in amplitude as a sign of abnormality. After the patient is no longer dark-adapted, cone (photopic) testing conditions can be performed using a white light background with either a single bright flash or flicker flash technique. MERG testing requires the patient, while wearing a contact lens, to view a computer monitor with a pattern of black and white lights going off in a hexagonal pattern. Typically there is no dark adaptation (unlike with FERG) and therefore it is a cone-dominated luminance response. Each hexagon goes through a defined sequence of being turned on and off, although the stimulator appears only be to flickering. The central area is stimulated by the smallest hexagons. The waveform amplitude for ~103 locations is then plotted as a three-dimensional surface plot. This shows the electrical response density as a function of visual field location. In short, it is an easily interpreted visual field like examination of electrical activity generated by the retina. FIGURE 46–5 Notice the effect of a simple change of filters on the VEP. The act of using a band pass filter of 1 to 100 rather than 1 to 1000 prolongs the VEP waveform by as much as 6 to 9 msec (~8%). This is why a well-run laboratory must maintain the same test parameters for both normal controls and every patient tested.
ANCILLARY ELECTROPHYSIOLOGIC TESTING
CHARACTERISTICS OF COMMONLY AVAILABLE ELECTROPHYSIOLOGIC TESTS
VISUAL EVOKED POTENTIAL (VEP)
PATTERN-SHIFT VEP
INTERPRETING THE PATTERN-SHIFT VEP
FLASH VEP
SIGNIFICANCE OF AN ABNORMAL VEP
ELECTRORETINOGRAM (ERG)
FLASH ELECTRORETINOGRAM
MULTIFOCAL ELECTRORETINOGRAM
Stay updated, free articles. Join our Telegram channel

Full access? Get Clinical Tree


