5
Ancillary Diagnostic Testing in
Ocular Inflammatory Diseases
John J. Huang and Joseph L. Lin
This chapter is a guide to the use of ancillary diagnostic imaging and pathologic studies used in evaluating and managing ocular inflammatory diseases. Ancillary imaging is a widely used and very valuable tool for the uveitis practitioner, enabling one to define the extent of ocular inflammation, ascertain any likely mechanisms of visual loss in patients who have suffered this, and in some cases narrow the differential diagnosis of the disease. Pathologic evaluation of ocular fluids or tissues is less common but helpful in the setting of suspected infection or malignancy.
FLUORESCEIN ANGIOGRAM
Fluorescein angiogram (FA) makes use of the fact that the chemical sodium fluorescein absorbs light at one wavelength and emits it at another, such that projected and emitted light can be viewed separately using a filter. This is the most common dye used for the study of retinal vascular diseases and posterior uveitic disorders. The dye is a small molecule with a molecular weight of 376.7 Da. The absorption spectrum of the fluorescein molecule is 465 to 490 nm wavelength (blue) with emission at 520 to 530 nm (yellow-green wavelength). Roughly 70% to 80% of sodium fluorescein is protein bound, particularly to albumin, with 20% to 30% free in the serum. A few minutes after injection, evidence of the yellow dye is visible in the skin and mucosa and can persist for 6 hours. Fluorescein molecules are eliminated by the kidneys in approximately 36 hours.
Phases of FA
- Angiography starts with a peripheral intravenous bolus injection of 5 mL, 10% sodium fluorescein. In patients with renal insufficiency, a reduced dose of 2.5 mL is recommended (Fig. 5.1).
- Fluorescein dye is visible in the choroidal vasculature in 10 to 15 seconds. This is immediately followed in 1 to 3 seconds with filling of the retinal vascular. As the dye rapidly circulates through the capillaries to the venous system, the arteriovenous phase of the angiogram follows. At the 25- to 35-second mark, maximum fluorescence is reached (Fig. 5.2).
- This initial arteriovenous phase is followed by recirculation phases during which there is intermittent mild fluorescence. Additional imaging of the posterior fundus and peripheral retina is performed at 5, 10, and 15 minutes.
- Interpretation of fluorescein angiography is subjective and based on a time-elapsed progression of the clinical lesions.
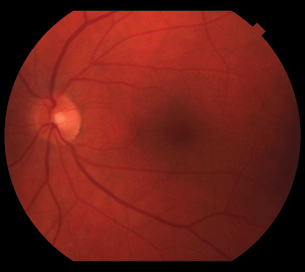
Figure 5.1 Fundus photo of a healthy retina with a retinal artery to retinal vein ratio of 2:3 and a pink optic nerve.
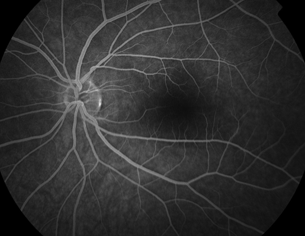
Figure 5.2 Transit phase of the FA with good perfusion of the retina. There is a diffuse background hyperfluorescent choroidal flush. The fovea is hypofluorescent due to the foveal avascular zone and the increase in the xanthophylls and other pigment within the fovea region.
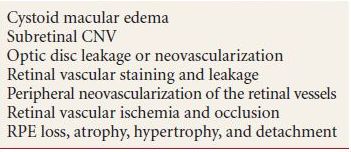
FA Findings (Table 5.1)
Table 5.1 Common fluorescein angiographic findings in uveitis patients
Hyperfluorescence
- Window defect—increased visibility of normal choroidal vasculature due to a defect (window) in the retinal pigment epithelium (RPE). The size and shape of the hyperfluorescent patch remain stable and do not blur throughout the angiogram, while the fluorescence intensity decreases gradually along with the overall choroidal fluorescence.
- Leakage—recognizable as a patch of hyperfluorescence that expands in size and intensity with increasingly fuzzy edges throughout the study. Leakage occurs most commonly in the setting of neovascularization (new choroidal or retinal blood vessels are highly permeable to fluorescein molecules), vascular inflammation (when the vessel walls become abnormally permeable), and in microvasculature involved in ischemic processes (e.g., diabetes).
- Staining—an area of hyperfluorescence that increases in intensity throughout the study without changing shape. Drusen, bare sclera, and atrophic chorioretinal patches (such as peripapillary atrophy) all show staining.
- Pooling—occurring when fluorescein fills a defined subretinal space, recognizable as fluorescence that gradually expands in size to fill a well-demarcated area and then increasing only in intensity. In some cases, there will be an obvious source of leakage supplying the pooling fluorescein, although most commonly pooling is subtle and gradual, and the extent of the involved area is optimally seen in very late frames (Fig. 5.3).
- Leakage—recognizable as a patch of hyperfluorescence that expands in size and intensity with increasingly fuzzy edges throughout the study. Leakage occurs most commonly in the setting of neovascularization (new choroidal or retinal blood vessels are highly permeable to fluorescein molecules), vascular inflammation (when the vessel walls become abnormally permeable), and in microvasculature involved in ischemic processes (e.g., diabetes).
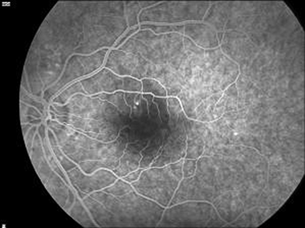
Figure 5.3 FA of a patient with central serous chorioretinopathy demonstrating a single pinpoint area of leakage and pooling of the dye.
Autofluorescence
- Recognizable as fluorescence that is visible before the dye is injected into the patient’s arm. This requires a photograph using the fluorescein filter. Optic nerve head drusen are commonly autofluorescent.
Hypofluorescence
- Blockage—recognizable as a patch of absent or decreased fluorescence overlying the retinal and choroidal flush. Blood and pigment will show total blockage, while that attributable to subretinal fluid or retinal or choroidal masses will show decreased fluorescence to varying degrees.
- Ischemia—recognizable as a patch of decreased fluorescence, missing either the retinal blood flow (the underlying choroid remains visible, often delineating the empty retinal blood vessels) or the choroidal blood flow (the choroidal blush is absent, resulting in a “dark choroid”).
Significance of FA Findings
FA is useful in patients with uveitis to demonstrate the presence of leakage from the retinal vessels of all sizes, including perifoveal capillaries (where leakage causes cystoid macular edema) and from the optic nerve. FA also allows for recognition of subtle clinical changes of retinal vasculitis, including vascular occlusion and choroidal neovascular membranes (CNVs).
Adverse Effects of FA
- Most common side effect is nausea 30 seconds after the intravenous injection. This is usually self-limited.
- Skin rash.
- Anaphylaxis is a rare but dangerous complication; fatalities are extremely rare (estimated at 1 in 220,000).
INDOCYANINE GREEN ANGIOGRAM
Like fluorescein, indocyanine green angiogram (ICG-A) absorbs light at one wavelength (in this case 780 nm) and emits it at another (820 nm, in the infrared spectrum), enabling the projected and emitted light to be viewed separately using a filter. It differs from fluorescein in being much more plasma protein bound (98%), thus less prone to leakage through the highly fenestrated choroidal vasculature. It is thus ideal for viewing choroidal vasculature, and digital ICG imaging was developed as a diagnostic tool to complement FA for this purpose. The fact that it emits light in the infrared spectrum enables it to be visible through hemorrhagic and exudative lesions, where fluorescein imaging is not useful, and its initial clinical use was for the evaluation of occult or poorly defined choroidal neovascularization in age-related macular degeneration (AMD). ICG is also more easily visible through RPE and is thus useful for determining choroidal involvement in posterior uveitis; it is the standard means of determining whether or not a posterior inflammatory process involves the choroid, in which case the inflammatory lesions appear hypofluorescent. In general, ICG dye is better tolerated than fluorescein with fewer incidences of nausea and vomiting. Contraindications to ICG include iodine allergies, liver disease, and pregnancy.
Phases of ICG Angiography
- Early phase—filling of the choroidal arteries, choriocapillaris, and veins of the choroidal circulation.
- Middle phase—slow decrease in contrast between choroidal vessels and background with isofluoresce at the end. Duration of 10 to 20 minutes.
- Late phase—visible dark choroidal vessels appear against the homogenous background. Duration of 15 to 30 minutes.
Significance and Interpretation of ICG-A
Like fluorescein, ICG-A is a dynamic study, such that all phases are used for diagnosis. Interpretation of ICG angiography is similar to FA with few important differences:
- Hyperfluorescence due to leakage is better localized than with FA, due to the larger molecules and higher levels of protein binding, such that the dye remains intravascular for longer duration.
- The intact choriocapillaris will appear diffusely hyperfluorescent on the ICG study, while loss of RPE and choriocapillaris will appear dark (hypofluorescent).
ICG Angiographic Findings
Hyperfluorescence
Leakage from choroidal neovascularization or hyperpermeability such as central serous chorioretinopathy (Fig. 5.4).
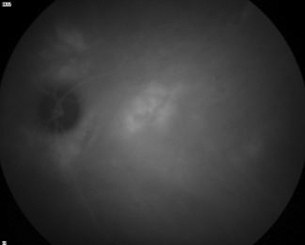
Figure 5.4 ICG-A of the same patient with central serous chorioretinopathy demonstrates multiple areas of late hyperfluorescence consistent with a more wide spread disease of the choroidal vasculature.
Stay updated, free articles. Join our Telegram channel

Full access? Get Clinical Tree


