Diagnostic Imaging Techniques
Diagnostic imaging is an essential component of the evaluation of many otolaryngologic problems. Computed tomography (CT) and magnetic resonance imaging (MRI) are the most commonly used imaging modalities, with positron emission tomography (PET) playing an ever-increasing role.
CT scanning uses ionizing radiation to generate cross-sectional images based on differences in the X-ray attenuation of various tissues. Modern scanners are typically helical, meaning that X-ray source rotation and patient translation occur simultaneously; this results in the acquisition of a “volume” of data that is then partitioned and reconstructed into individual slices. Helical scanning is significantly faster than traditional slice-by-slice acquisition, thereby diminishing artifacts related to motion (eg, breathing, swallowing, and gross patient motion). The rapid data acquisition also allows a larger number of thinner slices to be obtained, which facilitates diagnosis by decreasing partial-volume averaging effects and allows for improved quality of multiplanar reconstructions. The most recent advance in CT imaging has been the introduction of “multislice” scanners. Multislice scanners have a variable number (typically 8–64, though scanners with 320 are now available) of parallel arcs of detectors that are capable of simultaneously acquiring volumes of data. The increased speed that results from multislice sampling can be traded for improved longitudinal resolution, an increased volume of coverage, or an improved signal-to-noise ratio.
CT scanning of the head and neck is ideally performed with thin sections, usually ≤3 mm, in the axial plane; with multislice scanners, 0.625- or 1.25-mm slices are typically acquired and then combined for ease of viewing into slightly thicker 2.5- to 3-mm slices. Direct coronal imaging or coronal reformations are useful in many situations, notably in imaging of the paranasal sinuses and the skull base, and sagittal reformations can also be useful. Because of growing concerns over medical radiation, coronal reformations are generally preferred to a second acquisition if axial images are also acquired. CT scanning of the neck is generally performed following injection of iodinated contrast material because opacification of vessels helps to separate them from other structures such as lymph nodes and also helps to delineate and characterize pathology. If bony anatomy is the focus of the imaging study, as in imaging of the paranasal sinuses or temporal bones, then intravenous contrast material is not required. If a patient has a contrast allergy or renal insufficiency, then contrast administration should be avoided; premedication with steroids and antihistamines can be useful if a patient has a history of a contrast reaction, but contrast administration is necessary.
MRI exploits differences in relaxation characteristics and spin density of protons in different tissue environments to produce an image that is exquisitely sensitive to soft tissue contrast. Depending on the parameters that are selected, variable tissue characteristics and contrast are produced. At least two different types of sequences in two planes are generally necessary to characterize lesions of the head and neck. The slice thickness should be no more than 5 mm. A gadolinium-based contrast agent is generally used to enhance the detection of pathology and improve tissue characterization, and also to aid in the generation of a differential diagnosis. In some circumstances, thinner sections covering a smaller anatomic area may be necessary for more precise diagnosis.
In the head and neck, the following imaging sequences are typically obtained: (1) sagittal, axial, and coronal T1-weighted images; (2) axial fast spin-echo T2-weighted images with fat saturation; and (3) axial and coronal postgadolinium T1-weighted images with fat saturation.
Additional planes may be useful in some circumstances, such as coronal fast spin-echo T2-weighted images with fat saturation for the assessment of paranasal sinus and anterior skull base pathology. Additional sequences such as magnetic resonance angiography (MRA) may be useful in certain circumstances (eg, paragangliomas and dural fistulas), but are not necessary for evaluating most processes of the head and neck. MR venography may be useful in the assessment of patients with pulsatile tinnitus and in the assessment of the patency of the sigmoid sinus in patients with adjacent neoplastic or inflammatory disorders. Sequences such as FIESTA (fast imaging employing steady-state acquisition) or CISS (constructive interference in the steady state) allow heavily T2-weighted, thin-section imaging that is particularly useful in assessing the basal cisterns and fluid-filled inner ear structures and will generally be included in temporal bone-imaging protocols. Advanced modalities in widespread use in the brain (eg, MR spectroscopy, diffusion-weighted imaging, functional MRI) have for the most part not found a place in routine head and neck imaging, with the exception of diffusion-weighted imaging, which is particularly useful in the evaluation of the skull base and temporal bone for epidermoid cysts and cholesteatomas.
On a T1-weighted image, fat is bright and fluid (eg, cerebrospinal fluid [CSF]) is relatively dark. Muscle and most pathologies are of intermediate signal intensity. The large amount of fat in the head and neck provides intrinsic tissue contrast, which makes the T1-weighted image very sensitive to infiltrative processes that obliterate tissue planes or that replace marrow fat (Figure 3–1). Some hemorrhagic or proteinaceous lesions cause shortening of T1 relaxation time and appear bright on a T1-weighted image. On a T2-weighted image, fluid is very bright and most pathologies are relatively bright, whereas normal muscle is quite dark. The fast spin-echo technique is very useful in limiting artifacts related to motion and magnetic susceptibility compared with conventional spin-echo T2-weighted imaging. Because fat remains bright on a fast spin-echo image, however, fat saturation should ideally be applied when imaging the head and neck or skull base. In the nasal cavity and paranasal sinuses, T2-weighted images are particularly useful in distinguishing neoplastic masses from polyps, thickened mucosa, and retained secretions (Figure 3–2). Gadolinium is very useful for demonstrating pathology and tailoring a differential diagnosis based on the enhancement characteristics of a lesion. In a patient with head and neck cancer, postgadolinium imaging is also very useful in assessing cavernous sinus invasion, meningeal infiltration, and perineural spread of tumor (Figure 3–3). Fat saturation should ideally be applied on a postgadolinium T1-weighted image; otherwise, the contrast between an enhancing lesion and the high signal intensity of surrounding fat may actually be reduced compared with the pregadolinium image. Because low-field scanners often do not have fat saturation capability, high-field imaging (1.5 T or higher) is generally preferred for assessing the head and neck and skull base. If a patient is severely claustrophobic, then sedation may be necessary to accomplish the scan on a high-field system.
Figure 3–1.
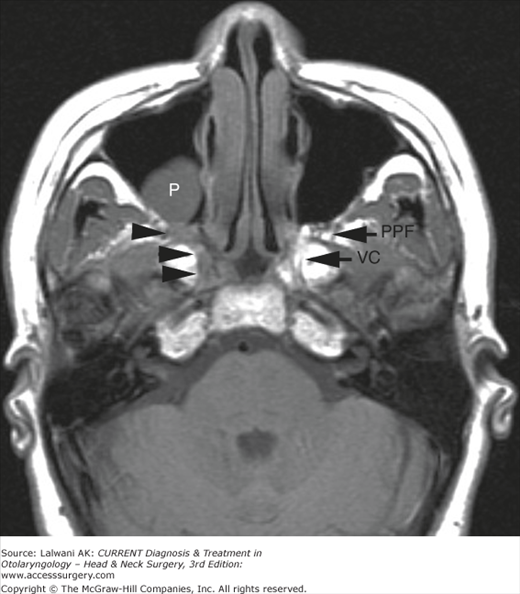
Axial T1-weighted image. Note the high signal intensity of subcutaneous fat and the marrow of the central skull base. Infiltrative neoplasm replaces normal fat in the right pterygopalatine fossa, the vidian canal, and portions of the sphenoid body (black arrowheads). The normal left pterygopalatine fossa (PPF) and vidian canal (VC) are indicated. A maxillary sinus polyp (P) is incidentally noted.
Figure 3–2.
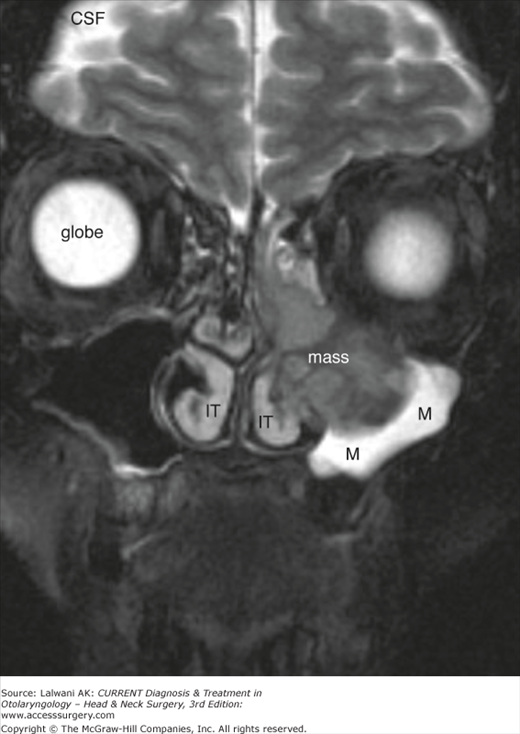
Coronal fast spin-echo T2-weighted image with fat saturation (FS). Note the high signal intensity of the vitreous humor of the ocular globe, the high signal intensity of the CSF, and the lack of signal from subcutaneous fat. In this patient with squamous cell carcinoma, the intermediate signal intensity tumor (mass) stands in contrast to the very high signal intensity of edematous mucosa and retained secretions (M) in the left maxillary sinus and the mildly high signal intensity of the inferior turbinates (IT).
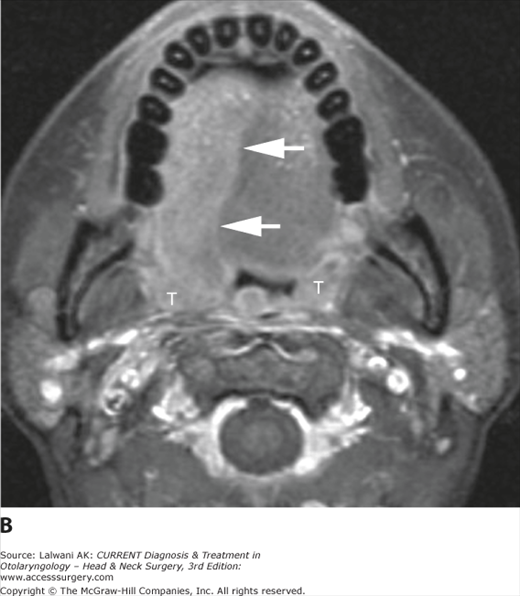
Figure 3–3.
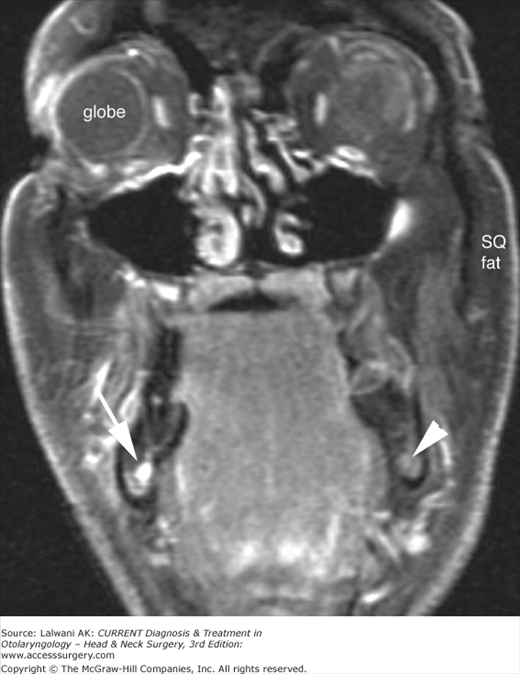
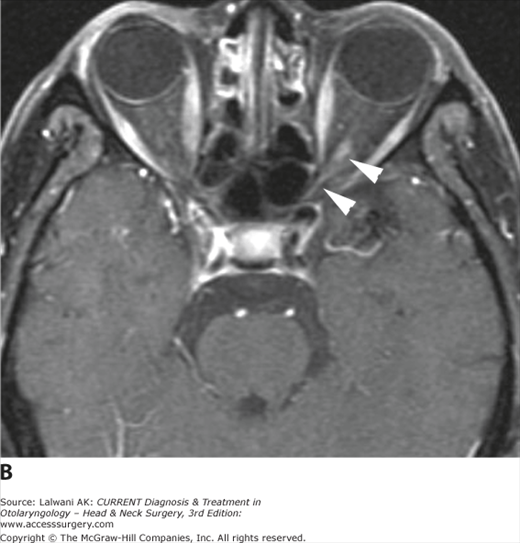
Coronal T1-weighted image, postgadolinium, with fat saturation. Note the vitreous humor is dark as in a T1-weighted image, but subcutaneous and orbital fat are also dark due to fat suppression. The high signal intensity of the nasal mucosa, as well as the enhancement of vessels and extraocular muscles, indicates that gadolinium has been given. In this patient with a history of squamous cell carcinoma of the gingivobuccal sulcus and new chin numbness, the abnormal enlargement and enhancement of V3 in the inferior alveolar canal is seen (white arrow), consistent with perineural spread of tumor. The contralateral normal canal is also indicated (white arrowhead).
It should be kept in mind that MRI requires more time and more patient cooperation than does CT, and therefore, it is not necessarily suitable for acutely ill or uncooperative patients. In addition, there are certain absolute contraindications to MRI, including ferromagnetic intracranial aneurysm clips, cardiac pacemakers, and many cochlear implants. Therefore, patients must be carefully screened for these and other contraindications before undergoing MRI. Also note that gadolinium administration should be avoided whenever possible in patients with renal insufficiency due to concerns regarding nephrogenic systemic fibrosis (NSF), a progressive syndrome that involves fibrosis of skin, joints, eyes, and internal organs and that has been associated with exposure to gadolinium in the setting of renal dysfunction.
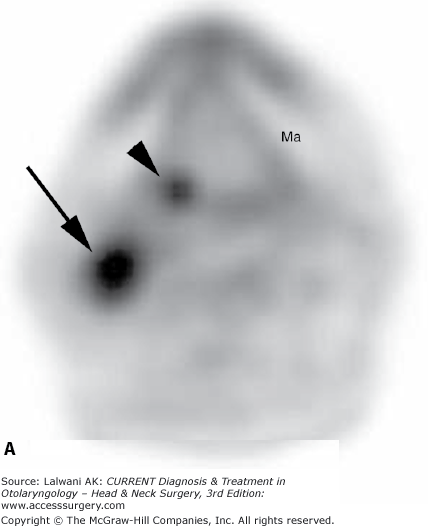
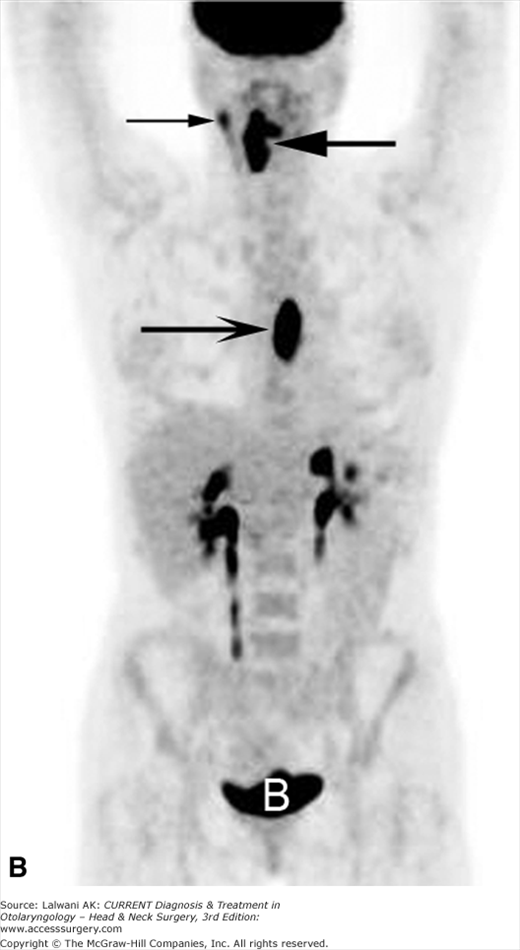
PET provides a functional view of tissues rather than simply depicting anatomy. In the head and neck, it is used primarily for oncologic diagnosis and evaluation and is performed with the radiopharmaceutical 18F-fluorodeoxy-glucose (FDG). FDG is taken up into tissues in proportion to the glycolytic rate, which is generally increased in neoplastic processes. Focal asymmetric uptake is suggestive of a tumor but is nonspecific, since FDG is also concentrated in areas of inflammation. FDG PET scanning is particularly helpful in the following situations: (1) the search for an unknown primary lesion in a patient presenting with metastatic neck disease (Figure 3–4A), (2) the assessment of residual or recurrent disease after primary therapy, and (3) the search for synchronous or metachronous primary lesions or distant metastases. FDG PET scanning can also be useful for staging the neck, but there may be a significant number of false-negative studies in patients with clinically N0 necks because small tumor deposits (<5 mm) are generally not detectable on an FDG PET scan. These small tumor deposits are found if a neck dissection is performed. FDG PET scanning may also be used to assess response to organ-preserving therapy: if a short-interval PET scan demonstrates a marked decrease in metabolic activity, then the patient will continue to be treated with an organ-preserving regimen. If the metabolic activity of the tumor is not decreasing as expected, however, then the patient may be triaged to surgical resection at an earlier point in time. At present, most FDG PET scanning is done on dedicated PET-CT scanners; this allows fusion of the metabolic and anatomical information such that precise anatomic localization of regions of FDG uptake can be achieved (Figure 3–4B and 3–4C). PET-MRI scanners are currently being developed but are not yet available for clinical use outside of a few select research centers.
Figure 3–4.


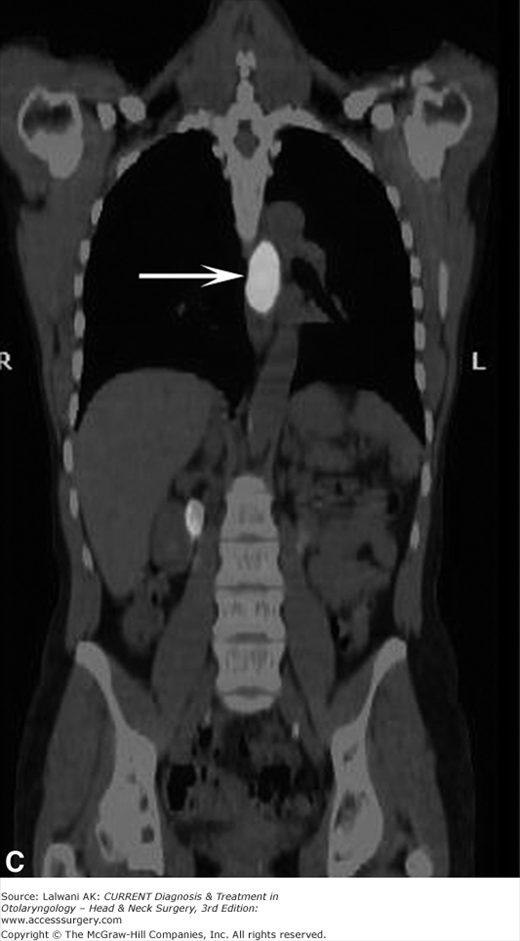
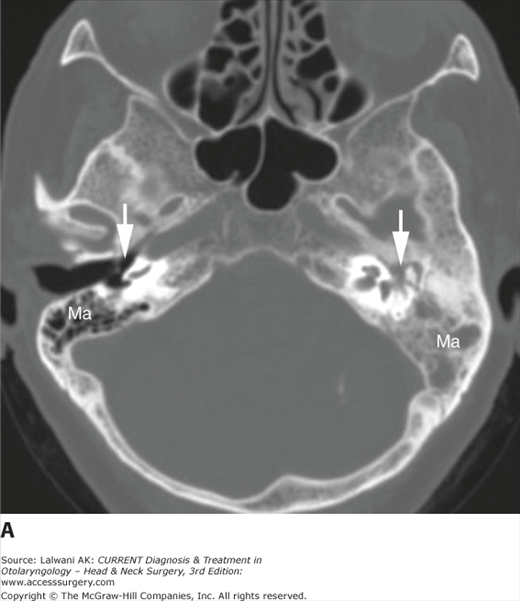
(A) Axial FDG PET image in a patient presenting with metastatic cervical adenopathy and no primary site visible on clinical examination or MRI. A large focus of activity (black arrow) is related to known level II lymphadenopathy, and a smaller focus of activity (black arrowhead) is suspicious for a primary site at the right base of the tongue. This was confirmed by panendoscopy and biopsy. The photopenic mandible (Ma) is indicated for orientation. (B) A whole-body FDG PET image in a different patient who presented for staging of a large right-sided oropharyngeal tumor (large straight black arrow) demonstrates metastatic lymphadenopathy in the right neck (small straight black arrow) as well as an intense focus of activity in the mediastinum (large concave black arrow). Expected activity is seen in the renal collecting systems, ureters, and bladder, B. (C) A coronal FDG PET-CT fusion image in the same patient as in part B localizes the FDG-avid mass (concave white arrow) to the mediastinum, and specifically to the esophagus. At endoscopy, this patient was found to have an asymptomatic second primary tumor involving the mid-thoracic esophagus.

Imaging the Head & Neck
The spaces of the suprahyoid head and neck are defined by the three layers of the deep cervical fascia: the superficial, middle, and deep layers. The spaces so defined include the pharyngeal mucosal space (which includes the nasopharynx, oropharynx, and hypopharynx), the parapharyngeal space, the masticator space, the parotid space, the carotid space, the retropharyngeal space, and the perivertebral space. The infrahyoid neck has traditionally been clinically defined by a series of surgical triangles, but can also be described as a series of fascia-defined spaces, which facilitates the understanding and interpretation of cross-sectional imaging modalities such as CT and MRI.
The spaces of the infrahyoid neck are also defined by the three layers of the deep cervical fascia and include the superficial space (external to the superficial layer of the deep cervical fascia), the visceral space (including the thyroid gland, the larynx, and the esophagus), the carotid space, the retropharyngeal space, and the perivertebral space. The nasal cavity, paranasal sinuses, skull base, and temporal bone are considered unique subregions of the head.
For mucosal disease of the head and neck, of which squamous cell carcinoma (SCC) is by far the dominant lesion, the traditional subdivisions are the nasopharynx, oropharynx, oral cavity, larynx, and hypopharynx. The pharyngeal mucosal space includes the nasopharynx, oropharynx, and hypopharynx.
The nasopharynx is bounded anteriorly by the posterior nasal cavity at the posterior choana; posterosuperiorly by the lower clivus, upper cervical spine, and prevertebral muscles; and inferiorly by a horizontal line drawn along the hard and soft palates (Figure 3–5). The lateral wall of the nasopharynx is composed of the torus tubarius, the eustachian tube orifice, and the lateral pharyngeal recess, also known as the fossa of Rosenmüller (Figure 3–6). In addition to squamous mucosa, the contents of the nasopharynx include lymphoid tissue (adenoids), minor salivary glands, the pharyngobasilar fascia, and the pharyngeal constrictor muscles. The pharyngobasilar fascia represents the aponeurosis of the superior constrictor muscle and attaches it to the skull base. A gap in the upper margin of the pharyngobasilar fascia is known as the sinus of Morgagni. The distal eustachian tube and levator palatini muscle normally pass through this gap, which also serves as a potential route of spread for nasopharyngeal carcinoma to access the skull base.
Figure 3–5.
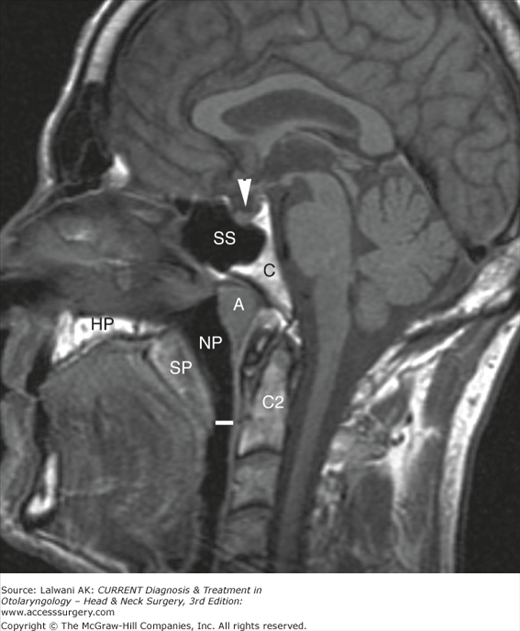
Midline sagittal T1-weighted image indicates the bony and soft tissue anatomy related to the nasopharynx (NP), with the approximate inferior margin of the nasopharynx indicated by the horizontal white line. Indicated are the adenoids (A), clivus (C), C2 vertebral body (C2), sphenoid sinus (SS), soft palate (SP), hard palate (HP), and pituitary gland in the sella turcica (white arrowhead).
Figure 3–6.
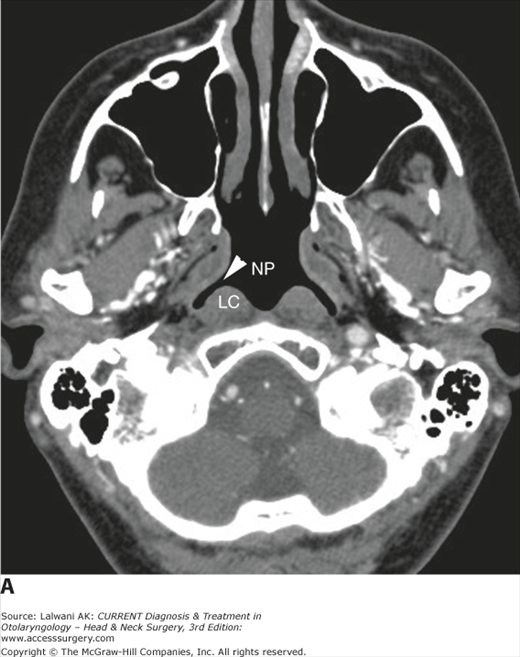
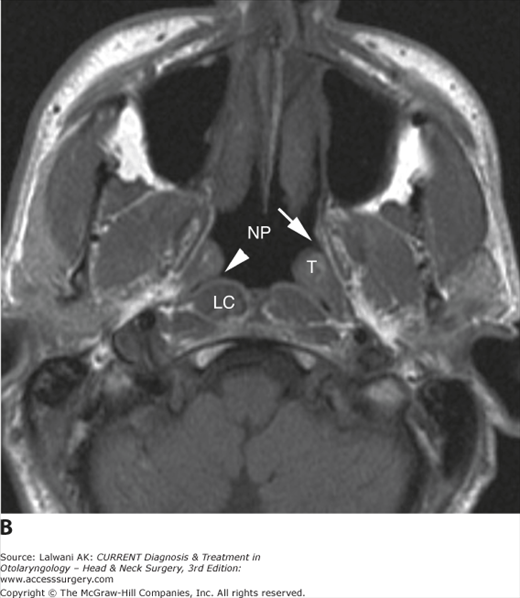
(A) Axial CT image demonstrates the nasopharyngeal airway (NP) and the lateral pharyngeal recess (white arrowhead), as well as the longus colli muscle (LC). (B) Axial T1-weighted image of the nasopharynx (NP) demonstrates the lateral pharyngeal recess (white arrowhead), torus tubarius (T), and eustachian tube opening (white arrow).
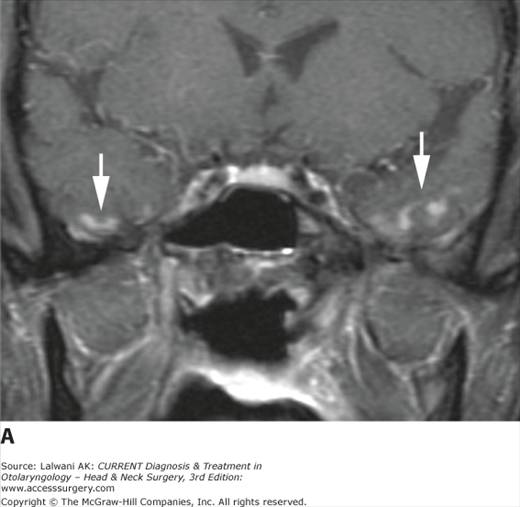
Lesions that may be encountered on imaging studies of the nasopharynx are listed in Table 3–1. Adenoidal hypertrophy (Figure 3–7) is commonly seen in children, young adults, and patients who test positive for the human immunodeficiency virus (HIV), although in the latter group, lymphoma must be considered in the differential diagnosis. Nasopharyngeal carcinoma is the most common malignant lesion of the nasopharynx, and the spectrum of imaging findings that may be encountered with nasopharyngeal carcinoma is illustrated in Figure 3–8. Important issues to consider in the imaging assessment of a patient with nasopharyngeal carcinoma include the presence of extension to the parapharyngeal space and pterygopalatine fossa, the presence of skull base invasion, and the presence of extension to the cranial nerves or the cavernous sinus.
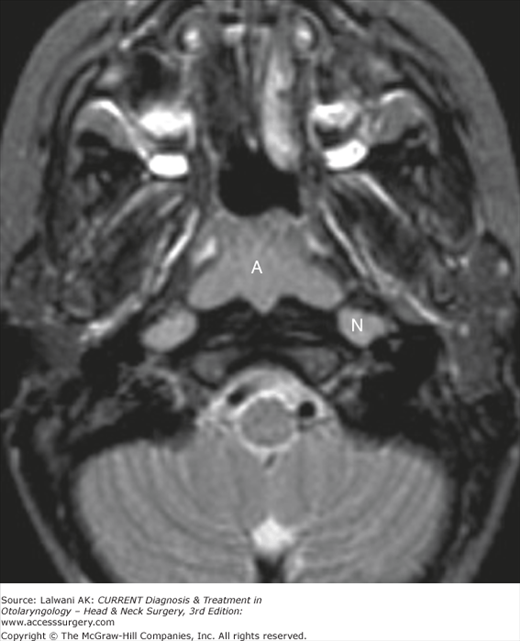
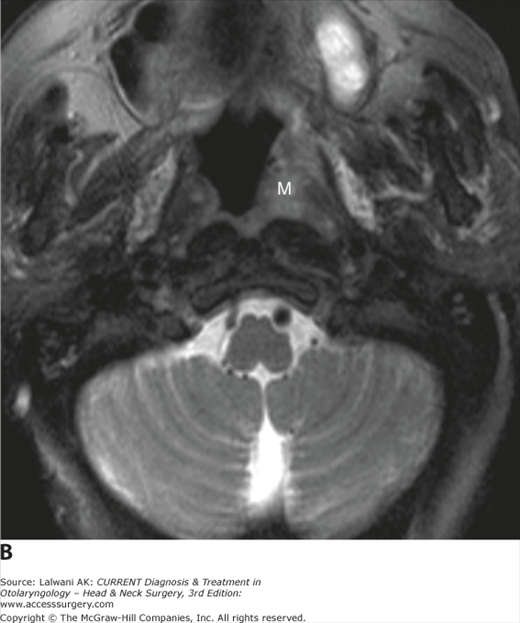
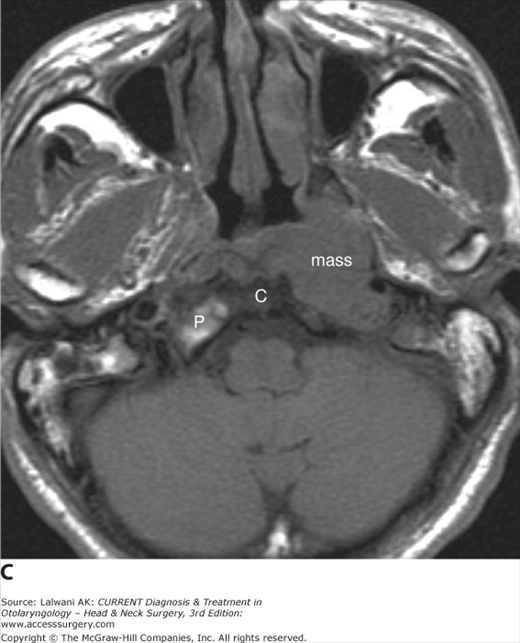
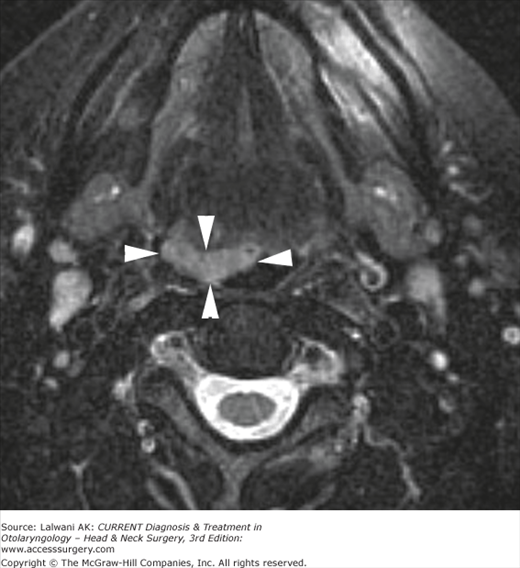
Figure 3–8.
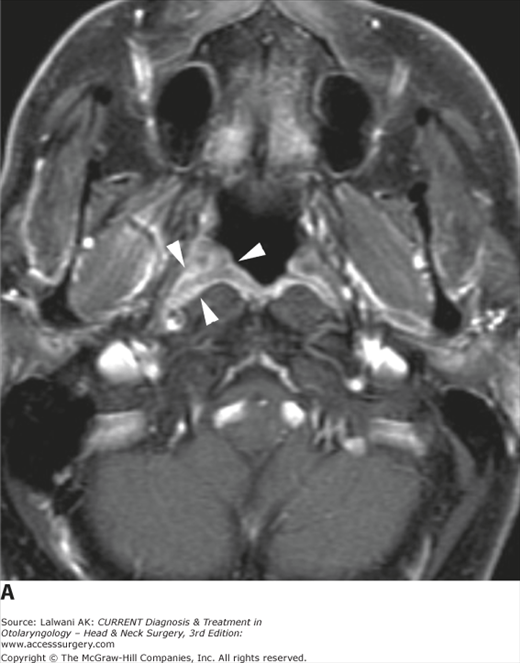


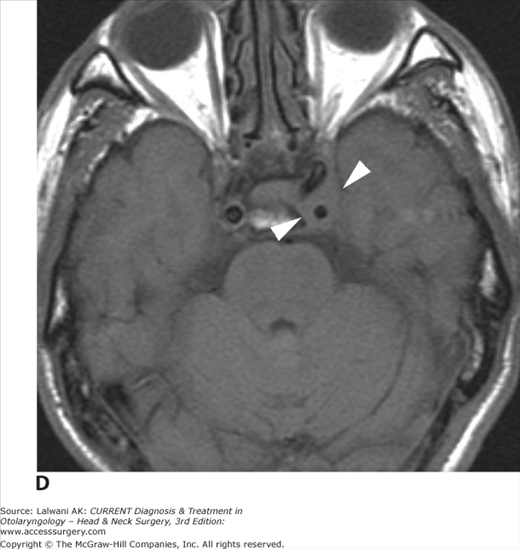
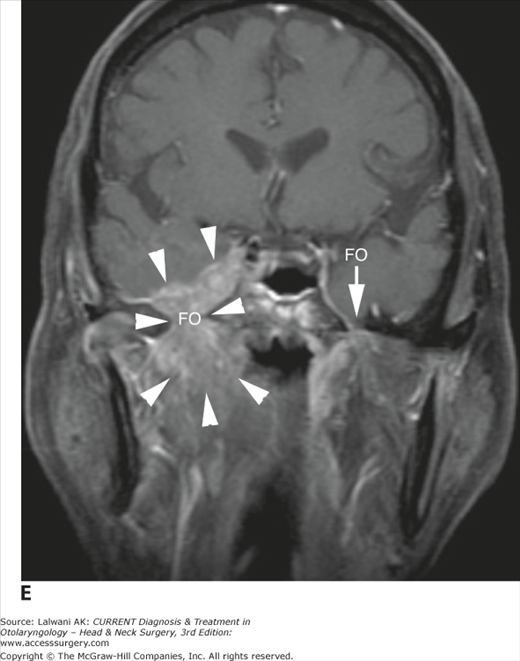
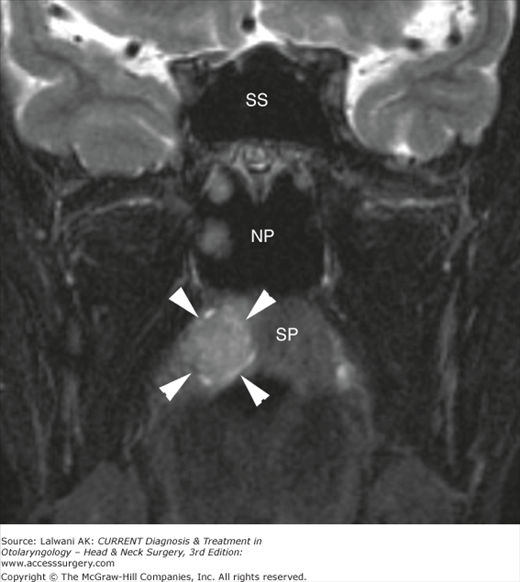
The spectrum of imaging findings in nasopharyngeal carcinoma (NPC). (A) Axial postgadolinium T1-weighted image with fat saturation demonstrates a small mass lesion (white arrowheads) filling the right fossa of Rosenmüller and outlined against adjacent soft tissues by the “white line” of the adjacent enhancing mucosa and mucosal venous plexus. This patient presented with a neck mass (not shown) that revealed poorly differentiated carcinoma on fine needle aspiration. (B) Axial fast spin-echo T2-weighted image with fat saturation in a 45-year-old Chinese woman with a complaint of left ear fullness demonstrates a mass (M) centered on the left fossa of Rosenmüller with extension both anteriorly and medially. (C) Axial T1-weighted image in an older Chinese man with headache, ear pain, and diplopia demonstrates a large mass centered on the left fossa of Rosenmüller, with effacement of adjacent fat planes, erosion of the left petrous bone (compare the normal petrous bone and fatty marrow shown on the right, P), and replacement of the normal high signal intensity marrow within the clivus, C. (D) A more superior image in the same patient shown in part C demonstrates asymmetry of the cavernous sinuses with increased soft tissue on the left (arrowheads), as well as a mild narrowing of the encased cavernous segment of the internal carotid artery, consistent with tumor extension into the cavernous sinus. (E) Coronal T1-weighted image postgadolinium with fat saturation in another Chinese patient with nasopharyngeal carcinoma and right facial numbness in a V3 distribution demonstrates both direct and perineural extension of tumor through a markedly widened right foramen ovale (FO) into the middle cranial fossa (arrowheads). The normal appearance of foramen ovale is demonstrated on the left (white arrow).


| Benign | Malignant |
|---|---|
| Adenoidal hypertrophy | Nasopharyngeal carcinoma |
| Postinflammatory retention cyst | Non-Hodgkin lymphoma |
| Thornwaldt cyst | Malignant tumor of minor salivary gland |
| Benign tumor of minor salivary gland | Rhabdomyosarcoma (in a child) |
- The lateral pharyngeal recesses may be asymmetric owing to mucosal coaptation rather than a true mass lesion. This “pseudomass” can be diagnosed when the clinician or radiologist identifies the “kissing” mucosal surfaces rather than a true mass lesion (Figure 3–9).
- The nasopharynx should be carefully scrutinized for a mass lesion obstructing the eustachian tube orifice in any adult patient with unilateral middle ear or mastoid fluid (Figure 3–10).
- Asymmetrically or unusually prominent nasopharyngeal soft tissue that is seen on an imaging study should prompt a clinical evaluation for neoplasm, especially lymphoma (particularly in the setting of HIV) or nasopharyngeal carcinoma (particularly if the patient is of southern Chinese descent) (Figure 3–11).
- Patients with nasopharyngeal carcinoma should undergo MRI rather than CT scanning for the most complete staging. In patients with nasopharyngeal carcinoma, the skull base should be carefully assessed on T1-weighted images for evidence of invasion, with particular attention to the clivus on a sagittal T1-weighted image. Postgadolinium, the cavernous sinuses and cranial nerves (notably V2 and V3) should be assessed for tumor involvement.
- Radiation necrosis of the temporal lobes may occur following high-dose radiation therapy for nasopharyngeal carcinoma, as may osteoradionecrosis of the skull base and cranial neuritis. These may mimic tumor recurrence on imaging studies (Figure 3–12).
- A patient with nasopharyngeal carcinoma may present with massive cervical lymphadenopathy yet a relatively small primary lesion. The nasopharynx should be carefully scrutinized in a patient presenting with noninfectious cervical lymphadenopathy, particularly when she or he is of southern Chinese descent.
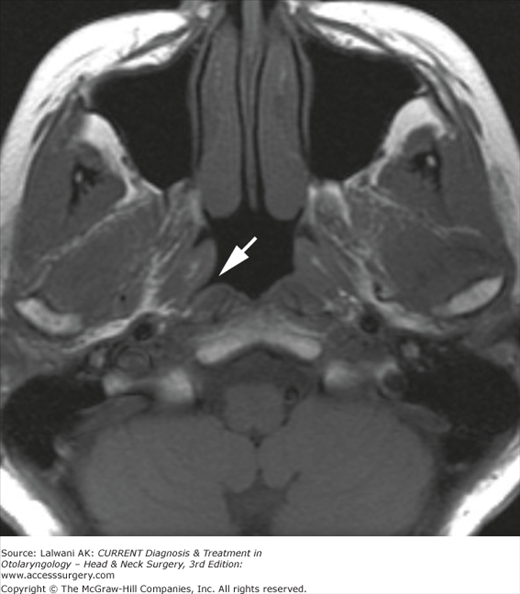
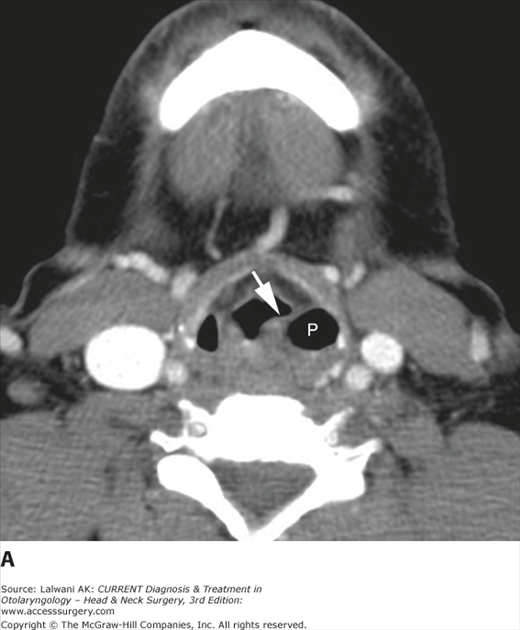
Figure 3–10.
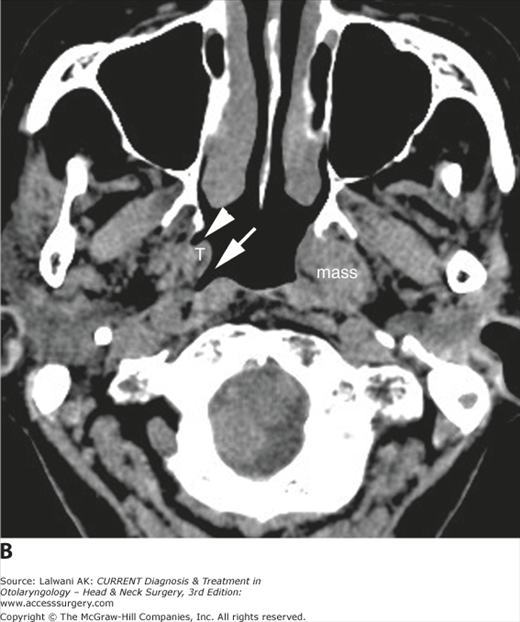
(A) Axial CT image viewed in bone window in an elderly woman presenting with unilateral serous otitis demonstrates fluid or soft tissue density in the left middle ear and mastoid. The right mastoid air cells are well pneumatized. Mastoid air cells are indicated by “Ma” and the middle ear cavities by the white arrows. (B) A more inferior axial noncontrast CT image viewed in a soft tissue window demonstrates a left submucosal nasopharyngeal mass that is obliterating normal anatomic landmarks. The right fossa of Rosenmüller (arrow), torus tubarius (T), and eustachian tube orifice (arrowhead) are shown for comparison. A biopsy of the lesion was suggestive of amyloidosis.
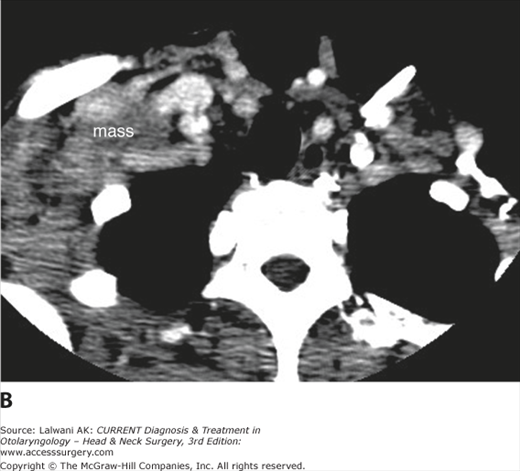
Figure 3–11.
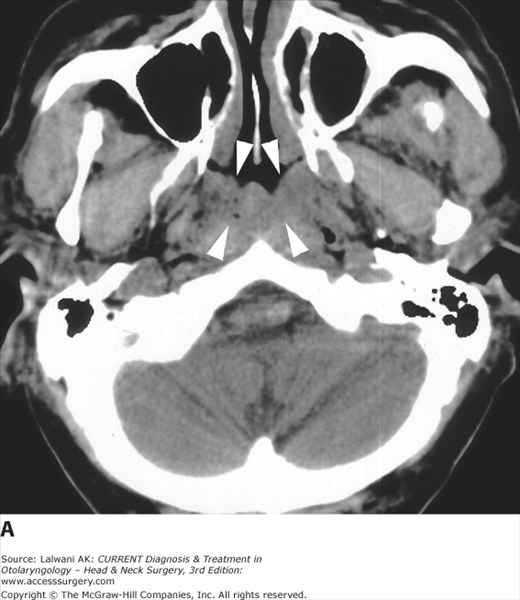
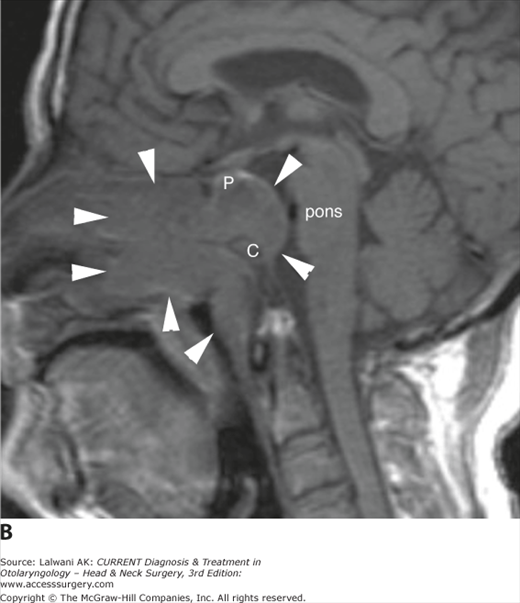
(A) Axial noncontrast CT image viewed in soft tissue window of elderly man of southern Chinese descent demonstrates abnormal fullness of the nasopharyngeal soft tissues for the patient’s age (arrowheads). This was noted, but the patient was lost to clinical follow-up. (B) Sagittal T1-weighted image obtained 4 years later when the patient complained of nasal congestion, epistaxis, and deep pain demonstrates replacement of the clivus (C) and sphenoid sinus by a large soft tissue mass (arrowheads) that is extending anteriorly into the ethmoid sinus and nasal cavity. The pons is displaced posteriorly by a large extradural component of the mass, and the pituitary gland (P) is elevated. A biopsy was consistent with nasopharyngeal carcinoma.
Figure 3–12.
(A) Coronal postgadolinium T1-weighted image with fat saturation demonstrates irregular enhancement (white arrows) in the inferior temporal lobes bilaterally in a patient with a history of high-dose radiation therapy for nasopharyngeal carcinoma. This is a typical location and appearance of radionecrosis. (B) An axial postgadolinium T1-weighted image with fat saturation in the same patient demonstrates enhancement of the left optic nerve (arrowheads). The patient complained of decreased vision in the left eye, which is consistent with radiation-induced optic neuritis. The patient has been followed and has had no evidence of recurrent carcinoma.
The oropharynx (Figure 3–13) is bounded anteriorly by the circumvallate papilla of the tongue, the soft palate, and the anterior tonsillar pillars, posteriorly by the superior and middle constrictor muscles, and superiorly by the soft palate. Inferiorly, it is separated from the larynx by the epiglottis and the glossoepiglottic fold and from the hypopharynx by the pharyngoepiglottic folds. In addition to squamous mucosa, contents of the oropharynx include the faucial and lingual tonsils, minor salivary glands, and pharyngeal constrictor muscles.
Figure 3–13.
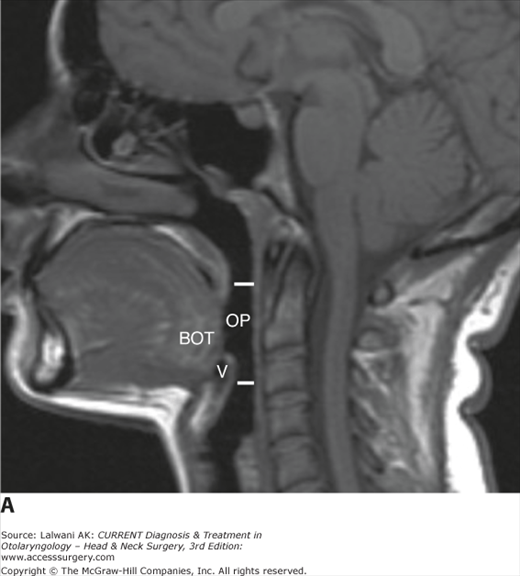
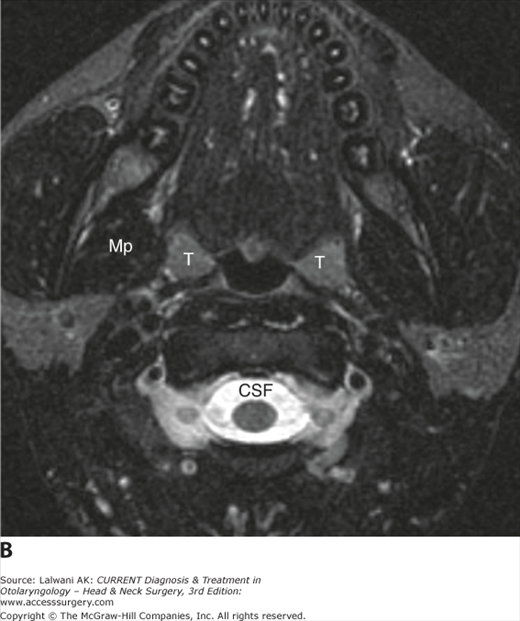
(A) Sagittal T1-weighted image demonstrates the superior and inferior limits of the oropharynx (OP), the region of the upper aerodigestive tract that can be seen posteriorly through an open mouth. Indicated are the vallecula (V) and the base of tongue (BOT). (B) Axial fast spin-echo T2-weighted image with fat saturation demonstrates the normal palatine tonsils (T), which, like other lymphoid tissue, are intermediate in signal intensity (note the much darker muscle [Mp, medial pterygoid muscle] and much brighter CSF) on a T2-weighted image.
Lesions that may be encountered on imaging studies of the oropharynx are listed in Table 3–2. Commonly encountered entities include tonsillar hypertrophy and tonsillar inflammatory processes, especially peritonsillar abscess. In a patient with inflammatory disease, it is important to look for underlying predisposing factors, such as an unsuspected foreign body, and also to look for potentially clinically occult complications, such as septic thrombophlebitis of the jugular vein (Figure 3–14). SCC of the faucial tonsil or base of tongue may present as a bulky exophytic mass lesion or an infiltrative mass lesion, or may have both infiltrative and exophytic components (Figure 3–15). In some cases the primary lesion may be very subtle (Figure 3–16). The margins of the lesion are often poorly defined, and there may be infiltration of adjacent normal fat planes. SCC is typically intermediate in signal intensity on both T1- and T2-weighted images and shows moderately intense enhancement postgadolinium. In a patient with known oropharyngeal SCC, the level II lymph nodes should be carefully scrutinized for evidence of metastatic involvement. Imaging of lymph nodes is discussed in more detail in a later section.
| Benign | Malignant |
|---|---|
| Lingual or faucial tonsillar hypertrophy | Squamous cell carcinoma |
| Tonsillar or peritonsillar abscess | Non-Hodgkin lymphoma |
| Lingual thyroid | Malignant tumor of minor salivary gland |
| Postinflammatory retention cyst | Rhabdomyosarcoma (child) |
| Dystrophic calcification (“tonsillolith”) | |
| Benign tumor of minor salivary gland |
Figure 3–14.
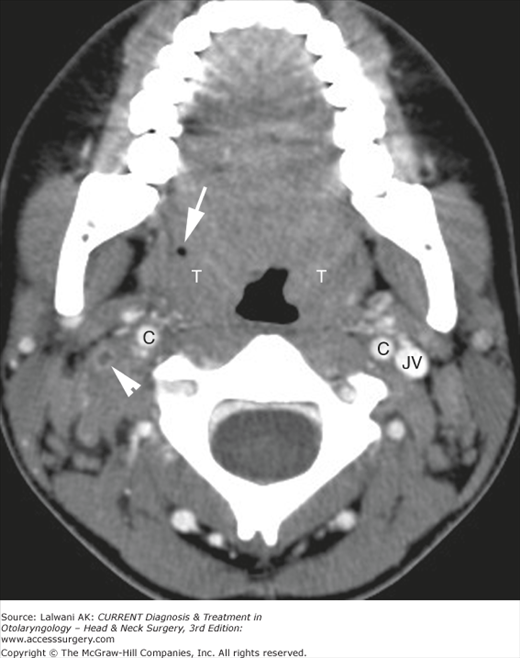
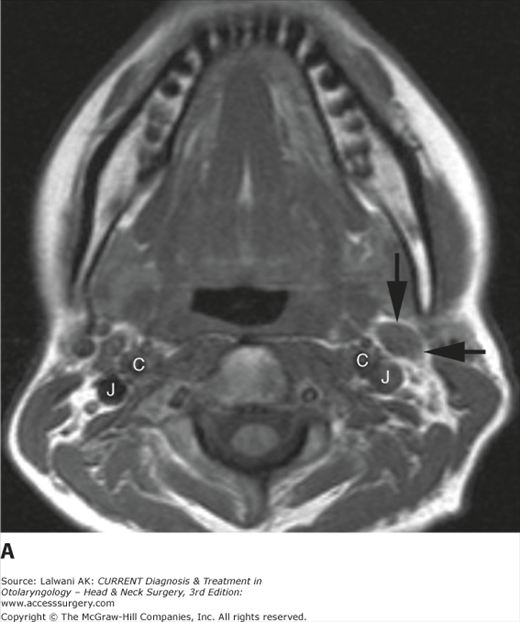
Axial contrast-enhanced CT image in a 16-year-old girl who had pharyngitis for a week as well as the recent incision and drainage of a right peritonsillar abscess demonstrates prominence of both palatine tonsils (T), right more than left. A dot of air (white arrow) is related to the recent incision and drainage. In addition, abnormal soft tissue is seen around the right internal jugular vein, and the vein itself (arrowhead) is thrombosed. The normal carotid arteries (C) and left internal jugular vein (JV) are indicated. The patient’s chest CT scan (not shown) demonstrated multiple pulmonary nodules, some of which were cavitary, consistent with septic pulmonary emboli in a patient with Lemierre syndrome.
Figure 3–15.
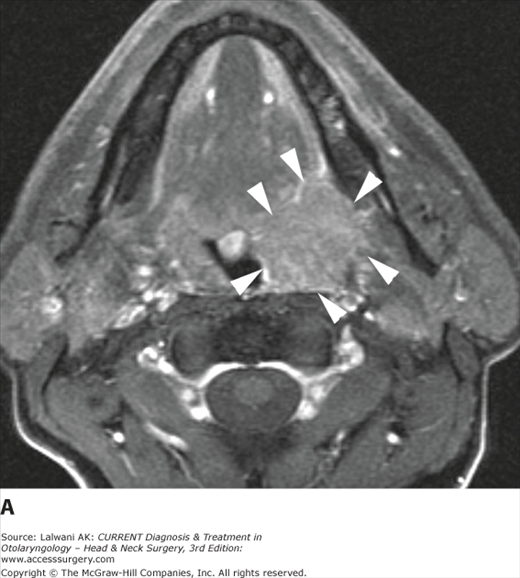
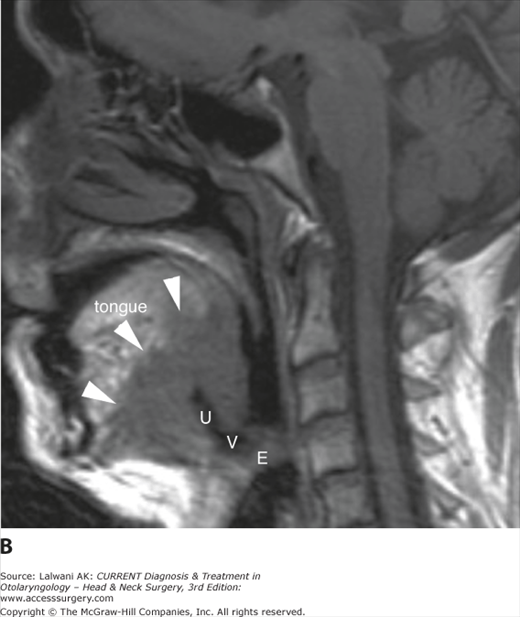
(A) Axial postgadolinium Tl-weighted image with fat saturation demonstrates a bulky mass in the left tonsillar fossa (white arrowheads), consistent with squamous cell carcinoma. There is mass effect on the left base of tongue, but no gross invasion. (B) Sagittal Tl-weighted image in a different patient with squamous cell carcinoma of the base of tongue demonstrates a large mass lesion (arrowheads) that is deeply infiltrative into the tongue as well as being exophytic into the vallecula (V) and displacing the epiglottis (E) posteriorly. A deep ulceration (U) is present. Note that the oral tongue shows high signal intensity consistent with extensive fatty infiltration. This is related to denervation change secondary to neoplastic invasion of CN XII.
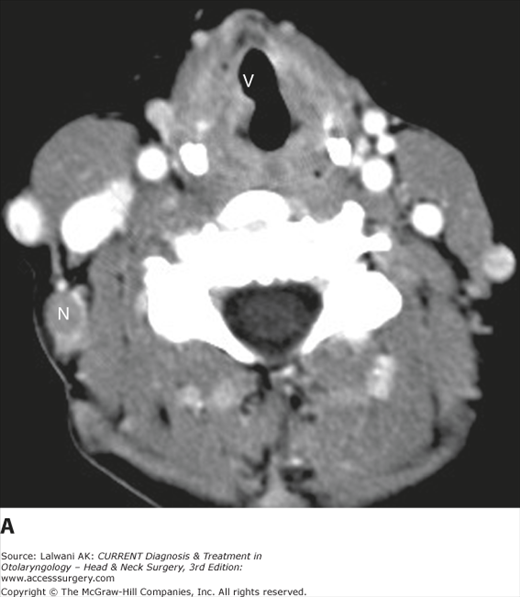
Figure 3–16.
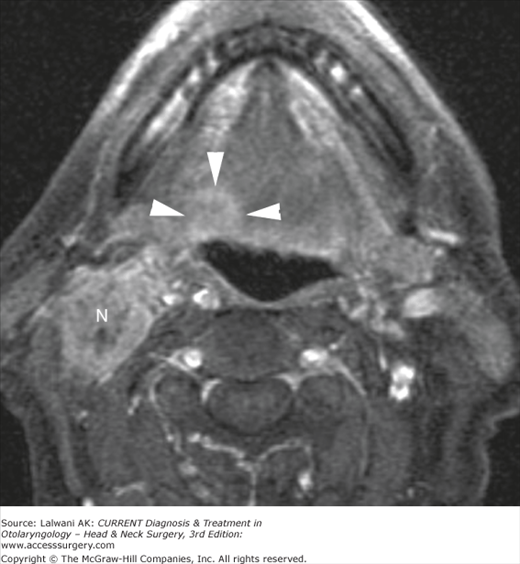
Axial postgadolinium Tl-weighted image with fat saturation in an older man presenting with metastatic cervical adenopathy from squamous cell carcinoma and no clear primary site on clinical examination demonstrates a large metastatic node (N) as well as a subtle, infiltrative lesion at the right base of tongue (arrowheads) consistent with squamous cell carcinoma of the base of tongue.
- Lymphoid hyperplasia of the palatine or lingual tonsils, especially if asymmetric, may mimic an aggressive process such as SCC, but no invasive or infiltrative component will be identified (Figure 3–17).
- In a patient with a prior unilateral tonsillectomy, the remaining contralateral tonsil may appear to represent a mass lesion but is really a pseudomass (Figure 3–18).
- CT imaging is generally the modality of choice for the assessment of infectious and inflammatory processes because of its sensitivity to calcification, foreign bodies, and gas within soft tissues; it is also rapid and widely available. In the setting of peritonsillar abscess, CT scanning may show extension of the process beyond the confines of the pharyngeal constrictor muscles into adjacent deep spaces.
- Lingual thyroid tissue is seen as a rounded, midline soft tissue mass at the level of the foramen cecum. The lesion is intrinsically dense on a noncontrast CT scan because of its iodine content and enhances intensely postcontrast (Figure 3–19). In a patient with lingual thyroid tissue, the lower neck should be carefully scrutinized to assess whether any thyroid gland is present in the normal location.
- A well-circumscribed mass of the soft palate most commonly represents a pleomorphic adenoma, although a low-grade minor salivary gland malignant neoplasm may have an identical imaging appearance (Figure 3–20).
- The palatine tonsil and the base of tongue are common sites for “unknown” primary lesions in patients who present with metastatic cervical lymphadenopathy but with no obvious primary site lesion on careful head and neck examination. In some of these cases, CT scanning or MRI may demonstrate a primary site. FDG PET/CT scanning has also been shown to play a role in the search for the unknown primary.
- The possibility of perineural spread of tumor should be evaluated. Tonsillar SCC may invade the masticator space and access V3, whereas SCC of the base of tongue may access cranial nerves (CN) IX and XII (the glossopharyngeal and hypoglossal nerves, respectively), as well as the lingual nerve. Tumors of the palate may access the palatine nerves and the pterygopalatine fossa, from which they may spread intracranially via the vidian canal and foramen rotundum.
Figure 3–17.
Axial fast spin-echo T2-weighted image with fat saturation in an older woman complaining of a sore throat demonstrates asymmetric soft tissue at the right base of tongue (arrowheads), which may be suggestive of lymphoma or squamous cell carcinoma, although no invasive component is identified. Operative resection for a definitive biopsy yielded only normal lingual tonsillar tissue.
Figure 3–18.
Axial fast spin-echo T2-weighted image with fat saturation in a patient who has undergone a prior left tonsillectomy demonstrates marked oropharyngeal asymmetry due to the presence of normal tonsillar tissue on the right (T) and no tissue on the left. Inhomogeneity along the left anterior aspect of the image is related to a ferromagnetic nonremovable dental appliance.
Figure 3–19.
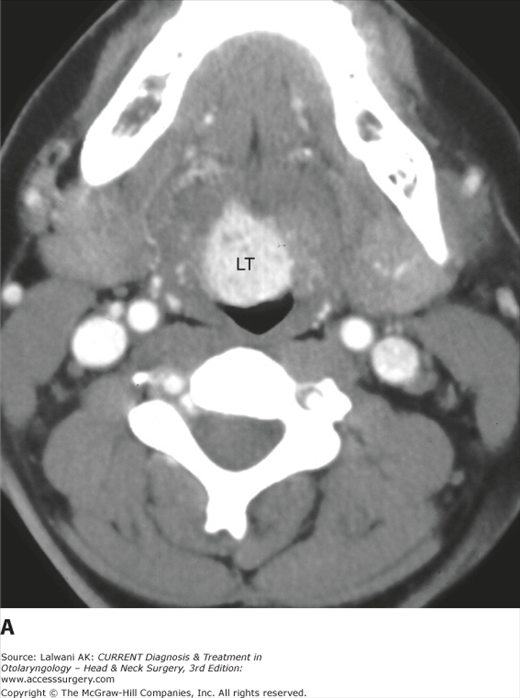
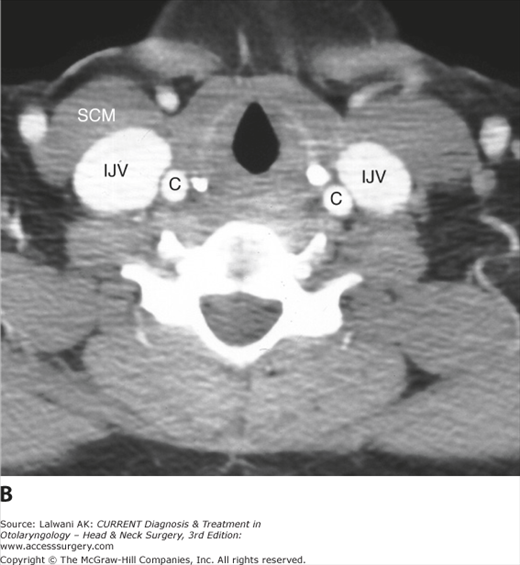
(A) Axial contrast-enhanced CT scan demonstrates a densely enhancing soft tissue mass in the midline of the base of tongue, consistent with lingual thyroid (LT). (B) A more inferior image through the low neck shows no normal thyroid tissue. Indicated are the common carotid artery (C), the internal jugular vein (IJV), and the sternocleidomastoid muscle (SCM).
Figure 3–20.
Coronal fast spin-echo T2-weighted image with fat saturation in a 50-year-old man with HIV demonstrates a fairly well-circumscribed mass (arrowheads) arising from the soft palate (SP). A pleomorphic adenoma was expected, but at resection, this mass was found to be a low-grade adenocarcinoma. The sphenoid sinus (SS) and nasopharynx (NP) are indicated.
The oral cavity (Figure 3–21) is bounded superiorly by the hard palate, the superior alveolar ridge, and the maxillary teeth, laterally by the cheek, posteriorly by the circumvallate papilla and anterior tonsillar pillars (which separate it from the oropharynx), and inferiorly by the mylohyoid muscle, the inferior alveolar ridge, and the mandibular teeth. The mucosal area of the oral cavity includes the oral tongue and mucosa-covered surfaces, which are readily accessible to clinical examination. The oral mucosa has buccal, gingival, lingual, sublingual, and palatal surfaces. In addition to the ubiquitous squamous epithelium, minor salivary glands are located throughout the oral cavity.
Figure 3–21.
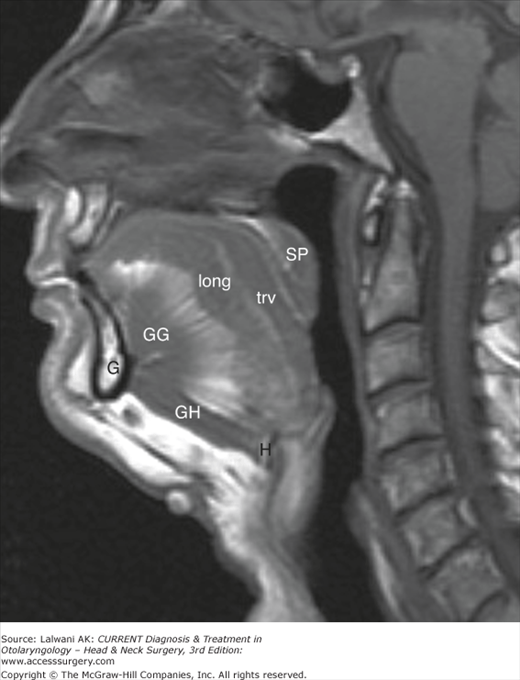
Sagittal T1-weighted image demonstrates the normal anatomy of the oral cavity. The genu (G) of the mandible and the hyoid bone (H) are indicated, along with extrinsic tongue musculature (genioglossus [GG] and geniohyoid [GH]) and intrinsic tongue musculature (longitudinal and transverse muscle fibers). The soft palate (SP) is also shown.
Two other major spaces are also considered in any discussion of the oral cavity: the sublingual and submandibular spaces (Figure 3–22). These spaces are separated from each other by the mylohyoid muscle, which defines the muscular floor of mouth. The sublingual space is not a true fascia-defined space; rather, it is located in the oral tongue between the mylohyoid muscle inferolaterally and the genioglossus–geniohyoid complex medially. It freely communicates with the submandibular space around its posterior edge, and its important contents include the sublingual glands and ducts, the submandibular (Wharton) duct, the lingual artery and vein, the lingual nerve, and CN IX and XII. The submandibular space is located inferolateral to the mylohyoid muscle and superior to the hyoid bone. It is partly defined by the superficial layer of deep cervical fascia, but communicates freely with both the sublingual space around the back edge of the mylohyoid muscle and also the inferior parapharyngeal space. Important contents of the submandibular space include the submandibular gland, the level I lymph nodes, the facial artery and vein, and CN XII.
The oral cavity is readily accessible to direct visualization and palpation, but imaging studies can be very helpful in assessing the deep extent of processes and guiding surgical management. In the mucosal area and oral tongue itself, the most common pathologies encountered are SCC (Figure 3–23) and extension of odontogenic infections. Benign or malignant minor salivary gland lesions may also be seen, as may congenital lesions such as venolymphatic malformations (Figure 3–24) and dermoids and epidermoids. In the setting of injury to or a lesion of CN XII, denervation change may be seen in the ipsilateral hemitongue, which may mimic a mass lesion to the unsuspecting observer.
Figure 3–24.
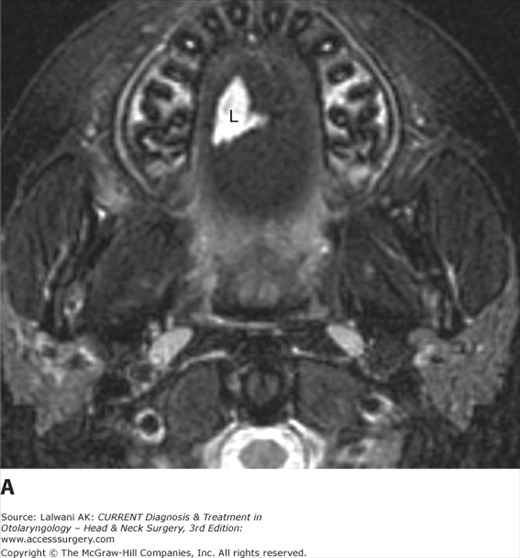
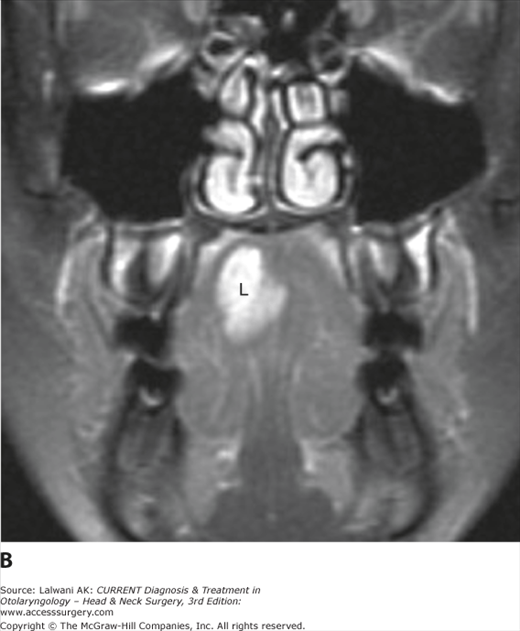
(A) Axial fast spin-echo T2-weighted image with fat saturation in a young woman with fullness in her right hemitongue and a slight bluish discoloration on clinical examination demonstrates a multilobulated, well-circumscribed, hyperintense mass lesion (L). (B) Postgadolinium, a coronal Tl-weighted image with fat saturation demonstrates intense and homogeneous enhancement. The appearance is consistent with a venous malformation.
Within the sublingual space, lesions that may be encountered on imaging studies are most frequently masses of congenital, inflammatory, or malignant neoplastic etiology. As in the mucosal space, venolymphatic malformations and dermoids and epidermoids may occur. A dilated submandibular duct due to stenosis, calculus, or neoplastic obstruction may be seen (Figure 3–25), as may a ranula (Figure 3–26). Changes due to cellulitis (Ludwig angina) and frank abscess formation may also be present. Finally, SCC extending from the mucosal surface of the oral cavity (Figure 3–27) or due to deep anterior extension from the tongue base may be encountered. A similar list of diagnostic considerations can be applied in the submandibular space, with a few important additions: notably, a second branchial cleft cyst (see Cystic Neck Masses later in this chapter) and lymphadenopathy, which may be reactive, inflammatory, or neoplastic, with nodal lymphoma and metastatic SCC accounting for most cases of neoplastic submandibular lymphadenopathy. Neoplastic lesions of the submandibular gland itself most commonly represent pleomorphic adenoma, but on imaging studies alone, these are often indistinguishable from carcinomas. The more common pathologies of the oral cavity and associated spaces are summarized in Table 3–3.
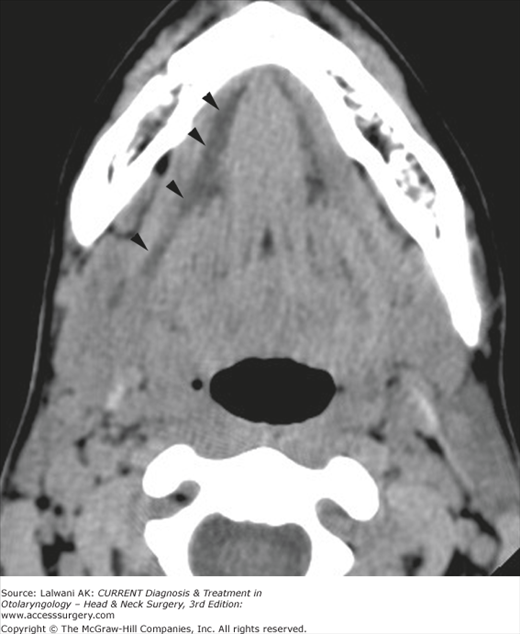
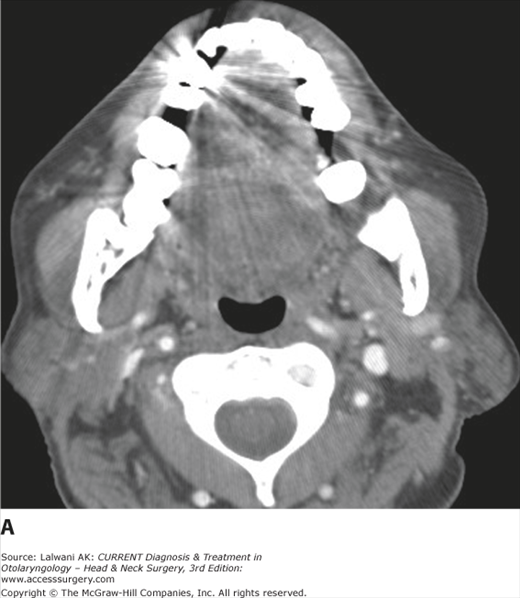
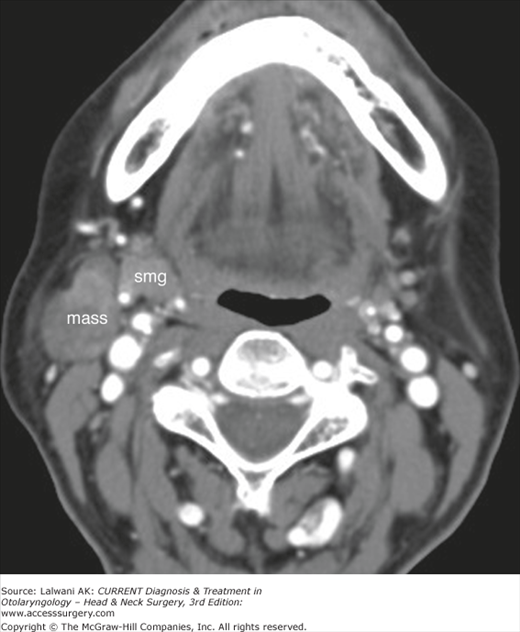
Figure 3–26.
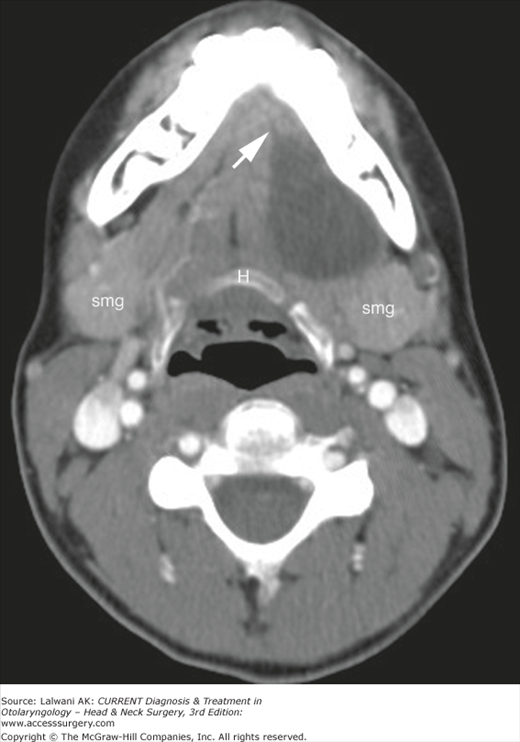
Axial contrast-enhanced CT scan through the floor of mouth in a patient with a painless swelling of the left sublingual space demonstrates a well-circumscribed fluid-density mass with a narrow extension (white arrow) to the anterior aspect of the sublingual space. A simple ranula was confirmed surgically. The submandibular glands (smg) and hyoid bone (H) are indicated.
Figure 3–27.
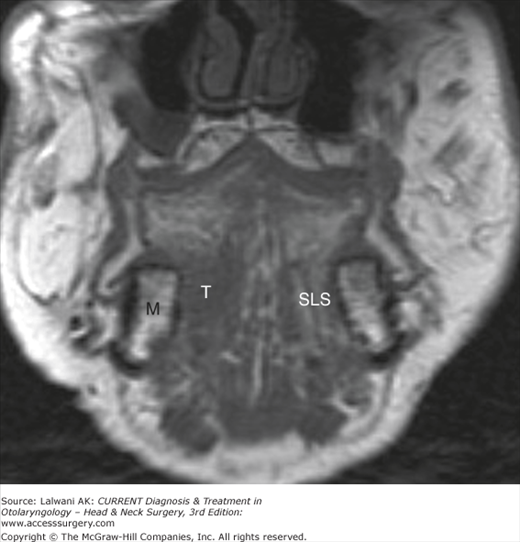
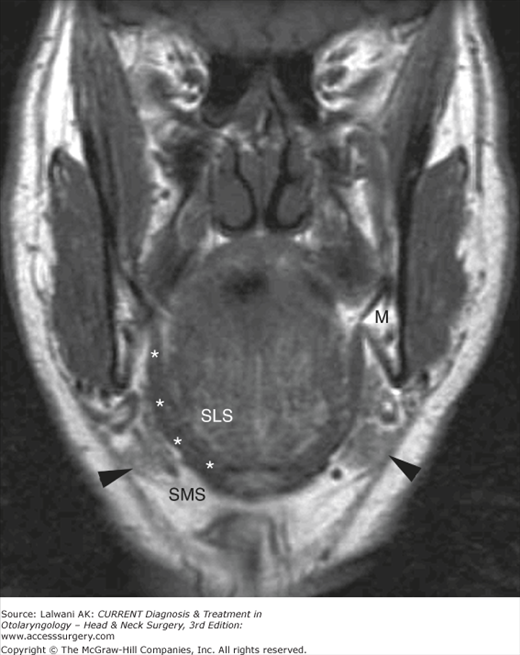
Coronal Tl-weighted image in an elderly man with squamous cell carcinoma of the anterior floor of mouth demonstrates infiltration of tumor (T) into the right sublingual space; the normal fatty left sublingual space (SLS) is shown for comparison. The mandible (M) is also indicated. Note how useful a pregadolinium Tl-weighted image is for demonstrating the replacement of normal fat by infiltrative soft tissue.
| Neoplastic | |||
|---|---|---|---|
| Congenital/Developmental | Infectious/Inflammatory | Benign | Malignant |
| Hemangioma | Cellulitis or Ludwig angina | Pleomorphic adenoma | Squamous cell carcinoma |
| Venolymphatic malformation | Abscess | Other benign lesions of minor salivary origin | Malignant neoplasm of minor salivary origin |
| Dermoid or epidermoid | Dilated submandibular (Wharton) duct | Lipoma | Nodal metastases from SCC (SM space) |
| Second branchial cleft cyst (SM space) | Ranula, simple or plunging | Nodal involvement by lymphoma (SM space) | |
- Because so much of the oral cavity is readily accessible to inspection and palpation, imaging studies must focus on addressing specific issues: submucosal and deep extension of neoplastic or inflammatory processes, bone involvement, and perineural spread of disease (Figure 3–28).
- Level I and II lymph nodes should be carefully assessed bilaterally in patients with oral cavity carcinoma, as bilateral nodal spread is common.
- The mucosal area of the oral cavity, particularly the buccal mucosa, can be better assessed on imaging examinations if the patient is asked to “puff out” his or her cheeks during a CT or MRI study to separate the buccal mucosa from the underlying teeth and gums (Figure 3–29).
- MRI is generally the study of choice to assess neoplasms of the oral cavity because it is less sensitive to dental artifact than CT scanning and provides superior soft tissue contrast for most processes (Figure 3–30).
- MRI is less sensitive to calcification than CT scanning; therefore, CT imaging is the study of choice for assessment of calculus disease, as well as for most infectious and inflammatory processes (Figure 3–31).
- In some cases, cellulitis and phlegmonous changes can be difficult to distinguish from an abscess. An abscess has a well-defined enhancing rim and a nonenhancing pus-filled center, and it exerts mass effect on local tissues rather than infiltrating along and obscuring fascial planes.
- A denervated hemitongue due to palsy of CN XII can mimic a mass lesion in the acute and subacute phases of denervation, when the tongue may be bright on a T2-weighted image and show enhancement postgadolinium (Figure 3–32). Denervation changes respect the midline perfectly, unlike most mass lesions. In addition, the lingual septum deviates toward rather than away from the “lesion,” and the tongue flops back into the oropharynx owing to atrophy and loss of muscle tone.
- A pedunculated mass of the parotid tail (Figure 3–33) may present clinically as a mass in the posterior submandibular space.
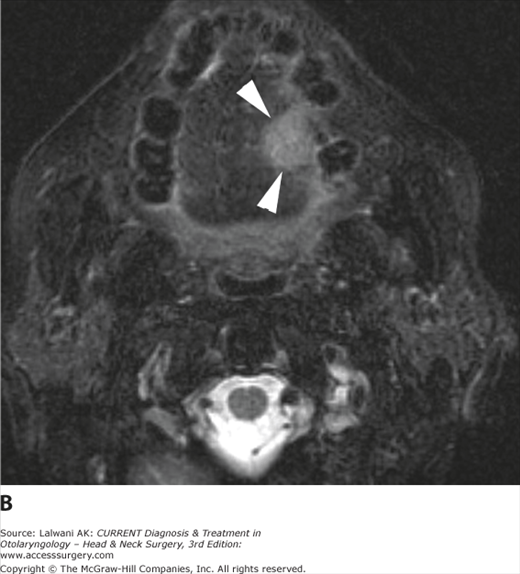
Figure 3–28.
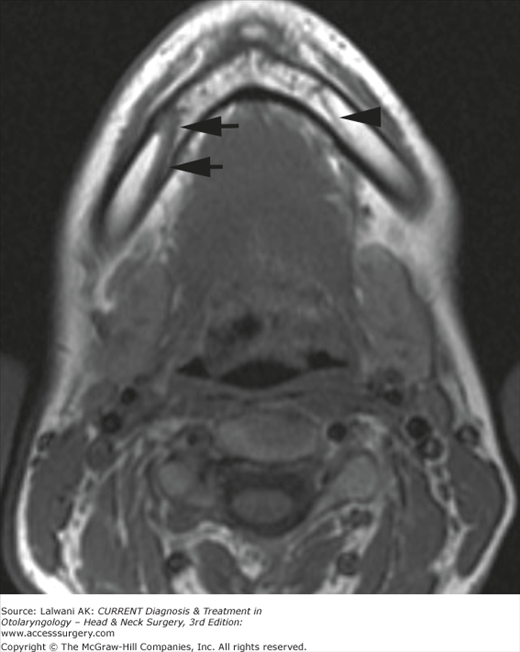
Axial Tl-weighted image in a 45-year-old woman with a history of squamous cell carcinoma of the right gingivobuccal sulcus and new chin numbness demonstrates abnormal soft tissue in the right inferior alveolar canal (arrows) compared with the left (arrowhead), consistent with the perineural spread of disease. This was confirmed at the time of mandibulectomy.
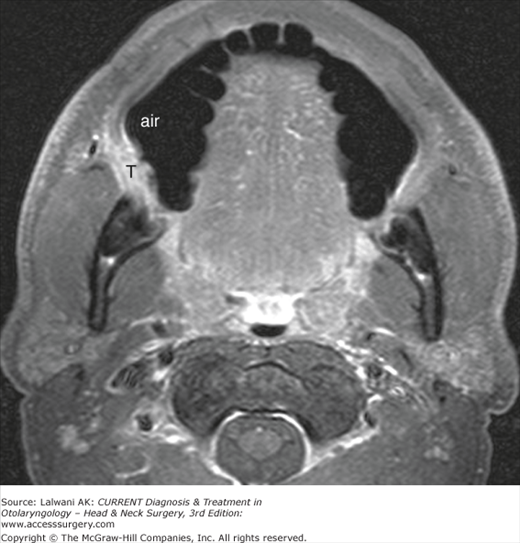
Figure 3–30.
(A) Axial contrast-enhanced CT image in an older man with a left lateral squamous cell carcinoma of the tongue. The lesion is difficult to demonstrate given extensive streak artifact related to the patient’s dental work as well as the relatively poor contrast between the lesion and the tongue musculature. (B) The tumor (arrowheads) is very well seen on an axial fast spin-echo T2-weighted image with fat saturation.
Figure 3–31.
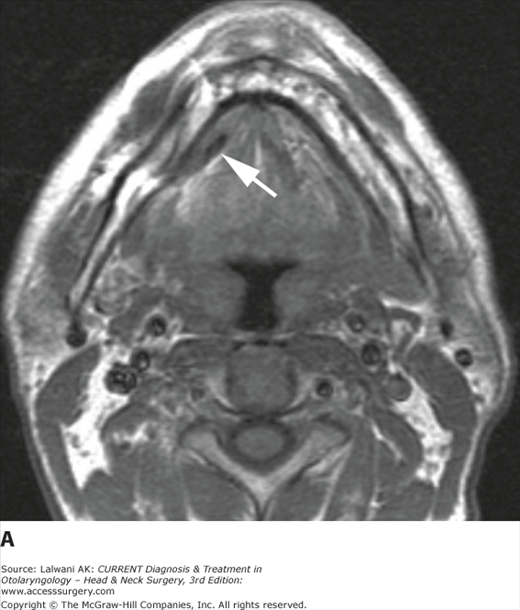
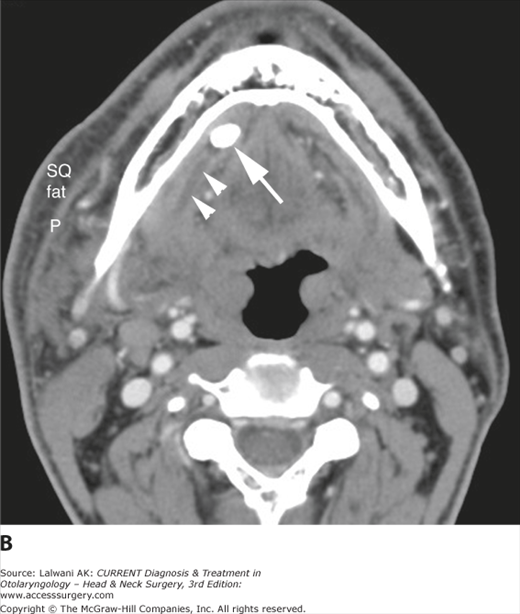
(A) Axial Tl-weighted image in a young man complaining of fullness and slight tenderness in the right submandibular region. An ovoid low signal intensity structure in the right anterior floor of mouth (white arrow) was overlooked. This patient should probably have been referred for a CT scan rather than an MRI, given that inflammatory disease was more likely than neoplasm. (B) Axial contrast-enhanced CT scan obtained 4 weeks later, when the patient presented with fever and dramatic pain and swelling of the submandibular region. A calculus (arrow) obstructing the right submandibular duct (arrowheads) is seen, as well as inflammatory changes in the sublingual space with the effacement of fat planes. The platysma (P) is thickened, and the infiltration of subcutaneous fat is consistent with cellulitis. More inferiorly, a large abscess involving the submandibular gland was seen (not shown).
Figure 3–32.
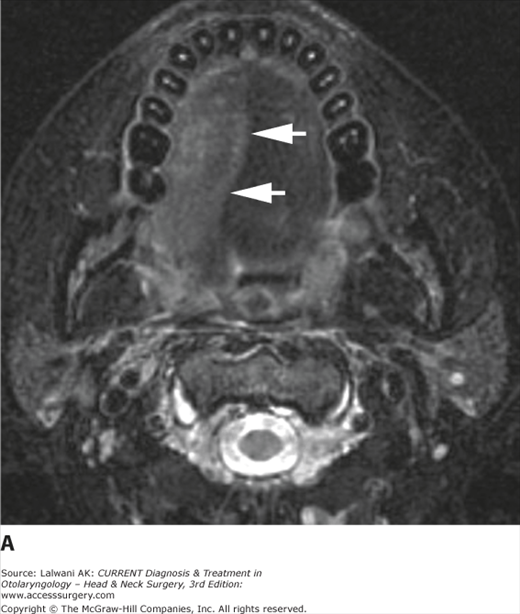
(A) Axial fast spin-echo T2-weighted image with fat saturation in a woman with a right CN XII palsy due to neoplastic infiltration of the skull base at the level of the hypoglossal canal (not shown) demonstrates sharply marginated hyperintensity of the right hemitongue (arrows) consistent with acute or subacute denervation change. Note that the lingual septum deviates toward the side of the “lesion,” whereas a mass would be expected to push the lingual septum away. (B) Postgadolinium, an axial Tl-weighted image with fat saturation demonstrates the enhancement of the right hemitongue as well as ptosis of the right tongue into the oropharynx, with compression of the ipsilateral right tonsil (T) compared with the left. These findings are typical of denervation change due to injury of CN XII.
Figure 3–33.
Axial postcontrast CT scan in a patient thought to have a mass arising from the submandibular gland (smg) demonstrates a well-circumscribed mass arising from the parotid tail, immediately adjacent to the submandibular gland. Fine-needle aspiration was consistent with pleomorphic adenoma.
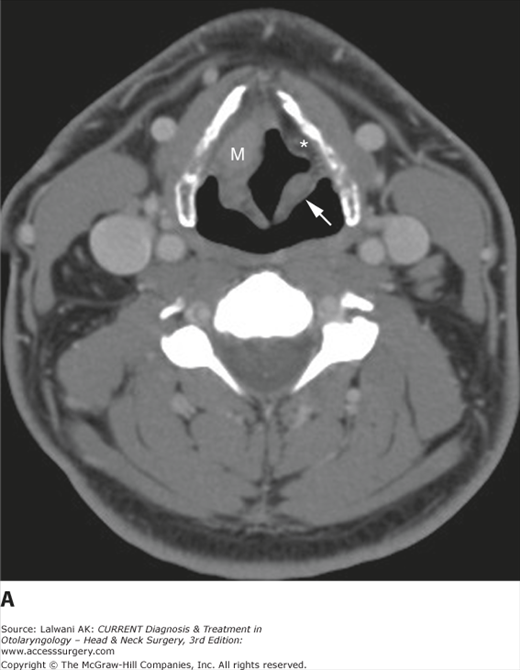
The hypopharynx represents the inferior continuation of the pharyngeal mucosal space, distinct from the oropharynx above and the larynx anteroinferiorly. Three major subsites of the hypopharynx are recognized: the pyriform sinus, the postcricoid area, and the posterior pharyngeal wall (Figure 3–34). The pyriform sinuses are bilaterally symmetric spaces marginated by the aryepiglottic folds anteromedially, the posterior thyroid cartilage ala laterally, and the most lateral aspect of the posterior hypopharyngeal wall posteriorly. The pyriform sinuses are shaped like inverted pyramids such that the tip of the sinus, also known as the pyriform apex, lies at the true vocal cord level. The postcricoid area forms the anterior wall of the lower pharynx at the level of the pharyngoesophageal junction, extending from the level of the arytenoid cartilages above to the inferior border of the cricoid cartilage below. This area is difficult to delineate on imaging studies because mucosal surfaces are usually coapted. The hypopharyngeal segment of the posterior pharyngeal wall extends from the bottom of the vallecula above to the esophageal inlet below. The hypopharynx contains only squamous mucosa, minor salivary glands, and the inferior constrictor muscles.
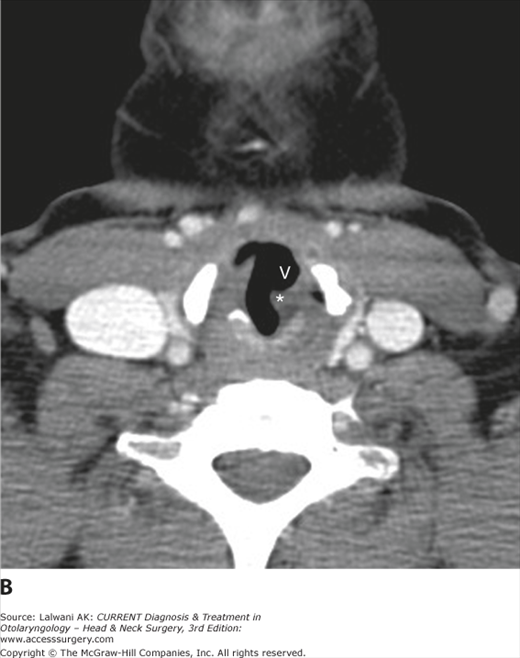
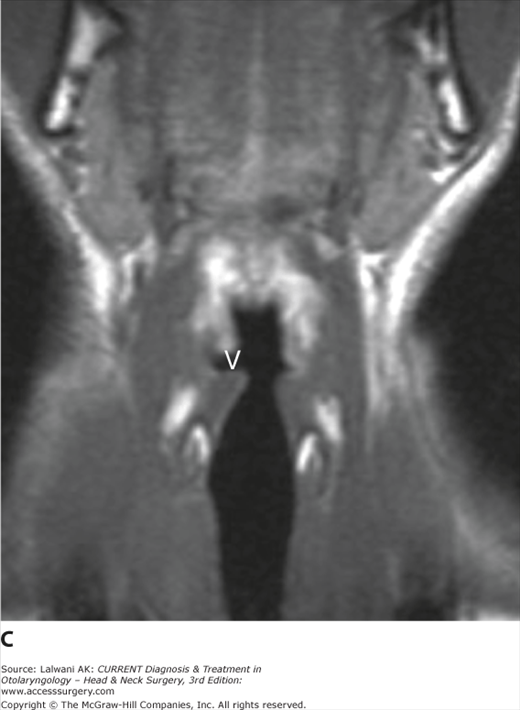
Figure 3–34.
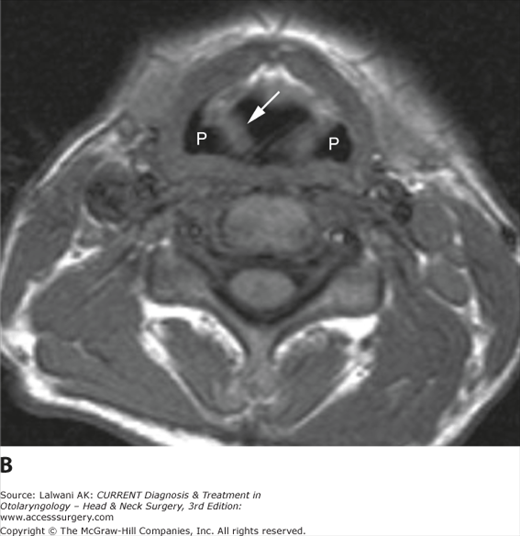
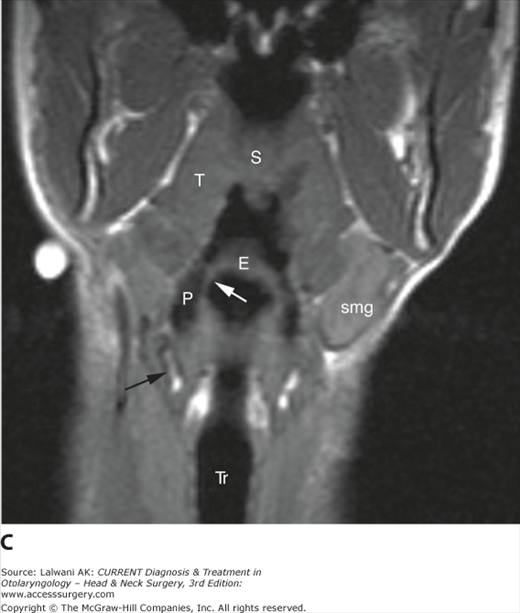
(A) Sagittal Tl-weighted image demonstrates the hypopharynx (white lines) extending from the level of they hyoid bone (H) and vallecula (V) superiorly to the cricopharyngeus inferiorly, with the inferior extent approximated by the inferior margin of the cricoid cartilage. (B) Axial Tl-weighted image demonstrates the pyriform sinuses (P) and the right aryepiglottic fold (arrow). (C) Coronal Tl-weighted image demonstrates the pyriform sinus (P), epiglottis (E), aryepiglottic fold (white arrow), thyroid cartilage (black arrow), tonsil (T), trachea (Tr), soft palate (S), and submandibular gland (smg).
The dominant pathology of the hypopharynx is SCC. Other lesions include retention cysts, benign and malignant tumors of minor salivary origin, and extranodal lymphoma. The pyriform sinus is the subsite most commonly involved with SCC, and these lesions are usually advanced at presentation and have a high incidence of nodal metastases (Figure 3–35).
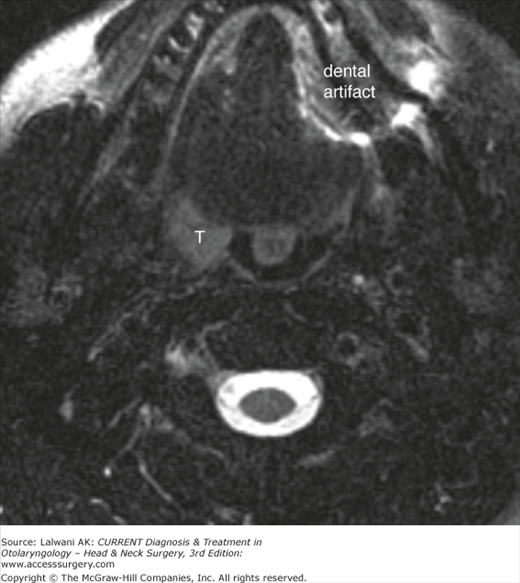
Figure 3–35.
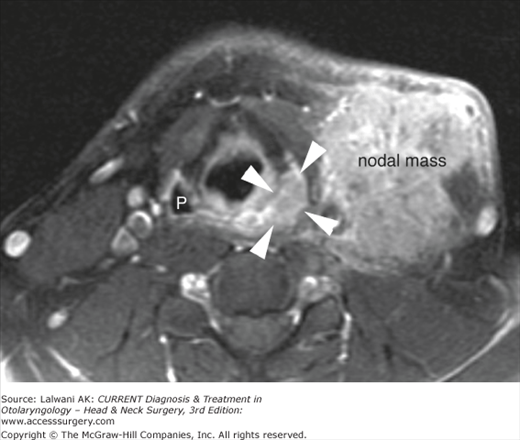
Axial postgadolinium Tl-weighted image with fat saturation in a patient presenting with a left neck mass (nodal mass) shows a relatively small primary lesion in the left pyriform sinus (arrowheads). The normal right pyriform sinus (P) is indicated. Fine-needle aspiration of the nodal mass confirmed squamous cell carcinoma.
- The walls of the pyriform sinus are frequently coapted during imaging studies. Certain maneuvers, such as the Valsalva or “trumpet” maneuver, may help dilate the pyriform sinus and improve the imaging assessment.
- The pyriform sinus is a site where a small primary lesion may not be readily apparent in a patient who presents with metastatic cervical lymphadenopathy and no evidence of a primary lesion (“unknown primary”). It must therefore be carefully assessed on imaging studies performed in patients with metastatic cervical lymphadenopathy of unknown primary.
- A lesion of the pyriform apex approaches the upper margin of the cricoid cartilage and may erode cartilage even when relatively small. Cricoid erosion may also be secondary to a primary tumor of the postcricoid region (Figure 3–36).
- Symmetric lesions of the posterior pharyngeal wall may be subtle and difficult to detect on imaging studies. A sagittal T1-weighted image can be very helpful in these cases.
- Lesions of the hypopharynx have a propensity to spread to retropharyngeal nodes, so these nodes should be carefully scrutinized in patients with hypopharyngeal cancers (Figure 3–37).
Figure 3–36.
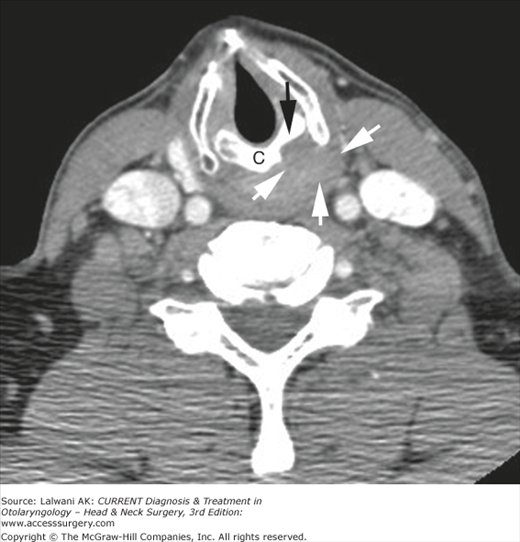
Axial postcontrast CT scan in a patient with new hoarseness and throat pain demonstrates focal erosion (black arrow) of the posterolateral cricoid cartilage (C) by a mass arising from the postcricoid hypopharynx (white arrows). This lesion could probably be better delineated from adjacent soft tissues on an MRI. Biopsy demonstrated squamous cell carcinoma.
Figure 3–37.
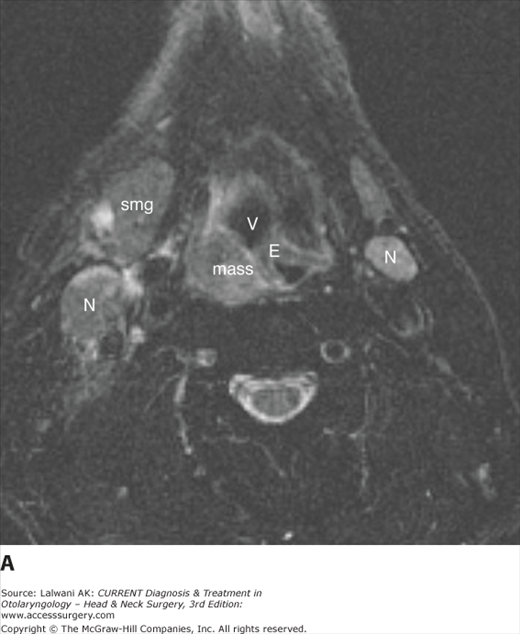
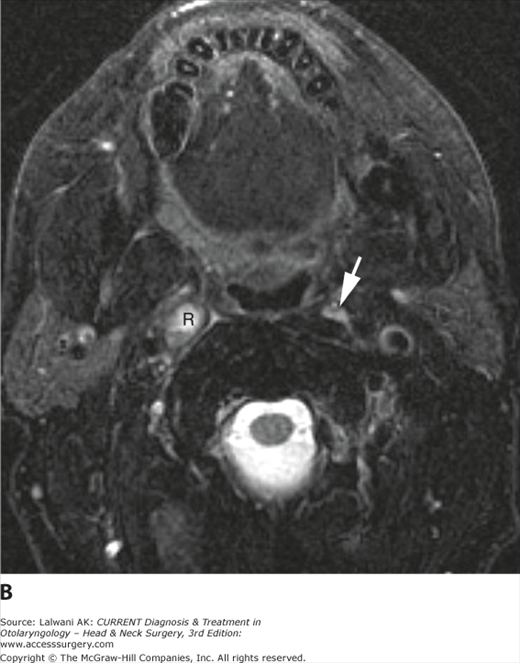
(A) Axial fast spin-echo T2-weighted image with fat saturation demonstrates a hypopharyngeal mass with associated bilateral lymphadenopathy (N). Biopsy of the mass demonstrated squamous cell carcinoma of the posterolateral pharyngeal wall. E, epiglottis; smg, submandibular gland; V, vallecula. (B) A more superior image demonstrates ipsilateral pathologic retropharyngeal lymph node (R) enlargement and heterogeneity. A normal contralateral retropharyngeal node (white arrow) is shown for comparison.
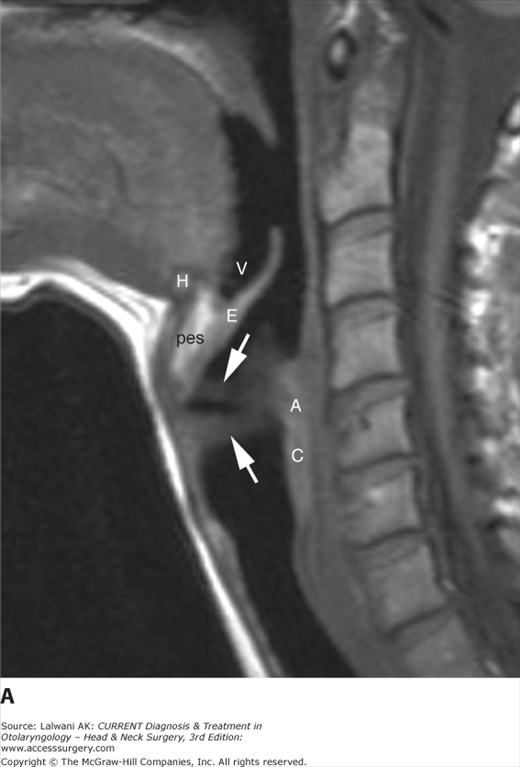
The soft tissues of the larynx (ie, the mucosa, the submucosa, and muscle) are draped over and attached to a supporting framework of cartilage, which gives the larynx its form. The endolarynx is divided into three subsites: the supraglottis, the glottis, and the subglottis (Figure 3–38). The supraglottis extends from the tip of the epiglottis above to the level of the laryngeal ventricles below and includes the epiglottis, the preepiglottic space, the aryepiglottic folds, the false vocal cords, the paraglottic space, and the arytenoid cartilages. The preepiglottic space is a fat-filled space bounded by the hyoid bone anteriorly and the epiglottis posteriorly, and halved by the hyoepiglottic ligament. The preepiglottic space communicates laterally with the paraglottic space, which is a bilateral, fat-filled space deep to the true and false vocal cords. The glottis includes the true vocal cords as well as the anterior and posterior commissures, whereas the subglottis extends from the undersurface of the true vocal cords above to the inferior surface of the cricoid cartilage below. The fibroelastic membrane known as the conus elasticus defines the lateral margin of the subglottis and extends from the cricoid cartilage below to the medial margin of the true vocal cord above.
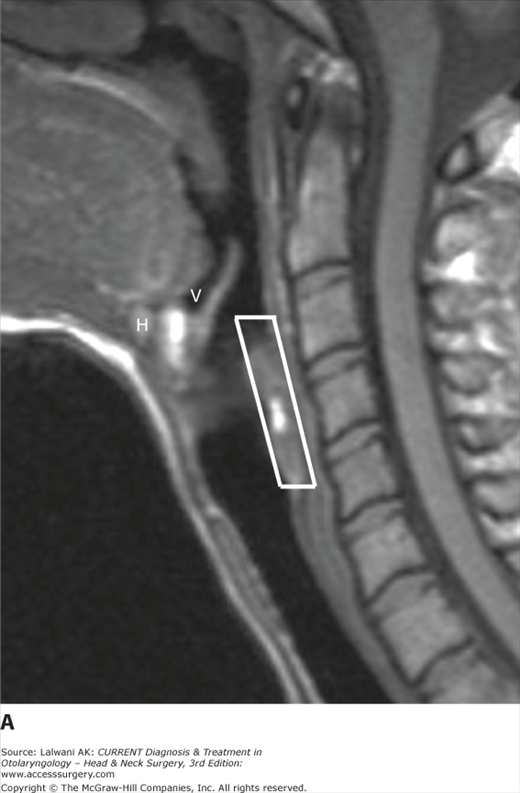
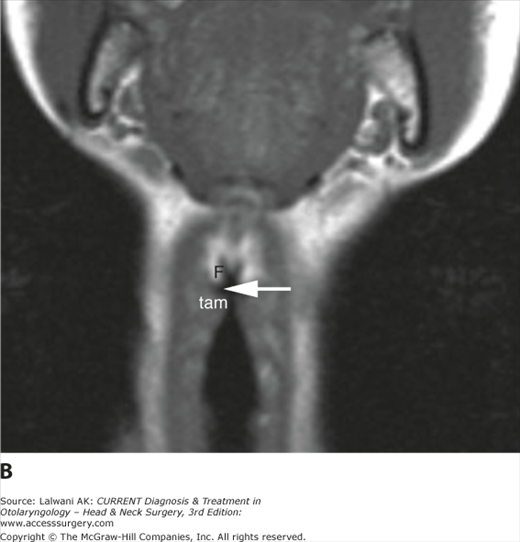
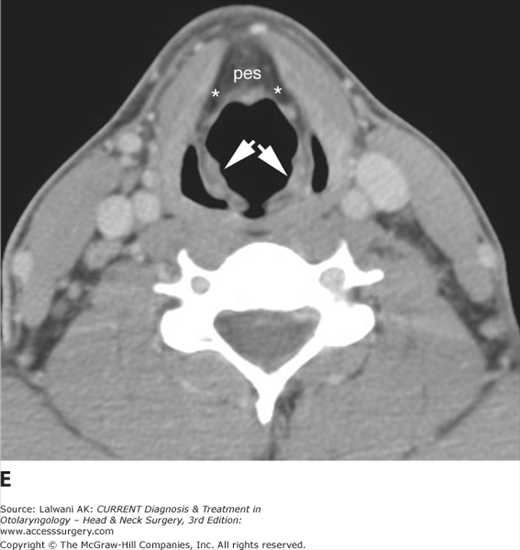
Figure 3–38.


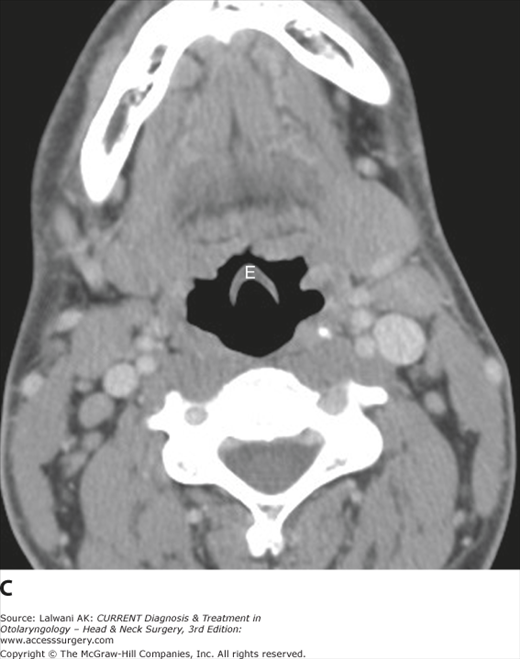
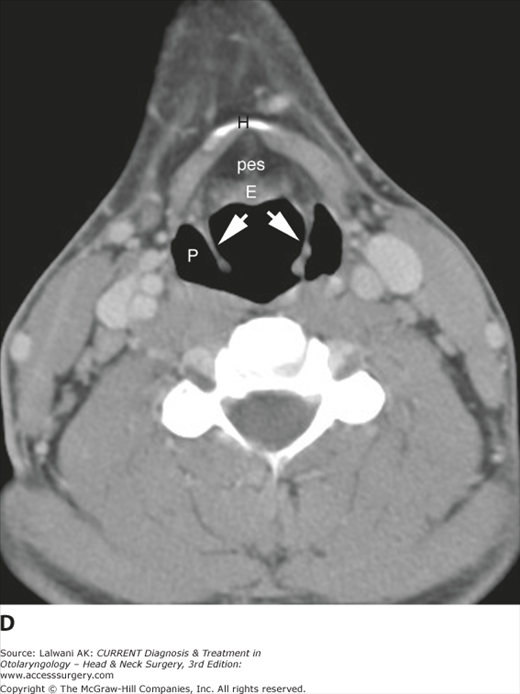

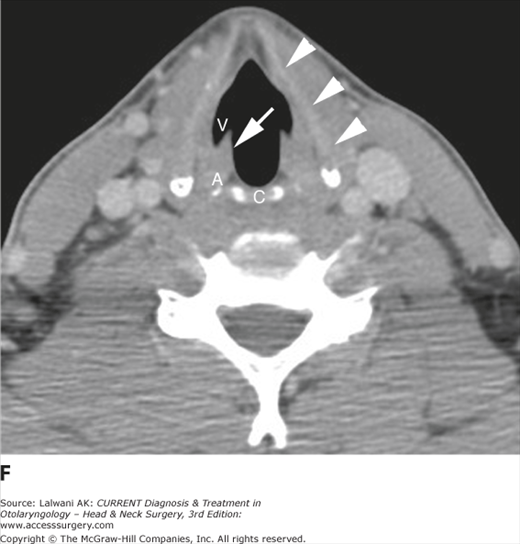
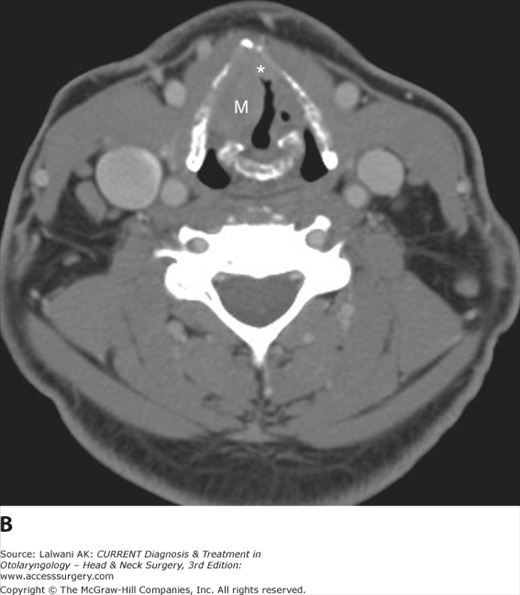
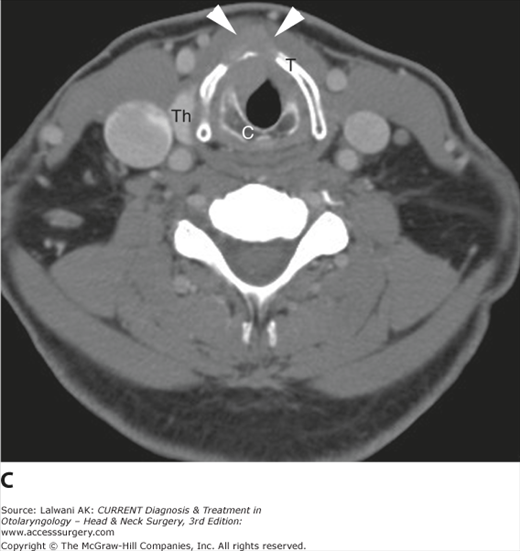
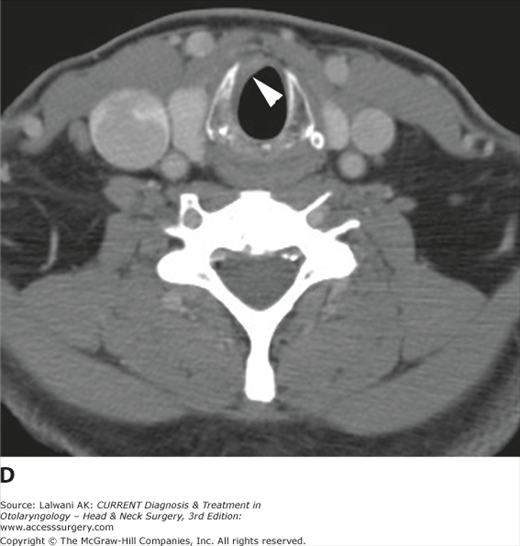
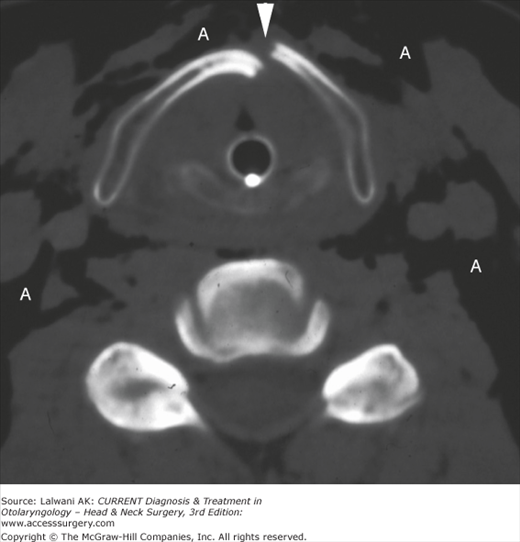
(A) A slightly oblique sagittal T1-weighted image demonstrates the vocal ligaments (white arrows) stretching from the vocal process of the arytenoid (A) to the anterior thyroid cartilage. Also indicated are the cricoid cartilage (C), epiglottis (E), preepiglottic space (pes), vallecula (V), and hyoid bone (H). (B) Coronal Tl-weighted image demonstrates the thyroarytenoid muscle (tam) at the level of the true vocal cord, the laryngeal ventricle (arrow), and the fatty paraglottic space at the level of the false vocal cord (F). (C) Axial CT scan through the supraglottis shows the free margin of the epiglottis (E). (D) A slightly lower scan through the supraglottis demonstrates the fixed portion of the epiglottis (E), preepiglottic space (pes), aryepiglottic folds (white arrows), hyoid bone (H), and pyriform sinuses (P). (E) A slightly lower scan shows the anterior preepiglottic space (pes) merging imperceptibly with the lateral paraglottic spaces (*). The aryepiglottic folds are indicated (white arrows). (F) Axial CT scan at the glottic level shows the true vocal cord (white arrow) and the laryngeal ventricle (V). In this young patient, the arytenoid cartilage (A), cricoid cartilage (C), and thyroid cartilage (white arrowheads) are largely nonossified and therefore poorly seen.


The laryngeal cartilages include thyroid, cricoid, and arytenoid cartilages. The thyroid cartilage is composed of two anterior laminae that meet in the anterior midline. Posteriorly, the laminae elongate and form superior and inferior cornua; the superior cornua provide attachment to the thyrohyoid ligament, while the inferior cornua articulate medially with the cricoid cartilage and the cricothyroid joint. The cricoid cartilage is a complete ring that has a narrow arch anteriorly and a wide posterior lamina. The paired, pyramidal arytenoid cartilages sit atop the posterior cricoid lamina and provide attachment for the posterior margins of the vocal cords at the level of the vocal processes. The laryngeal cartilages progressively calcify and eventually ossify with age; in children and young adults they are of soft tissue density on CT scanning.
Lesions that may be encountered on imaging studies of the larynx are listed in Table 3–4. SCC is the most common pathology of the larynx that requires an imaging assessment. Small lesions may not require imaging assessment and may in fact not even be visible on imaging studies, but CT scanning or MRI is useful in staging larger lesions. Involvement of preepiglottic and paraglottic spaces is well assessed on CT and MR scans, as is subglottic extension (Figure 3–39). Involvement of the laryngeal cartilages, notably the thyroid cartilage, may not be appreciated clinically but can be identified on imaging studies and has significant implications for therapy. MRI is more sensitive than CT scanning to neoplastic infiltration of the laryngeal cartilages, although neither technique is entirely reliable for detecting subtle invasion and both techniques may lead to overinterpretation of reactive changes as neoplastic infiltration. CT scanning or MRI is also useful in staging the neck, and both can detect pathologic lymphadenopathy that may be missed by clinical palpation.
| Neoplastic | ||||
|---|---|---|---|---|
| Congenital/Developmental | Traumatic | Functional | Mucosal | Cartilaginous |
| Hemangioma | Hematoma | Laryngocele | Squamous cell carcinoma | Chondroma |
| Venolymphatic malformation | Fracture of laryngeal cartilage | Chondrosarcoma | ||
| Metastatic disease | ||||
Figure 3–39.
Serial axial contrast-enhanced CT images in an older man with transglottic squamous cell carcinoma with cartilage erosion. (A) Image through the supraglottis demonstrates a mass (M) involving the right paraglottic space and aryepiglottic fold. Normal fatty left paraglottic space (*) and aryepiglottic fold (white arrow) are indicated. (B) At the glottic level, the right true vocal cord is grossly enlarged by the mass (M) and the soft tissue of the anterior commissure (*) is grossly thickened. The left true vocal cord is irregular, also a consequence of tumor infiltration. (C) At the level of the undersurface of the vocal cords, the lesion has eroded the ventral aspect of the thyroid cartilage (T; arrowheads indicate mass) and has extended anteriorly to invade the strap muscles. (D) At the subglottic level, asymmetric soft tissue is seen anteriorly (arrowhead), consistent with subglottic tumor extension. Note that at the subglottic level, the air column should appear to be immediately adjacent to the cricoid cartilage with no significant intervening soft tissue.
Lesions primary to the laryngeal cartilages are classically chondroid in nature—for example, chondroma and chondrosarcoma. These lesions are centered on the cartilage, usually the cricoid cartilage, and appear as submucosal masses on direct inspection. A calcified matrix is typically present on CT scans, and these lesions are usually extremely bright on T2-weighted MRI. Ossified laryngeal cartilages may also be involved with systemic malignant processes such as lymphoma, leukemia, multiple myeloma, and hematogenously disseminated metastases from any primary site.
Trauma to the larynx is usually assessed clinically and endoscopically, but imaging may be useful when fracture of the laryngeal cartilages or deep tissue injury is suspected. Blunt trauma to the anterior neck compresses the larynx against the cervical spine. The thyroid cartilage most commonly fractures along its anterior margin (Figure 3–40), whereas the cricoid ring, like any complete ring, tends to fracture in two or more places.
Figure 3–40.
Axial noncontrast CT scan viewed in bone window obtained in a young man who was kicked in the neck demonstrates a vertical fracture of the anterior thyroid cartilage (arrowhead). An endotracheal tube is in place and there is extensive air (A) tracking along fascial planes. A more inferior image (not shown) demonstrated bilateral fractures through the posterior cricoid ring.
The laryngocele results from functional obstruction (eg, increased intraglottic pressures) or true anatomic obstruction (eg, post-traumatic or postinflammatory stenosis, or neoplasm) of the laryngeal ventricle or its more distal saccule. The laryngocele may be filled with air, fluid, or pus and may be internal or external. The internal laryngocele is identified in the paraglottic space and can be followed to the level of the laryngeal ventricle. The external laryngocele has both an internal component, which may be completely collapsed, and an external component, which has penetrated the thyrohyoid membrane and often presents as an anterolateral neck mass (Figure 3–41).
Figure 3–41.
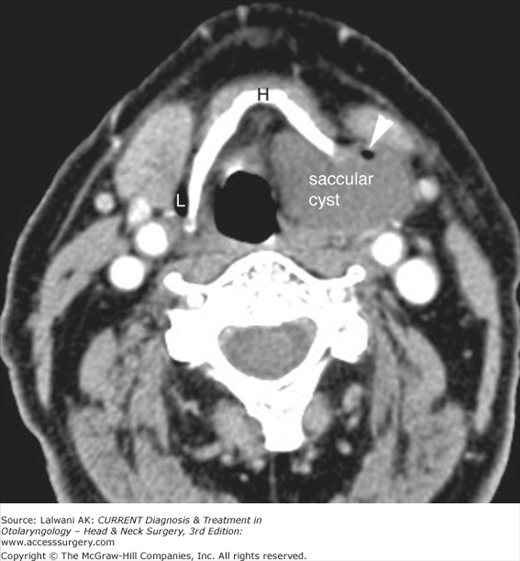
Axial contrast-enhanced CT scan through the supraglottic larynx demonstrates a fluid-filled laryngocele (saccular) cyst protruding through the thyrohyoid membrane and demonstrating both internal and external components. A small focus of air in the cyst (arrowhead) is related to a recent aspiration. The hyoid bone (H) has been remodeled. A small air-filled external laryngocele (L) is seen on the contralateral side.
Hoarseness is a relatively common indication for laryngeal imaging. In the absence of a mass lesion, attention should be focused on the course of the vagus nerve (CN X). When hoarseness is present along with other symptoms of lower cranial nerve dysfunction, then MRI is the study of choice to assess for a lesion of the skull base or carotid sheath (Figure 3–42). When hoarseness is the only symptom, then CT imaging is preferred, from the skull base to the aorticopulmonary window, to assess for any anatomic abnormality or mass lesion that could affect the recurrent laryngeal nerve along its course (Figure 3–43). The normal true vocal cords are symmetrically abducted during quiet respiration, whereas the Valsalva maneuver adducts the vocal cords to an opposed, midline position. In the setting of vocal cord paralysis, the paralyzed cord is usually fixed in a paramedian position, the ipsilateral aryepiglottic fold deviates medially, the ipsilateral pyriform sinus is dilated, and the laryngeal ventricle is often patulous (Figure 3–44). Denervation atrophy of the laryngeal musculature may also be identified.
Figure 3–42.
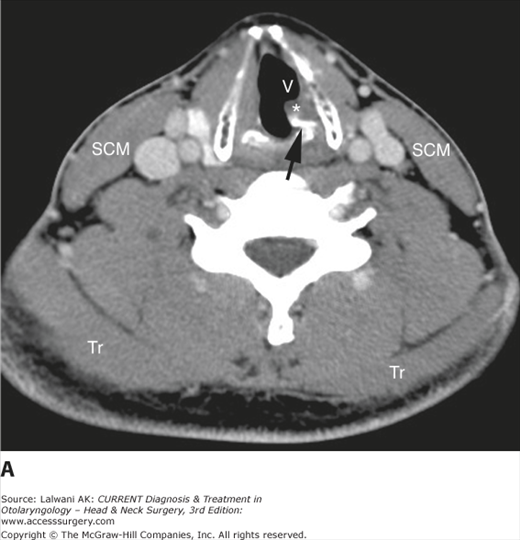
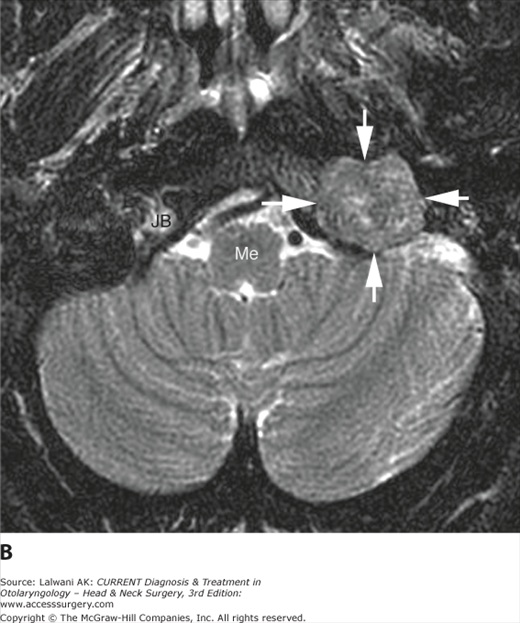
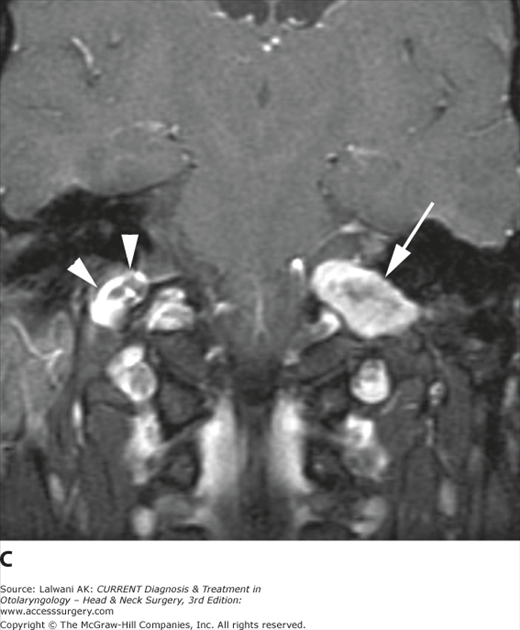
(A) Axial contrast-enhanced CT scan of the neck in a young man with hoarseness and left vocal cord paralysis on examination. The arytenoid (black arrow) is rotated medially, the left true vocal cord and thyroarytenoid muscle (*) show fatty atrophy compared with the contralateral side, and the left laryngeal ventricle (V) is dilated, all of which are imaging features of vocal cord paralysis. In addition, the left sternocleidomastoid (SCM) and trapezius (Tr) muscles are decreased in bulk compared with the right, suggesting also dysfunction of CN XI, although this had not been noted on clinical examination. The patient was then referred for MRI to assess for a skull base lesion. (B) An axial fast spin-echo T2-weighted image with fat saturation demonstrates a well-circumscribed soft tissue mass (white arrows) at the level of the left jugular foramen. The right jugular bulb (JB) and the medulla (Me) are indicated. (C) On a postgadolinium T1-weighted image with fat saturation, the lesion (white arrow) demonstrates slightly heterogeneous but mostly intense enhancement. The diagnosis is a lower cranial nerve schwannoma. The contralateral enhancing jugular bulb (white arrowheads) is also indicated. Note that the normal jugular bulb is a “pseudomass” that can be mistaken for significant pathology.
Figure 3–43.
(A) Axial contrast-enhanced CT scan of the neck in a middle-aged woman with breast cancer and new hoarseness demonstrates a patulous right laryngeal ventricle (V) and vocal cord asymmetry consistent with a right cord paralysis. No laryngeal mass is seen. However, a metastatic node (N) is incidentally noted. (B) An image through the supraclavicular fossa demonstrates a metastatic nodal mass that is impinging on the course of the right recurrent laryngeal nerve.
Figure 3–44.
(A) Axial contrast-enhanced CT scan in a patient with a left true vocal cord paralysis demonstrates dilatation of the ipsilateral pyriform sinus (P) and medial deviation of the aryepiglottic fold (arrow). (B) A more inferior image demonstrates asymmetric enlargement of the ipsilateral laryngeal ventricle (V) and denervation change with fatty atrophy of the thyroarytenoid muscle (*). (C) Coronal T1-weighted image in a different patient with right vocal cord paralysis demonstrates dilatation of the right laryngeal ventricle (V) compared with the left.
- CT imaging is the study of choice for nonmalignant disease of the larynx (eg, trauma or laryngocele); MRI more sensitively assesses cartilage invasion and more accurately delineates the transglottic spread of tumor. However, MRI of the larynx is often compromised by patient motion; therefore, thin-section contrast-enhanced CT scanning may actually provide better depiction of the extent of disease in the majority of patients.
- The subsites of the hypopharynx are often confused with those of the larynx. It is important to distinguish among them, as SCCs in these areas behave differently.
- The paraglottic and preepiglottic spaces are fat-filled compartments that are not separated from each other by fascia, so tumor can easily spread from one space to another.
- Imaging studies of the larynx in a patient with laryngeal carcinoma should always be assessed for preepiglottic and paraglottic space involvement, as well as for the status of the laryngeal cartilages, because these areas cannot be staged clinically except in far-advanced disease.
- New hoarseness in a patient with a history of head and neck cancer should prompt careful evaluation of the course of CN X (the vagus nerve) to look for tumor recurrence and spread along the carotid sheath and to the skull base.
- It is generally best to perform imaging of the larynx in quiet respiration, during which the true vocal cords are in their relaxed, abducted state. If indicated, the scan can be repeated during a maneuver such as the Valsalva maneuver to assess for paralysis or mechanical fixation.
- The thickness of soft tissue in the anterior commissure may be as much as 2 mm in patients without disease.
- The mucosal surface of the subglottis is so closely applied to the cricoid cartilage that it is generally not appreciable on the airway side of the subglottic larynx. Visible soft tissue at this level should suggest the possible presence of tumor extension.
- A submucosal tumor of the larynx most commonly represents a chondrosarcoma or a metastatic lesion.
- In the presence of a laryngocele, the larynx should be carefully assessed clinically and radiographically for the presence of a neoplasm. Even large tumors may initially present with a neck mass secondary to a laryngocele, rather than with complaints referable to the larynx (Figure 3–45).
- In the setting of trauma to the anterior neck, particularly severe blunt trauma, CT imaging is useful to assess for fracture of the laryngeal cartilages. Because it is a complete ring, the cricoid cartilage tends to fracture in two or more places.
Figure 3–45.
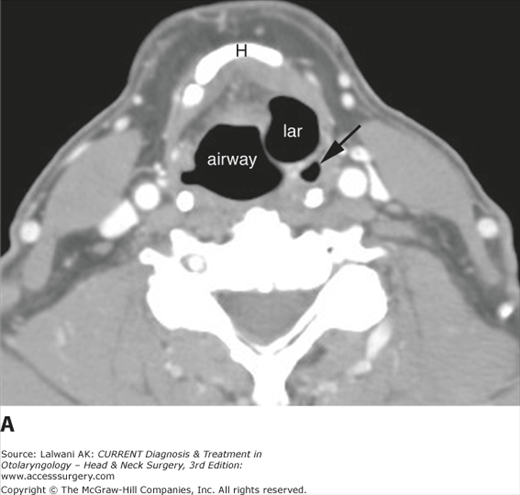
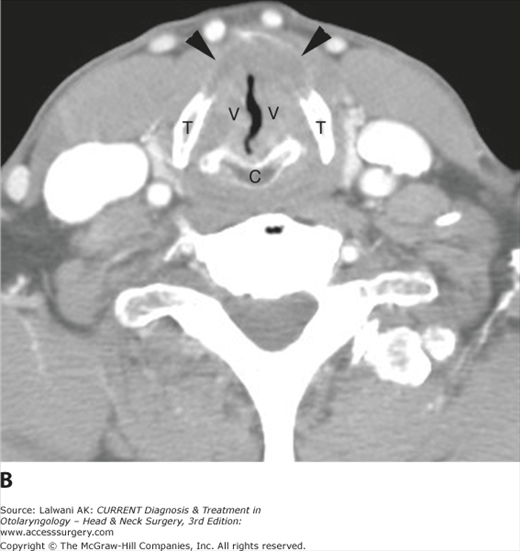
(A) Axial contrast-enhanced CT scan through the supraglottic larynx demonstrates an air-filled structure on the left consistent with an internal laryngocele (lar). The left pyriform sinus (black arrow) is displaced posteriorly. (B) A more inferior image demonstrates neoplastic infiltration of both vocal cords (V), which are irregularly thickened, as well as neoplastic erosion (black arrowheads) of the anterior thyroid cartilage (T). C, cricoid cartilage.
The cervical lymph nodes must always be carefully assessed in the setting of head and neck cancer, but cervical lymph nodes may also become involved by infectious, inflammatory, and granulomatous processes, as well as by systemic malignant neoplasms (eg, lymphoma or metastasis from primary sites other than the head and neck). Before discussing the normal appearance of the cervical lymph nodes on imaging studies and the differential diagnosis of nodal abnormalities, the appropriate terminology for the cervical lymph nodes is reviewed here. Over the last decade or so, clinical terminology has evolved from being anatomically based to a simpler classification based on levels. This classification has been translated into an imaging-based classification, which is summarized in Table 3–5 and Figure 3–46.
| Level & Subclassification | Boundaries | Previous Terminology |
|---|---|---|
| I | Above hyoid bone, below mylohyoid muscle, anterior to a transverse line drawn through the posterior edge of the SMG | Submental and submandibular nodes |
| IA | Between medial margins of anterior bellies of digastric muscles | Submental nodes |
| IB | Posterior and lateral to medial edge of anterior belly of digastric muscle, anterior to posterior edge of SMG | Submandibular nodes |
| II | From skull base to the lower body of the hyoid bone, anterior to the posterior edge of the SCM and posterior to the posterior edge of the SMG1 | Upper internal jugular and spinal accessory nodes |
| IIA | Lie anterior, lateral, or medial to the IJV, or lie posterior to the IJV and are inseparable from it | Upper internal jugular nodes |
| IIB | Lie posterior to the IJV and have a fat plane separating the nodes and the vein | Upper spinal accessory nodes |
| III | Between the lower body of the hyoid bone and the lower margin of the cricoid arch; anterior to the posterior edge of the SCM and lateral to the medial margin of the CCA or ICA | Mid-jugular nodes |
| IV | Between the lower margin of the cricoid cartilage arch and the level of the clavicle; anterior and medial to an oblique line drawn between the posterior edge of the SCM and the posterolateral edge of the anterior scalene muscle; lateral to the medial margin of the CCA | Low jugular nodes |
| V | From the skull base at the posterior border of the attachment of the SCM to the clavicle; anterior to the anterior edge of the trapezius muscle and posterior to the posterior edge of the SCM (skull base to bottom of cricoid), or posterior and lateral to an oblique line through the posterior edge of the SCM and the posterolateral edge of the anterior scalene muscle (bottom of cricoid to clavicle) | Posterior cervical |
| VA | From skull base superiorly to lower margin of cricoid cartilage inferiorly | Upper posterior cervical |
| VB | From lower margin of cricoid cartilage to level of clavicle | Lower posterior cervical |
| VI | Inferior to body of hyoid, superior to top of manubrium, and between the medial margins of the ICAs or CCAs | Visceral nodes |
| VII | Caudal to the top of the manubrium in the superior mediastinum, between the medial margins of the left and right common carotid arteries and superior to the innominate vein | Superior mediastinal |
Figure 3–46.
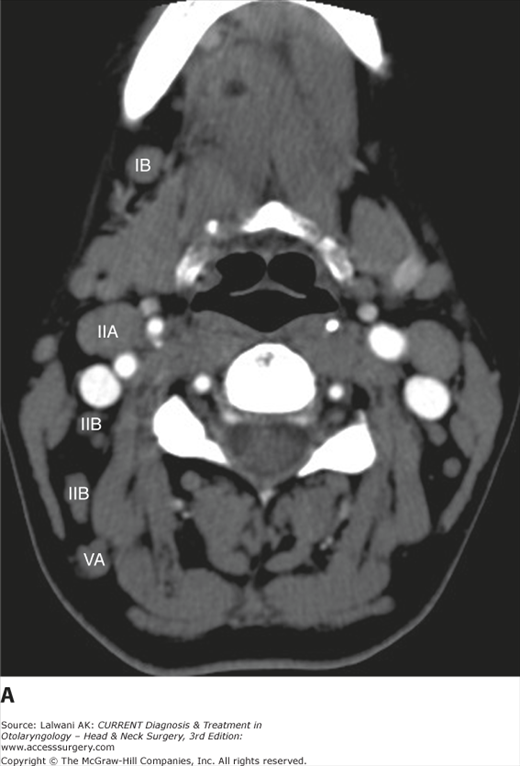
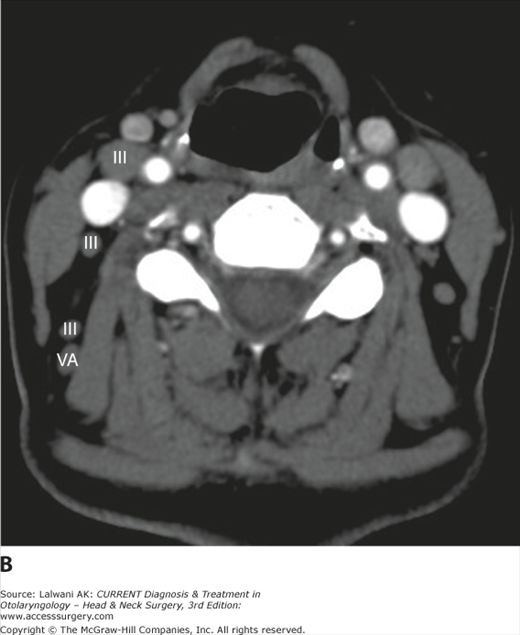
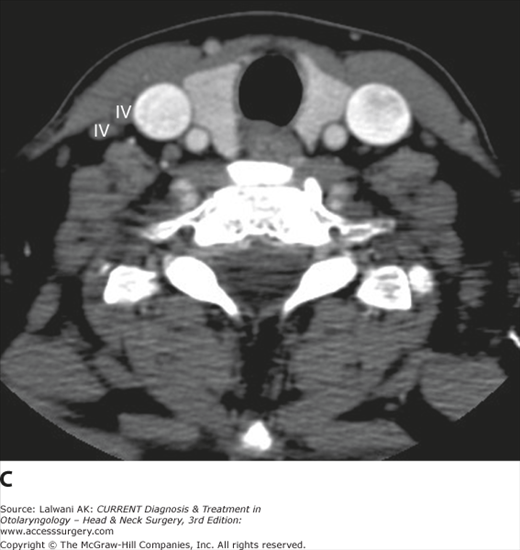
(A, B, and C) Serial contrast-enhanced axial CT scans through the neck demonstrate the image-based nodal classification system summarized in Table 3–5. Nodes in each of the five levels commonly involved by head and neck cancer are labeled.
Some nodal groups are not included in this classification scheme, notably the retropharyngeal nodes, parotid nodes, the pre- and postauricular nodes, the facial nodes, and the suboccipital nodes. These nodes are still referred to by their anatomic names. Although these nodes may certainly be involved by neoplastic and nonneoplastic processes, they do not represent the most common sites of lymphatic spread for SCC of the upper aerodigestive tract and are not included in the level classification scheme.
On noncontrast CT scans, normal lymph nodes are ovoid, homogeneous soft tissue masses with a short-axis diameter of 5–10 mm (Figure 3–47). A fatty hilum may be recognizable as an eccentric area of low density. Pathologic lymph nodes may be enlarged and focally or diffusely hypodense if there is cyst formation or necrosis. Necrotic lymphadenopathy may be seen with SCC, treated lymphoma, and other neoplastic processes, but it may also be seen with mycobacterial infection, cat-scratch disease, and other infectious processes (Figure 3–48).
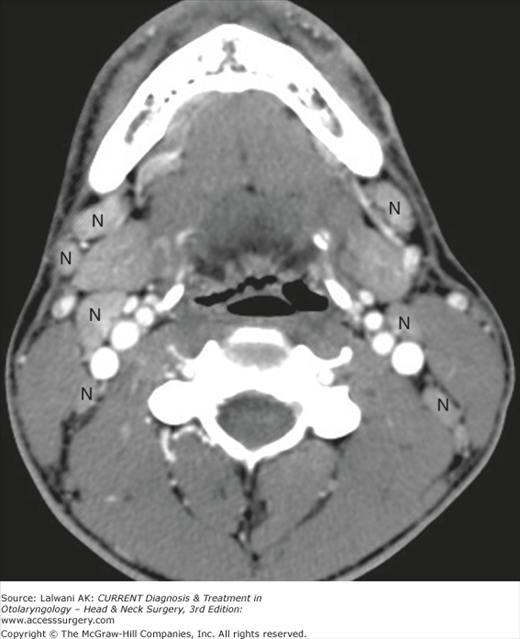
Figure 3–48.
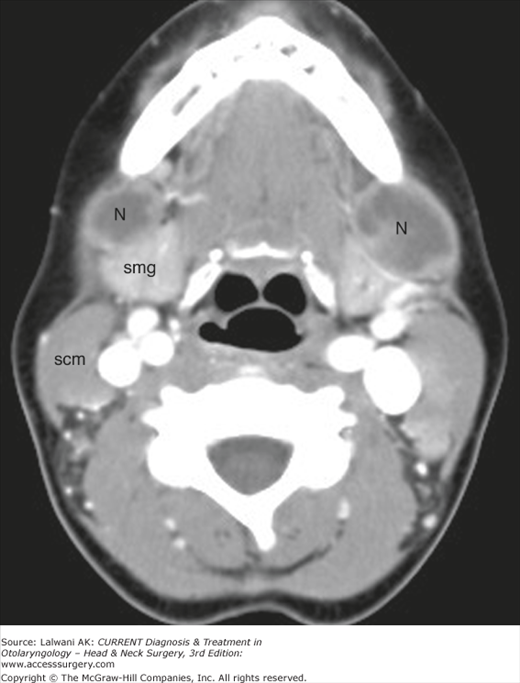
Axial contrast-enhanced CT scan of the neck in a young immunosuppressed woman demonstrates large, centrally necrotic lymph nodes (N) anterior to the submandibular glands (smg) anteriorly. Needle aspiration and culture were consistent with cat-scratch disease; scm, sternocleidomastoid muscle.
Suppurative lymphadenopathy also leads to central hypodensity. In some circumstances, a lymph node may appear hyperdense before contrast administration, usually owing to partial or complete calcification (eg, old granulomatous disease, metastatic tumoral calcification, or irradiated metastatic nodes). After contrast administration, normal lymph nodes show moderate homogeneous enhancement. Areas of cyst formation or necrosis appear hypodense and are more easily appreciated than on the noncontrast scan. In some cases, a focus of tumor may appear hyperdense to normal nodal tissue after contrast administration. This is most commonly seen with vascular metastases from thyroid or renal cell carcinoma but may also be seen with inflammatory processes. If extracapsular spread of tumor has occurred, then the node will have a poorly defined border and an irregular margin with surrounding soft tissue structures.
On MRI, normal lymph nodes are intermediate in signal intensity on T1-weighted images and hyperintense to muscle on T2-weighted images, and they show mild or moderate homogeneous enhancement postgadolinium (Figure 3–49). Fat may be identified at the nodal hilum. If a lymph node shows high signal intensity on a T1-weighted image before the administration of gadolinium, then metastatic thyroid cancer and metastatic melanoma should be considered. A cystic-appearing node may be due to infection or to tumor and will be of low signal intensity on T1-weighted images and of high signal intensity on T2-weighted images, and will show smooth peripheral enhancement postgadolinium. The neoplasms that typically result in cystic nodal metastases are SCC and thyroid carcinoma, but many primary cancers may lead to cystic-appearing nodal disease. A potential pitfall is that a single cystic metastasis may be mistaken for a benign process such as a branchial cleft cyst. Nodal necrosis due to metastatic cancer usually leads to a thick, irregular, enhancing wall and central nonenhancement. In a patient with known head and neck cancer, the presence of necrotic lymphadenopathy is considered to represent metastatic disease. In some cases of metastatic SCC, areas of abnormally low signal intensity representing keratin pools are seen on T2-weighted images.
Figure 3–49.
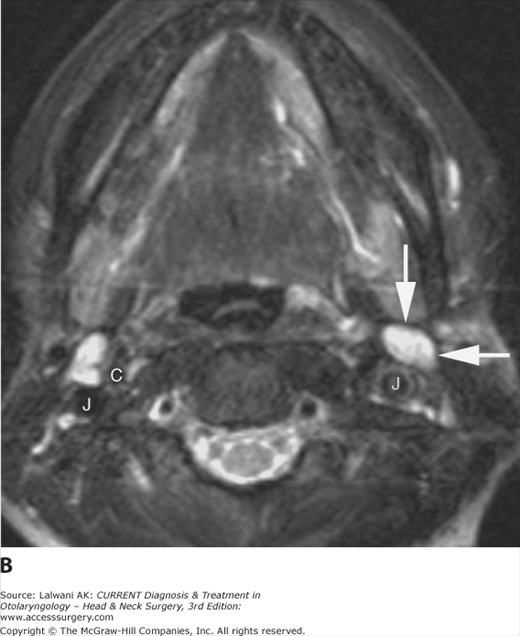
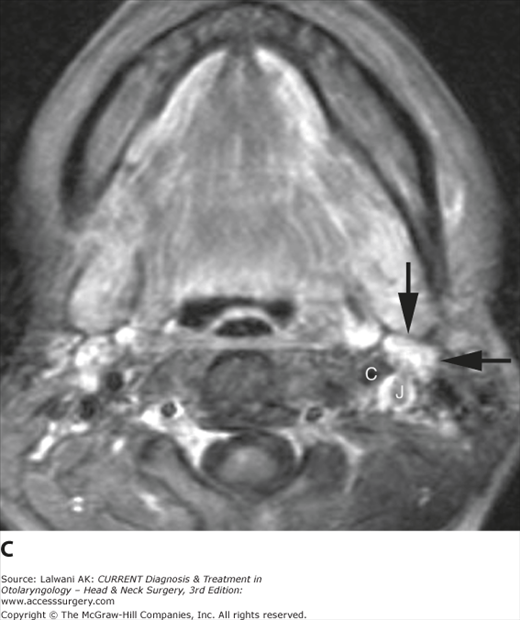
(A) Axial T1-weighted image through the neck of a young woman demonstrates a normal, left level IIA node (black arrows), which has a signal intensity similar to muscle. The carotid artery (C) and jugular vein (J) are indicated. (B) On an axial fast spin-echo T2-weighted image with fat saturation, the node is homogeneous and relatively high in signal intensity. (C) Postgadolinium, there is a mild and homogeneous enhancement of the lymph node on this slightly motion-degraded image.
The assessment of the cervical lymph nodes for metastatic involvement in patients with head and neck cancer is an important role for CT and MRI. Because a non-necrotic, apparently homogeneous node may still contain foci of tumor, size criteria have been developed for predicting the likelihood of metastatic nodal involvement. These criteria represent a trade-off between sensitivity and specificity, however, and depending on what cut-off is chosen for minimal axial diameter, there may be significant numbers of false-positive or false-negative nodes. The most widely accepted cut-off for reporting metastatic lymphadenopathy is a short-axis diameter ≥10 mm, but this yields a positive predictive value of only approximately 50% and a negative predictive value of approximately 80%. The development of metabolic and functional methods such as FDG PET and iron oxide–enhanced MR lymphography shows promise in improving lymph node staging, but these techniques have significant limitations in terms of their sensitivity to small foci of tumor, and the latter technique is not widely applied at present. Diffusion-weighted MRI is also gaining acceptance as a method for detecting metastatic lymph node involvement.
Nonmucosal Disease of the Head & Neck
The terminology used to describe the traditional pharyngeal subdivisions of the head and neck is best suited to the assessment and staging of SCC. Because nonsquamous masses tend to spread within fascia-defined spaces, the head and neck can also be viewed as a series of deep spaces, an approach that facilitates an analysis of cross-sectional imaging of the head and neck. To simplify the discussion, the extracranial head and neck are divided into supra- and infrahyoid compartments because fascial attachments to the hyoid bone functionally cleave this region into two segments.
The spaces of the suprahyoid head and neck are defined by the three layers of the deep cervical fascia: superficial (investing), middle (buccopharyngeal), and deep (prevertebral). The spaces defined by these three fascial layers are shown diagrammatically in Figure 3–50.
Figure 3–50.
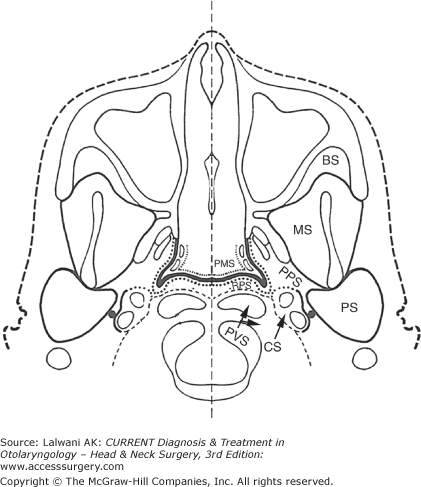
Diagrammatic representation of the fascia-defined spaces of the suprahyoid neck at the level of the nasopharynx. The dashed line represents the deep layer of deep cervical fascia, also known as the prevertebral fascia. The dotted line represents the middle layer of deep cervical fascia, and the thick solid line represents the superficial layer of deep cervical fascia, also known as the investing fascia. The heavy solid line outlining the pharyngeal mucosal space represents the pharyngobasilar fascia, which connects the superior constrictor muscle to the skull base. PMS, pharyngeal mucosal space; PPS, parapharyngeal space; MS, masticator space; PS, parotid space; CS, carotid space; RPS, retropharyngeal space; PVS, perivertebral space; BS, buccal space. (Note that the buccal space does not represent a true fascia-defined space, but is often considered as a distinct space for the purposes of anatomic localization and differential diagnosis.) (Modified and reproduced, with permission, from Harnsberger HR. CT and MRI of masses of the deep face. Curr Probl Diagn Radiol 1987;16:141.)
The pharyngeal mucosal space has complex fascial margins and is not completely circumscribed by the three layers of deep cervical fascia. This space is bounded by the middle layer of deep cervical fascia along its posterolateral margin, whereas on its luminal or airway side, it has no fascial boundary. The most important components of the pharyngeal mucosal space are the squamous mucosa, the lymphoid tissue of the Waldeyer ring, the minor salivary glands, and the pharyngeal constrictor muscles. The dominant pathology in this space is SCC and the pharyngeal mucosal space, divided into its traditional subdivisions of nasopharynx, oropharynx, and hypopharynx, was reviewed previously.
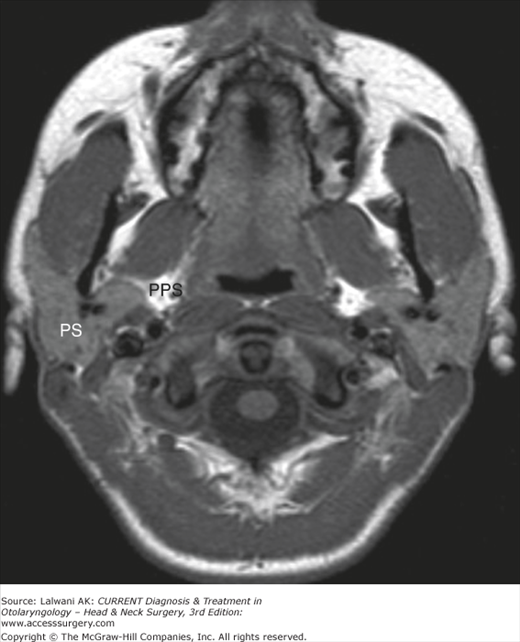
The parapharyngeal space (PPS) is a central, fat-filled space of the deep face that is frequently displaced by masses of the surrounding spaces (Figure 3–51). Assessing the center of a deep facial mass relative to the PPS and observing the direction in which this mass displaces the fat of this space indicates the space of origin of a mass of the head and neck and helps to tailor a differential diagnosis. The PPS is defined medially by the middle layer of the deep cervical fascia and borders the pharyngeal mucosal space. Laterally, it is defined by the superficial layer of deep cervical fascia and borders the masticator space and the parotid space. Posteriorly, the PPS is defined by the anterior part of the carotid sheath and is bordered by the carotid space. Superoinferiorly, it runs from the skull base to the hyoid bone. At its inferior extent, this space is not separated by fascia from the submandibular space, and so a process in one space may extend to the other.
The PPS contains only fat, arteries, veins, and nerves; therefore, few lesions are primary to this space. Primary lesions of the parapharyngeal space include lipomas, tumors of minor salivary rests, and atypical second branchial cleft cysts (Figure 3–52). Most lesions that appear to be primary to the PPS in fact originate from adjacent spaces and compress the PPS. Therefore, fat should be identified around the circumference of a lesion before it is said to be primary to the PPS, although peripheral fat may be difficult to identify if a lesion primary to the PPS is large. Aggressive processes that are not constrained by fascial boundaries may also involve the PPS by direct spread, notably SCC, other aggressive neoplasms (eg, sarcomas, malignant neoplasms of the salivary glands, and lymphoma; Figure 3–53), and phlegmon or abscess.
Figure 3–52.
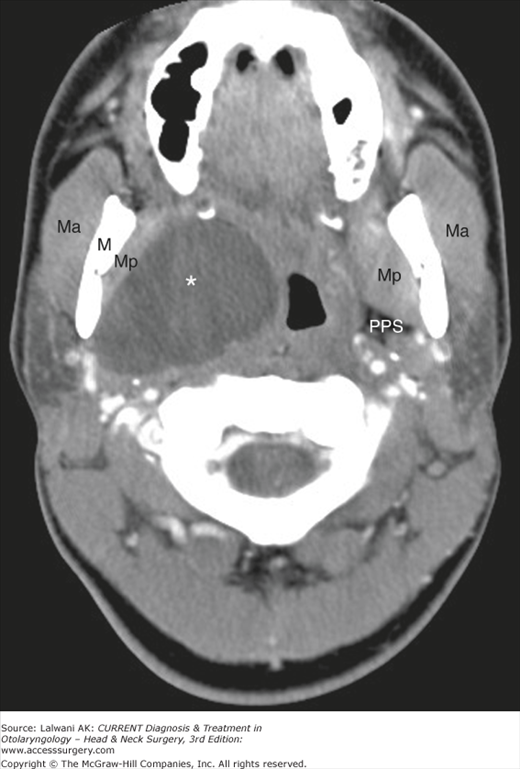
Axial contrast-enhanced CT scan demonstrates a well-circumscribed cystic lesion (*) centered on the right parapharyngeal space, deviating the airway and the pharyngeal mucosal space medially and displacing the muscles of mastication laterally. The normal left parapharyngeal space is indicated. The pathology was most consistent with a branchial cleft cyst. Ma, masseter; M, mandible; Mp, medial pterygoid; PPS, parapharyngeal space.
Figure 3–53.
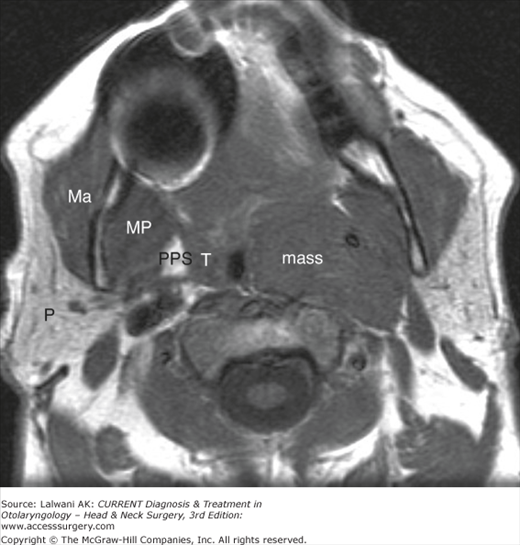
Axial T1-weighted image in a patient with lymphoma demonstrates a left oropharyngeal mass with lateral extension to obliterate the parapharyngeal fat. The normal right tonsil (T) and right parapharyngeal space (PPS) are shown for comparison. Masseter (Ma), medial pterygoid muscle (MP), and parotid gland (P) are indicated.
The parotid space is defined by a splitting of the superficial layer of the deep cervical fascia. It abuts the masticator space anteriorly, the PPS anteromedially, the carotid space posteromedially, the temporal bone posteriorly and superiorly, and the subcutaneous fat laterally (see Figure 3–51). Its contents include the parotid gland, the facial nerve, blood vessels, and the intraparotid lymph nodes. Although the intraparotid facial nerve cannot be directly identified on cross-sectional imaging studies, it is known to lie adjacent to the retromandibular vein, and this structure serves as a rough dividing point between the superficial and deep lobes of the gland. When a mass involves both the superficial and deep lobes, the distance between the mandible and the styloid process is typically widened, especially if the mass is slow growing. The parotid duct exits the anterior aspect of the parotid space, traverses the masticator space over the masseter muscle, and then pierces the buccinator muscle to enter the oral cavity at the level of the second maxillary molar.
A differential diagnosis of parotid space masses is presented in Table 3–6, and the imaging appearance of some of the more common pathologies is discussed in more detail below. It should also be noted that the presence of multiple parotid space lesions, either unilateral or bilateral, suggests a more limited differential diagnosis that includes reactive or metastatic lymphadenopathy, lymphoepithelial lesions, Warthin tumors, and recurrent pleomorphic adenoma.
| Neoplastic | |||
|---|---|---|---|
| Congenital/Developmental | Inflammatory/Infectious | Benign | Malignant |
| Hemangioma | Parotitis or parotid abscess | Pleomorphic adenoma | Mucoepidermoid carcinoma |
| Venolymphatic malformation | Reactive lymphadenopathy | Warthin tumor | Adenoid cystic carcinoma |
| First branchial cleft cyst | Lymphoepithelial cysts or lesions | Lipoma | Acinic cell carcinoma |
| Facial nerve schwannoma | Carcinoma ex pleomorphic adenoma | ||
| Oncocytoma | Salivary ductal carcinoma | ||
| Squamous cell carcinoma | |||
| Extranodal or nodal non-Hodgkin lymphoma | |||
| Nodal metastases | |||
The parotid hemangioma is a vascular proliferative mass of infancy and childhood that may grow to a large size and replace the entire parotid gland before slowly involuting. The classic imaging appearance is of a multilobulated holoparotid mass that enlarges the parotid gland, is isointense to muscle on a T1-weighted image, is bright on a T2-weighted image, and enhances intensely and homogeneously postgadolinium (Figure 3–54). It usually contains prominent flow voids, and the external carotid artery and its branches are often enlarged.
Figure 3–54.
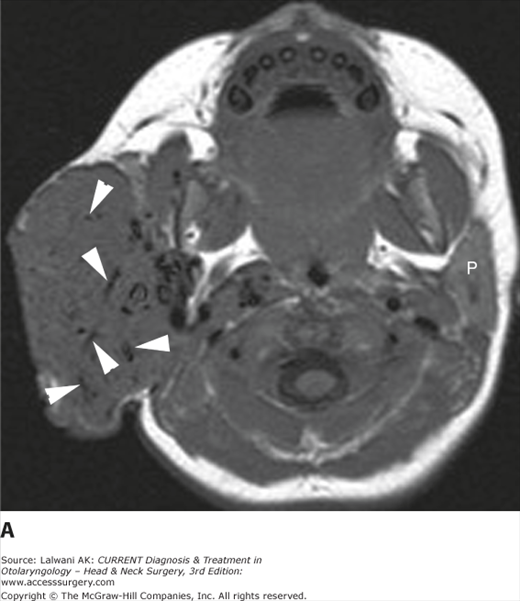
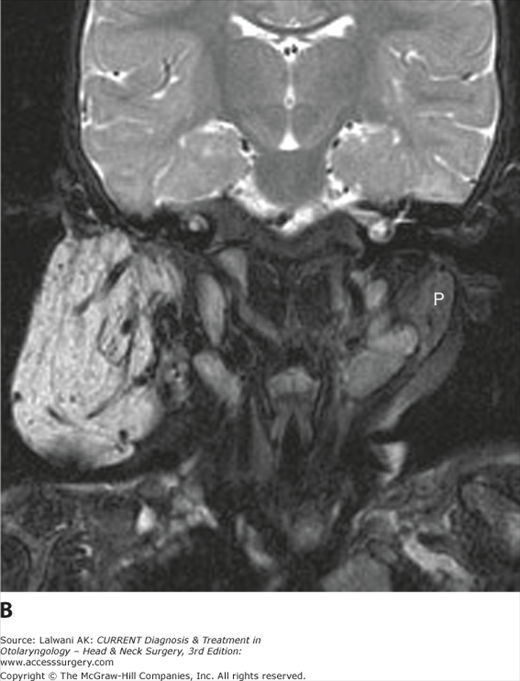
(A) Axial T1-weighted image in a 13-month-old female with a parotid region mass and overlying skin discoloration demonstrates a large, multilobulated, well-circumscribed mass centered on the parotid gland. Internal serpiginous hypointensities (arrowheads) are consistent with vessels. The contralateral parotid gland (P) is shown for comparison; note that the parotid gland in an infant and young child is not as fatty as in an adult and therefore not as bright on a T1-weighted image. (B) The mass is high in signal intensity on a T2-weighted image. Again, note the prominent vessels within the lesion. Postgadolinium (not shown), the lesion demonstrated intense and homogeneous enhancement. These imaging features are diagnostic of a parotid hemangioma.
Abnormalities of the first branchial apparatus account for less than 10% of branchial complex anomalies and include cysts, sinuses, and fistulas. Typically, a cystic mass is seen within or adjacent to the parotid gland (Figure 3–55), with a tract leading to the external auditory canal visible in some cases. The cyst wall may be thickened if there has been prior infection, and adjacent soft tissues may show inflammatory change if there is active infection.
Figure 3–55.
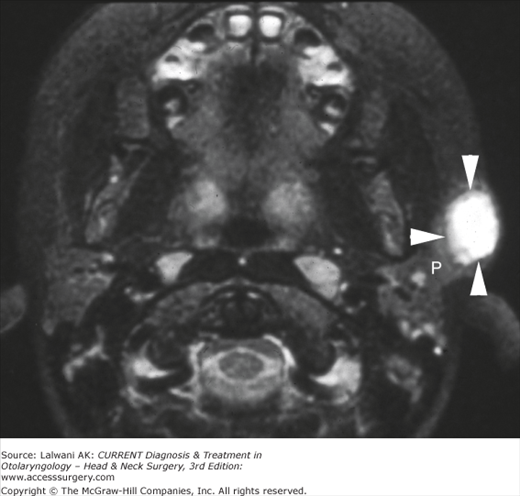
A 3-year-old girl with a left parotidregion mass and slight drainage from her external ear canal. Axial fast spin-echo T2-weighted image with fat saturation demonstrates a well-circumscribed, very high signal intensity mass (arrowheads) in the left parotid gland (P). Other images (not shown) confirmed the cystic nature of the lesion and a first branchial cleft cyst was found at surgery.
Benign lymphoepithelial lesions are seen most commonly in association with HIV, but they also occur in connective tissue disorders, notably Sjögren syndrome. In the setting of HIV, there is typically associated hypertrophy of the lymphoid tissue of Waldeyer ring (Figure 3–56) and also reactive cervical lymphadenopathy. Lesions may be purely cystic or have both cystic and solid elements, and they are typically bilateral.
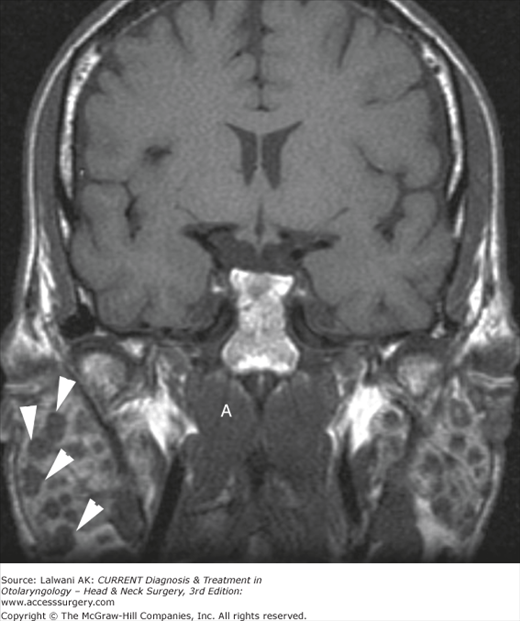
Glandular enlargement, edema, and increased enhancement are seen in the setting of acute parotitis, often with inflammatory changes in adjacent fat (Figure 3–57). If the process progresses to abscess formation, a ring-enhancing mass will be present. A calculus may be identified along the parotid duct or within the gland, best detected on thin-section (1–3 mm) noncontrast CT images. The intra- or extraparotid glandular system may be dilated.
Figure 3–57.
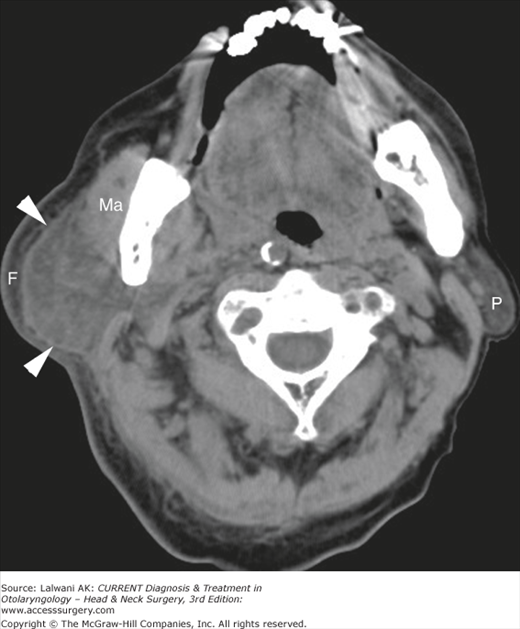
Contrast-enhanced CT scan of the neck in a patient with clinical acute parotitis demonstrates marked enlargement and irregular enhancement of the left parotid gland as compared to the right (P, parotid glands); there is also enlargement of the ipsilateral masseter muscle as compared to the contralateral masseter muscle (Ma, masseter muscles) due to inflammatory myositis. Infiltration of the overlying subcutaneous fat on the left is due to associated cellulitis (thin white arrows show subcutaneous fat of the fact); there is also stranding and infiltration of fat in the left parapharyngeal space as compared with the right (large white arrows indicate parapharyngeal spaces). No calculi were identified, and no abscess was present. The patient responded to intravenous antibiotic therapy.
The pleomorphic adenoma typically presents as a round or ovoid, well-circumscribed soft tissue mass. It may have areas of low density on CT and is typically high signal intensity on T2-weighted MRI caused by areas of mucoid matrix or cystic degeneration (Figure 3–58). Contrast enhancement is usually intense and homogeneous, and the homogeneity typically increases over time when early and delayed postcontrast CT images are compared.
Figure 3–58.
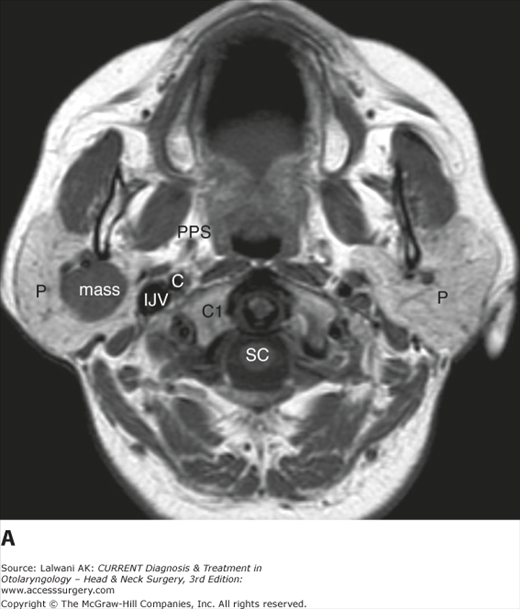
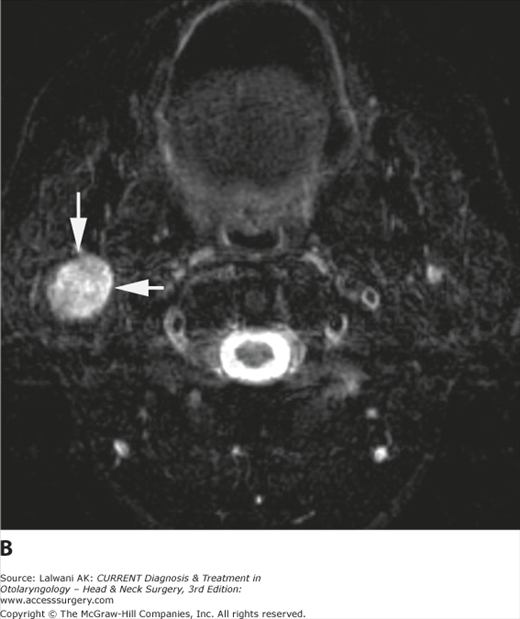
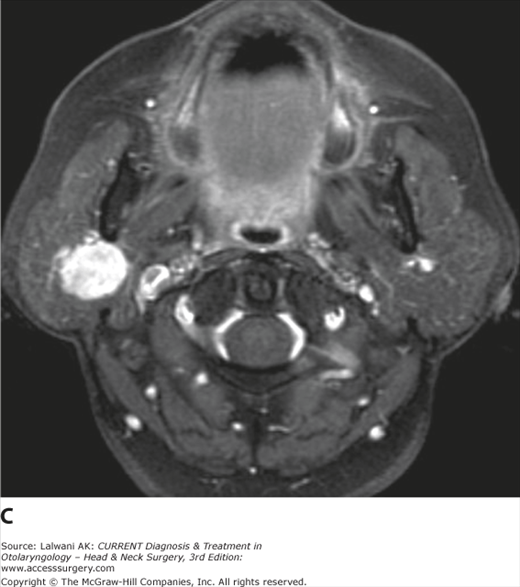
(A) Axial T1-weighted image in a young patient with a slowly enlarging right parotid mass shows a round, well-circumscribed lesion of intermediate signal intensity. Also indicated are the parotid glands (P), parapharyngeal space (PPS), internal jugular vein (IJV), internal carotid artery (C), lateral mass of C1 (C1), and the spinal cord (SC). (B) The mass is very bright on a fast spin-echo T2-weighted image with fat saturation. (C) Following gadolinium, the lesion enhances intensely and homogeneously. These are the typical imaging features of a pleomorphic adenoma and this diagnosis was confirmed pathologically.
A Warthin tumor is typically multilobulated, well circumscribed, and heterogeneous owing to its mixed cystic and solid nature (Figure 3–59). Areas of hemorrhage may be seen as well, and bilateral lesions are not uncommon.
Figure 3–59.
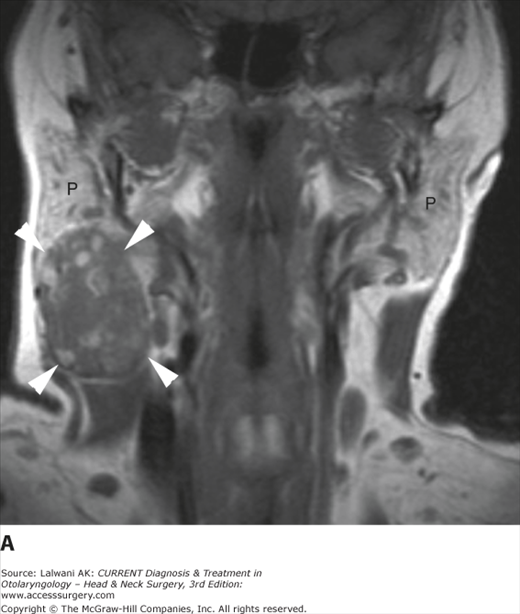
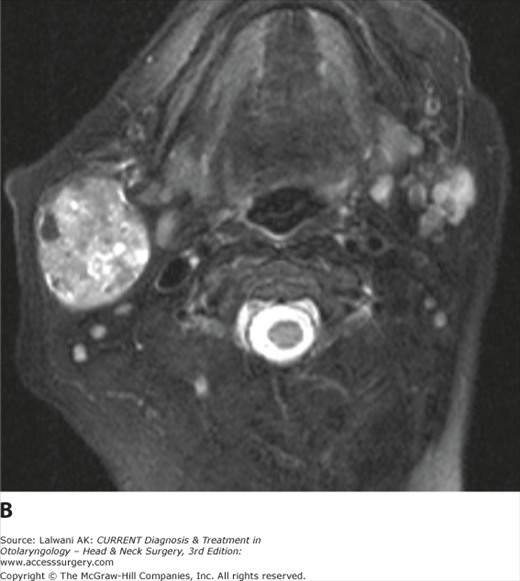
(A) Coronal Tl-weighted image in a 55-year-old woman with a mass (arrowheads) arising from the inferior aspect of the right parotid gland (P). The lesion is well circumscribed but quite heterogeneous, with internal areas of high signal intensity representing areas of hemorrhage or proteinaceous cysts. (B) The lesion is hyperintense on an axial fast spin-echo T2-weighted image with fat saturation, but also somewhat heterogeneous. The heterogeneity of the lesion and the areas of intrinsic T1 shortening are suggestive of a Warthin tumor, which was confirmed pathologically.
A low-grade malignant parotid tumor may appear well circumscribed and homogeneous and, based on imaging criteria, can be difficult to distinguish from a benign lesion such as a pleomorphic adenoma. Malignant tumors do, however, tend to be somewhat lower in signal intensity on T2-weighted images than benign lesions. Higher-grade lesions are often ill marginated (Figure 3–60) and invade adjacent structures such as the temporal bone, adjacent fat, and the muscles of mastication. They may also demonstrate perineural spread proximally along the facial nerve (Figure 3–61). Note that a pregadolinium T1-weighted image may be the best sequence on which to identify a parotid mass as the fatty glandular parenchyma contrasts well with the intermediate signal intensity of most parotid neoplasms (Figure 3–62).
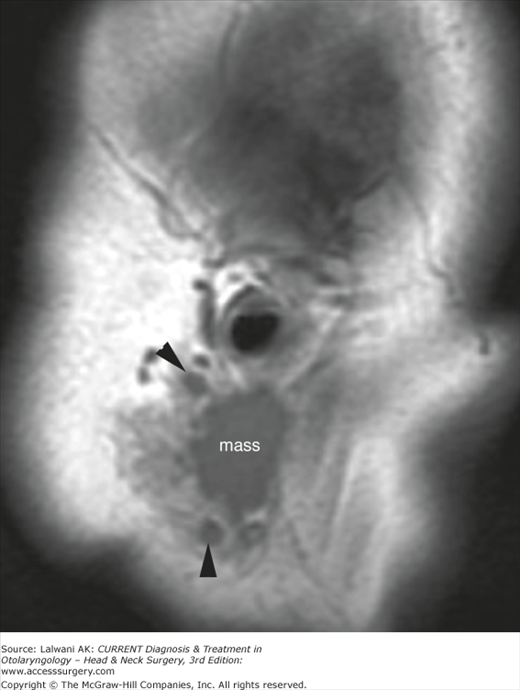
Figure 3–61.
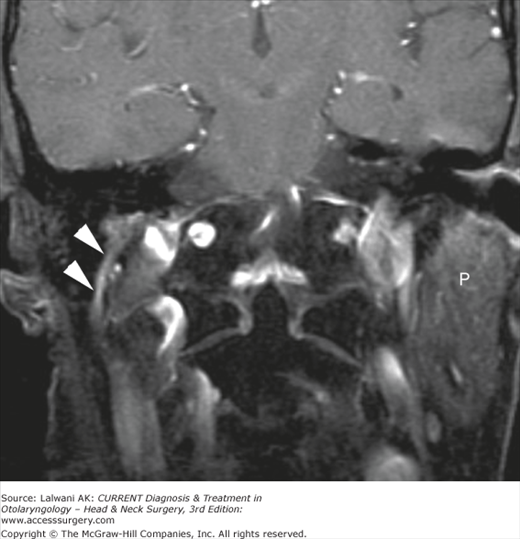
Coronal postgadolinium T1-weighted image with fat saturation in an older man who had undergone a prior right parotidectomy for carcinoma ex pleomorphic adenoma demonstrates abnormal thickening and intense enhancement of the descending mastoid segment of the right facial nerve (arrowheads), consistent with the perineural spread of disease. The normal left parotid gland (P) is indicated. The patient had a progressive right facial palsy.
Figure 3–62.
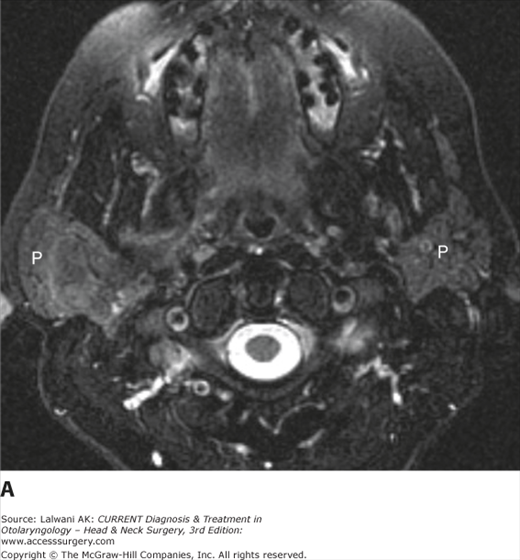
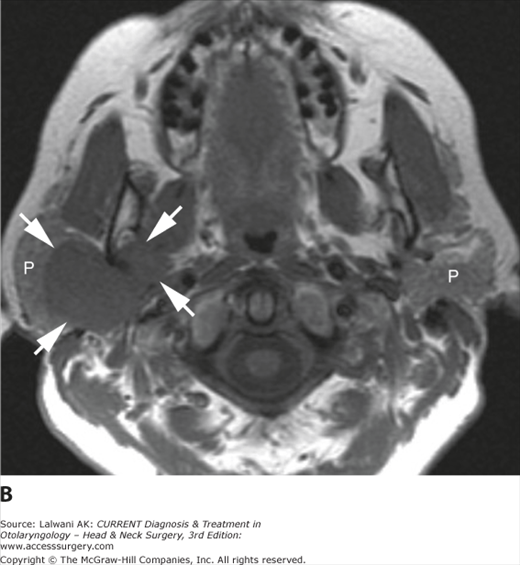
(A) Axial fast spin-echo T2-weighted image with fat saturation in a 60-year-old woman who has noted fullness in her right parotid region. Both parotid glands (P) are indicated, but the large right parotid mass is difficult to detect on this sequence. (B) Axial T1-weighted image demonstrates a large right parotid mass (arrows), which is easy to identify in contrast to the fatty glandular parenchyma. The low signal intensity on the T2-weighted image is suggestive of a malignant histology, and squamous cell carcinoma of the parotid gland was pathologically confirmed.
Stay updated, free articles. Join our Telegram channel

Full access? Get Clinical Tree


