Visual Function Testing: Clinical Correlations
Eliot L. Berson
Visual function tests provide criteria to determine the extent and type of retinal malfunction in patients with retinal disease. This chapter provides an overview of some selected measures of retinal function that are useful as aids in the diagnosis of retinal diseases, particularly those involving the cone and rod photoreceptors.
Cone and Rod Distribution Across the Human Retina
When we align each eye along its visual axis, we achieve fine visual acuity in part because of the high density of cones in the fovea (central 5 degrees).1 However, it is sometimes not appreciated that more than 90% of the cones in the normal human retina are outside the fovea (Fig. 2-24.1) and that cones can provide us with a full visual field under daylight (photopic) conditions. A patient with stationary night blindness with normal cone function and absent rod function can have full kinetic visual fields in the Goldmann perimeter. A patient with advanced macular degeneration has a central scotoma with loss of macular cones, but most cones outside the macula are still intact. In contrast, a patient with advanced cone degeneration by definition has lost cones across all or nearly all the retina.
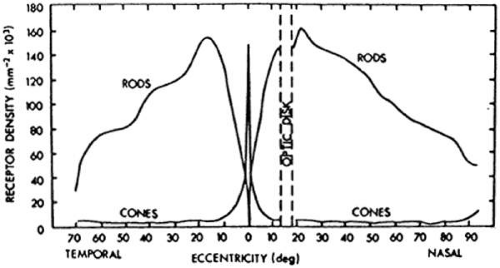 Figure 2-14.1. Distribution of rods and cones in the normal human retina. Corresponding perimetric angles from the fovea at 0 degrees are given. (From Pirenne MH: Vision and the Eye, London, The Pilot Press, 1948, with permission.) |
Rods are distributed across the entire normal human retina except in the foveola (central 1 degree 40 minutes); rod density is maximal 20 to 40 degrees eccentric to the foveola (Fig. 2-14.1).1 Rods can provide us with a nearly full visual field under scotopic conditions (i.e., under starlight or moonlight) and under dim photopic conditions as well. A patient with congenital rod monochromacy (i.e., complete achromat) with absent cone function and normal rod function has a small central scotoma, but an otherwise full visual field in the Goldmann perimeter. Because cones and rods occur in approximately equal numbers in the macula (i.e., central 18.4 degrees), a patient with advanced macular degeneration with a 10- to 20-degree diameter central scotoma, by definition, has lost not only macular cones but also macular rods. A patient with retinitis pigmentosa with a midperipheral scotoma has also lost both rods and cones in the retinal area corresponding to the scotoma.
The normal human retina has about 130 million photoreceptors; the rods outnumber the cones by about 13 to 1. Patients with normal cone function and absent rod function would be expected to have a visual acuity of 20/20 and have normal color vision. Patients with normal rod function and absent cone function would be expected to have visual acuity of 20/200 and have absent color vision. Patients can read fine newspaper print with either their cones or their rods, although patients with only rod function usually require magnification to read. Patients with macular degeneration with large areas of retained peripheral (i.e., extramacular) cone or rod function can read fine print with either their peripheral cones or their peripheral rods with the appropriate magnification.
Dark Adaptation Testing
The cone and rod systems both have the capacity to dark adapt.2,3 After exposure to a steady white adapting light in the Goldmann-Weekers dark adaptometer, the threshold responses of a normal subject to an 11-degree white test light presented 7 degrees above the fovea in the dark over 40 minutes can be described by a biphasic curve, with an initial cone limb followed by a rod limb, as illustrated in Figure 2-14.2. Final cone threshold after 5 to 7 minutes of dark adaptation is normally 100- to 1,000-fold (i.e., 2 to 3 log units) higher than final rod threshold after 40 minutes of dark adaptation. A patient with stationary night blindness with normal cone function and absent rod function has a normal cone limb but no cone-rod break at 5 to 7 minutes; final threshold even after 40 minutes is determined by cones and is, therefore, 2 to 3 log units above normal. The patient with stationary night blindness can see normally under dim photopic conditions that exist at night near street lights or in dimly lit areas and experiences “night blindness” only under starlight or moonlight conditions.4
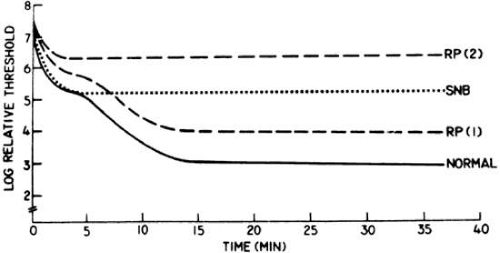 Figure 2-14.2. Representative dark adaptation curves for a normal subject, a patient with congenital stationary night blindness (SNB), and two patients with moderately advanced retinitis pigmentosa, RP (1) and RP (2). (From Berson EL: Night blindness: Some aspects of management. In Faye E (ed): Clinical Low Vision. Boston: Little, Brown and Company, 1976:302, with permission.) |
Figure 2-14.2 also illustrates dark adaptation curves from two representative patients with retinitis pigmentosa (RP); they show impairment of the initial cone limb of dark adaptation and, in the case of RP-2, no cone-rod break. Both patients RP-1 and RP-2 have night blindness under dim photopic conditions because they have impairment of their cone thresholds. That is, patients RP-1 and RP-2 report “night blindness” primarily because of impaired cone function.4 Some patients with early macular degeneration also have difficulty seeing at night, but on further questioning they report that this symptom occurs when driving at night and trying to adjust after looking at oncoming headlights; these patients appear to be experiencing difficulty with the capacity of their macular cones to dark adapt.
Spectral Sensitivity Testing
Rods and cones are sensitive to light across all or nearly all of the visible spectrum (i.e., deep blue, 400 nm, to deep red, 700 nm). The peak sensitivity of the rods is near 500 nm, whereas the average peak sensitivity of the cones is near 555 nm (Fig. 2-14.3). Under dark-adapted conditions, rods are about 1,000-fold more sensitive than cones in the blue–green region of the spectrum; the difference is smaller or absent in the orange–red region. Under dark-adapted conditions, a dim blue light presented to a normal subject near threshold will first be reported simply as white light because the subject is using rods and therefore cannot appreciate color; only when the light is made about 1,000-fold brighter will a normal subject be able to use cones and see the test light as blue. Similarly, under dark-adapted conditions a dim blue light can be used to isolate rod function in the electroretinogram (ERG); a bright blue light can elicit both rod and cone responses if the light is sufficiently bright to be seen by the cones.5
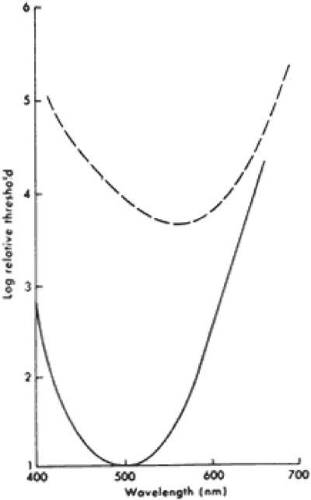 Figure 2-14.3. Continuous line is CIE (Commission International de l’Eclairage) scotopic luminosity curve (rod spectral sensitivity function) derived from psychophysical measurements and placed at a level for normal human subjects; dashed line is Wald’s photopic luminosity curve (spectral sensitivity function for the cone mechanisms under photopic conditions) derived from psychophysical measurements of peripheral retinal function. Electroretinographic spectral sensitivity curves for normal rod and cone systems also respectively approximate the solid line and dashed line curves. (From Berson EL: Electrical phenomena in the retina. In Hart WM [ed]: Adler’s Physiology of the Eye. Clinical Application, 9th ed. St. Louis: CV Mosby, 1992:641, with permission.) |
The peak sensitivity of the ERG to a 25-Hz white flickering light is near 555 nm under dark-adapted conditions (Fig. 2-14.4) because rods cannot respond to stimuli above 20 Hz under these test conditions.6 In the presence of different-colored, steady background lights that desensitize one or another cone system by bleaching that system (i.e., dissociating opsin from vitamin A), one can isolate blue, green, and red cone function to this 25-Hz white flickering light. In the presence of a bright yellow background light that desensitizes green and red cone function, presentation of this flickering light results in a peak sensitivity near 440 nm, thereby isolating blue cone function. In the presence of a purple adapting light that desensitizes the blue cone and red cone systems, the peak sensitivity of the eye is near 540 nm, thereby isolating green cone function. In the presence of a blue–green steady background light that desensitizes the blue cone and green cone systems, the peak sensitivity is near 580 nm, thereby isolating red cone function. In each case the chromatic background minimizes or eliminates the contribution of two cone mechanisms, thereby permitting isolation of the third cone mechanism. These three spectral sensitivities, derived from ERG testing in the presence of chromatic backgrounds, correspond with the absorption characteristics of individual blue, green, and red cones, determined with microspectrophotometry, thereby helping to establish that these three functions are generated by the blue (short wavelength sensitive), green (middle wavelength sensitive), and red (long wavelength sensitive) cones, respectively.7,8
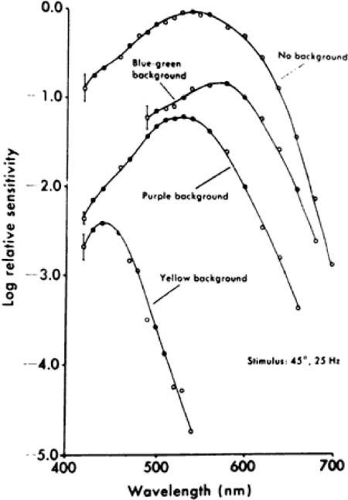 Figure 2-14.4. Spectral sensitivity curves describing response of monkey cone mechanisms to 25-Hz stimulus under conditions of dark adaptation or in the presence of intense chromatic backgrounds. Sector disc (50% duty cycle) was used to present flickering stimuli (25 Hz). Stimulus subtended visual angle of 45 degrees and was centrally superimposed on 68-degree background. Spectral sensitivity data were based on the log relative quantum flux at the retina necessary to elicit a criterion amplitude in the electroretinogram. Red cone mechanism showed best separation on blue–green adapting field, green cone mechanism on purple adapting field, and blue cone mechanism on yellow adapting field. Data points (circles) are an average of three animals. Vertical lines equal ± 1 SD (average). (From Mehaffey L III, Berson EL: Cone mechanisms in the electroretinogram of the cynomolgus monkey. Invest Ophthalmol 13:266, 1974, with permission.) |
Hereditary retinal diseases involving the photoreceptors can be subdivided with these spectral sensitivities in mind. For example, blue cone monochromats are patients born with blue cone and rod function and absent red and green cone function; their sensitivity function under dark-adapted conditions is governed by rods and their peak sensitivity is near 500 nm, and their sensitivity under light-adapted conditions is governed by blue cones with their peak sensitivity near 440 nm. A rod monochromat with complete loss of cone function and normal rod function has a peak sensitivity near 500 nm under both light- and dark-adapted conditions. A patient with X-linked cone degeneration-protan type has a loss of red and green cone function with predominant loss of red cone function at a time when rod function and blue cone function appear to be normal. Patients with RP appear to have an abnormality of rod and cone function across all or nearly all the retina in the early stages of the condition.
Color Vision Testing
The Farnsworth Panel D-15 and the Ishihara plates are useful to screen patients for X-chromosome–linked, red (protan) deficiency or X-chromosome–linked, green (deutan) deficiency.9,10,11 Dominantly inherited blue (tritan) deficiency can also be detected on the Farnsworth Panel D-15. Blue cone monochromat color test plates can be used to distinguish young males with X-linked blue cone monochromacy from young males with autosomal recessive rod monochromacy: the former pass this test and the latter fail it.12 All of these color vision tests should be performed without pupillary dilation under standardized lighting conditions that approximate daylight.
Acquired red–green or blue–yellow color defects are well known. For example, a patient with cone dystrophy may report an acquired red–green dyschromatopsia caused by loss of cone photoreceptors in the macula. Red–green dyschromatopsia with a mild blue–yellow loss of discrimination has been observed in optic neuropathies. Acquired blue–yellow deficiency has been observed in patients with RP as well as in those with glaucoma and diabetic retinopathy. Acquired color deficiencies can be monitored with an anomaloscope, which allows color matches; for example, a patient with choroidal disease and subretinal fluid in the fovea may have cone photoreceptor disorientation with a consequent shift in the Rayleigh color match to a higher red primary ratio (i.e., pseudoprotanomaly).9,11
Color vision tests used to assess retinal photoreceptor function provide information about patches of cones. For example, a patient with advanced macular degeneration with a central scotoma may fail the Ishihara plates because of loss of central cones and yet perform the Farnsworth Panel D-15 correctly by viewing the color caps with extramacular cones. Color vision tests that rely on manual dexterity and conceptual ordering of color caps (e.g., the Farnsworth Panel D-15) should be interpreted with caution in children younger than 10 years of age.9
Full-Field Erg
The light-evoked electric response from the eye, or ERG, is a mass response generated by cells across the entire retina. Loss of half of the photoreceptors is associated with an approximately 50% reduction in full-field ERG amplitude. Although the rods outnumber the cones 13 to 1, the cones account for 20% to 25% of the full-field ERG response to single flashes of white light under dark-adapted conditions. The full-field ERG is primarily generated by extramacular (i.e., midperipheral and far peripheral) cones and rods; patients with a four-disc diameter central scar and normal extramacular function have normal full-field cone and rod ERG responses. The central macula (central 10 degrees) contains about 450,000 cones, or about 7% of the total retinal cone population.5,13 This could account for the inability of the full-field ERG system to detect abnormalities confined to the central macula. Conversely, a patient with advanced RP and less than 10-degree-diameter fields can still retain 20/20 vision and have a profoundly reduced full-field ERG.5,14
A patient with a macular and perimacular scar would be expected to have a reduction in the full-field cone and rod ERG, taking into account that large numbers of cones and rods are normally located in the macular and perimacular zone. A patient with a large peripheral chorioretinal scar would also be expected to have a reduction in the full-field rod and cone ERG because of loss of rod and cone function in the peripheral retina. Patients with losses of patches of retina characteristically show reductions in amplitude with normal b-wave implicit times (i.e., time intervals between stimulus onset and major cornea-positive peaks of the rod or cone responses).15
In the ERG, the initial cornea-negative component (i.e., negative relative to baseline) or a-wave is generated by the photoreceptors, whereas the later cornea-positive component or b-wave is generated by cells proximal to the photoreceptors, in particular, on-bipolar cells. A patient with a central retinal artery occlusion would be expected to have a preserved a-wave and loss of the b-wave. Patients with reduced vision because of optic atrophy or cortical disease and preserved outer retinal function would be expected to have normal ERGs to full-field flashes of light.5
Rod responses are conventionally separated with dim blue light, whereas cone responses are isolated with a flickering light at 30 cycles per second (e.g., 30 Hz). Representative full-field ERGs are illustrated in Figure 2-14.5 from a normal subject and four children, ages 9 to 14, with early RP. Rod responses to dim blue light under dark-adapted conditions (left column) are reduced in all genetic types and, when detectable, are delayed in b-wave implicit times, as designated by horizontal arrows. Cone responses to 30-cycles-per-second white flickering light (right column) are normal or reduced in amplitude and normal or delayed in b-wave implicit times. In the dominant with reduced penetrance, X-linked, and autosomal recessive forms of RP, cone b-wave implicit times, displayed by arrows in the right column, are so delayed that a phase shift occurs between the stimulus artifacts (designated by the vertical lines) and the corresponding response peaks; each stimulus flash elicits the next-plus-one response in contrast to the normal. In the mixed cone–rod responses to single flashes of white light under dark-adapted conditions (middle column), the cornea-negative a-wave generated by the photoreceptors is reduced in amplitude in all genetic types, pointing to the involvement of the photoreceptors in these early stages.16
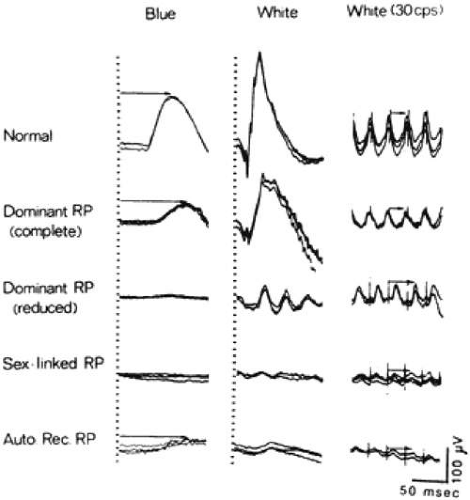 Figure 2-14.5. Electroretinographic responses for a normal subject and four patients with retinitis pigmentosa (ages 13, 14, 14, and 9). Responses were obtained after 45 minutes of dark adaptation to single flashes of blue light (left column) and white light (middle column). Responses (right column) were obtained to 30-cycles/second (or 30-Hz) white flickering light. Calibration symbol (lower right corner) signifies 50 msec horizontally and 100 μV vertically. Rod b-wave implicit times in left column and cone implicit times in right column are designated with arrows. (From Berson EL: Retinitis pigmentosa and allied retinal diseases: Electrophysiologic findings. Trans Am Acad Ophthalmol Otolaryngol 81:659, 1976, with permission.)
Stay updated, free articles. Join our Telegram channel
Full access? Get Clinical Tree
 Get Clinical Tree app for offline access

|