Purpose
To elucidate the visual field (VF) characteristics of normal-tension glaucoma (NTG) patients with either autonomic dysfunction or abnormal peripheral microcirculation.
Design
Prospective, observational study.
Methods
participants: Sixty NTG patients. procedures: All subjects underwent a complete ophthalmic examination and were then referred to a rheumatology department, where they were subjected to heart rate variability (HRV) assessment and nailfold capillaroscopy. Subjects with VF defect clusters confined to the central 10 degrees or outside the central 10 degrees (defined as peripheral) in 1 hemifield were selected (n = 60). The central and peripheral regions were divided further into superior and inferior sectors. Patients were classified into low, middle, and high HRV groups using HRV assessment or normal and abnormal capillaroscopy groups using nailfold capillaroscopy findings. The VF characteristics of the groups were compared. main outcome measures: Location of the VF defect, depth of the VF defect, mean deviation, and the pattern standard deviation of the VF.
Results
The VF defect was more frequent and deepest in the superior central sector in both the low HRV and abnormal capillaroscopy groups. The mean deviation was similar between groups, but the pattern standard deviation was significantly higher in eyes with central defects than in eyes with peripheral defects among those in the low HRV group or abnormal capillaroscopy group. Logistic regression analysis revealed that the group classified by the HRV assessment and the presence of abnormalities in the capillaroscopy were related to the location of the VF defect.
Conclusions
NTG patients with low heart rate variability or abnormal nail capillaroscopy may present as central VF defects. Therefore, vascular risk factors need to be considered when NTG patients have central VF defects.
Several studies have reported the differences in visual field (VF) defects by glaucoma type. Levene observed more frequent VF defects within 5 degrees of fixation in normal-tension glaucoma (NTG) compared with primary open-angle glaucoma (POAG). However, other groups were unable to confirm these differences. Groups reporting differences between NTG and POAG in terms of VF defects considered that the more frequent paracentral or central defects in NTG patients reflected vascular risk factors. Recently, parafoveal scotoma was reported to be related to disc hemorrhages and systemic risk factors such as hypotension, migraine, Raynaud phenomenon, and sleep apnea. It has been postulated that the development of parafoveal scotoma may rest on underlying mechanisms in addition to or other than intraocular pressure (IOP).
Activation of either the sympathetic or parasympathetic nervous systems result in autonomic dysfunction, which leads to alterations of heart rate, blood pressure, and vasomotor status. Heart rate variability is one of the standard methods to assess the systemic autonomic function, and it is a simple and noninvasive method that reflects the balance of the autonomic nervous system in regulating the heart rate. We previously reported autonomic dysfunction in patients with NTG using short-term heart rate variability analysis. Increased sympathetic activity of the heart results in decreased heart rate variability, which is important in maintaining the ability of the heart to respond to various internal or external conditions. Consistent elevation of sympathetic activity may constrict the microvasculature and may result in vascular insufficiency around the optic nerve head (ONH).
Peripheral microcirculation consists of a network of blood vessels less than 100 μm in diameter and has an important role in regulating the hemodynamics of the body. Abnormality in the peripheral microcirculation results in impairment of the delivery of oxygen and nutrients and is observed in many critical illnesses. The nailfold capillaroscopy provides direct assessment of the microcirculation. One additional aspect of vascular insufficiency that we identified in glaucoma patients was the microvascular circulation in the peripheral capillaries of the nail bed by nailfold capillaroscopy. Abnormal findings in nailfold capillaroscopy were observed more frequently in patients with glaucoma, representing insufficiency in peripheral microcirculation.
We hypothesized that if vascular risk factors were the reason for paracentral or central scotoma in a distinct subgroup of patients with glaucoma, a difference in the VF characteristics of patients with autonomic dysfunction of the heart or abnormal peripheral microcirculation may be observable. Thus, we analyzed the VF characteristics using the results of the heart rate variability assessment or nailfold capillaroscopy of patients with NTG.
Methods
Participants
Patients who were newly diagnosed with NTG were enrolled prospectively in the study by the following inclusion and exclusion criteria. Inclusion criteria were presence of typical optic nerve head changes, including increased cupping, focal or diffuse loss of the neuroretinal rim, or both; glaucomatous VF loss on at least 2 consecutive tests; open angle on gonioscopy; IOP of 21 mm Hg or less (without topical treatment) in repeated measurements on different days; and follow-up at our clinic of at least 2 years with visits at 4- to 6-month intervals. Exclusion criteria were the presence of diabetes mellitus (defined as fasting blood glucose of more than 126 mg/dL or postprandial 2-hour blood glucose of more than 200 mg/dL; guidelines for diabetes mellitus, the Korean Society of Diabetes 2008) or systemic cardiovascular disease, smoking, or taking vasoactive drugs or drugs known to affect the autonomic nervous system. Those having abnormally high blood pressure (BP) on measurement, namely, more than 140 mm Hg systolic and more than 90 mm Hg diastolic (guidelines for the management of hypertension, the Korean Society of Hypertension 2008) were excluded. Patients taking drugs for treatment of systemic hypertension or heart disease, such as calcium channel blockers, angiotensin-converting enzyme inhibitors, β-adrenergic blockers, and α-1 adrenergic blockers, also were excluded. Subjects with known connective tissue disease that might have affected the results of nailfold capillaroscopy or subjects with any symptoms suggesting autonomic nervous system involvement also were excluded. Subjects with any intraocular or neurologic disease that could lead to VF loss and consistently unreliable VFs (defined as false negative ≥ 15%, false positive ≥ 15%, and fixation losses ≥ 20%) were excluded from the study. The subjects who visited our glaucoma clinic between 2007 and 2010 who fulfilled the inclusion and exclusion criteria and agreed to undergo heart rate variability assessment and nailfold capillaroscopy were enrolled. For subjects with unilateral disease, the eye with the disease was recruited. If a subject had bilateral disease, the worse eye was recruited.
Each subject underwent a complete ophthalmologic examination, including visual acuity, refraction, slit-lamp biomicroscopy, gonioscopy, Goldmann applanation tonometry, dilated stereoscopic examination of the optic disc, red-free fundus photography, optical coherence tomography (Stratus OCT system version 3; Zeiss-Humphrey Ophthalmic Systems, Dublin, California, USA), Heidelberg retinal tomography (Heidelberg Engineering GmbH, Heidelberg, Germany), and Humphrey VF examination using the Swedish interactive threshold algorithm standard 24-2 test (Carl Zeiss Meditec, Dublin, California, USA). BP was measured with a digital automatic blood pressure monitor (Dinamap model Pro 18 Series DP110X-RW, 100V2; GE Medical Systems Information Technologies, Inc, Milwaukee, Wisconsin, USA), with the participant seated after 5 minutes of rest. BP was measured twice, 5 minutes apart. Mean arterial BP was defined as diastolic BP + 1/3 (systolic BP − diastolic BP). Mean ocular perfusion pressure (MOPP) was defined as 2/3 (mean arterial BP − IOP).
An abnormal glaucomatous VF was defined as the consistent presence of a cluster of 3 or more nonedge points on the pattern deviation plot with a probability of occurring in less than 5% of the normal population, with 1 of these points having the probability of occurring in less than 1% of the normal population; a pattern standard deviation at P < .05; or glaucoma hemifield test results outside normal limits. VF defects had to be repeatable on at least 2 consecutive tests.
All patients were referred to the rheumatology outpatient clinic of the Department of Internal Medicine at Seoul St. Mary’s Hospital, Seoul, Korea. One of the authors (S.-H.P.) performed the physical examination and the recording of medical status. Hematologic status, clinical chemistry, hepatitis, HIV serologic analysis, and urine analysis were performed to determine the health status of the subject. Heart rate variability assessment and nailfold capillaroscopy were performed on the same day by 2 independent technicians in the rheumatology department. All patients were given an information leaflet advising them to refrain from drinking caffeine or alcohol for 1 day before the tests. Patients also were requested to avoid activities that would affect blood pressure, including running and jumping, for at least 2 hours before the tests.
Heart Rate Variability Assessment
Heart rate variability assessment was performed before the nailfold capillaroscopy. The method has been described in detail elsewhere. Briefly, noninvasive BP was obtained from the radial artery at the wrist using an automated oscillometric device. The echocardiography was monitored for 5 minutes after 30 minutes of rest in the supine position. Echocardiography signals were transferred to a Medicore Heart Rate Analyzer (model SA-3000P; Medicore, Seoul, Korea). The intervals between each successive normal QRS complex were determined initially. The standard deviation of qualified normal-to-normal intervals (SDNN) is the standard deviation of all the normal rate-to-rate intervals in a 24-hour echocardiography recording in milliseconds. In the present study, testing was performed over a 5-minute period under controlled conditions. A reduction of the SDNN reflects low heart rate variability, which means a high tone of sympathetic activity of the heart. Power spectral density analysis provided information on how power was distributed (the variance) as a function of frequency. The typical power spectrum of a 5-minute heart rate tachogram is divided into 3 bands or regions consisting of a 0.15- to 0.4-Hz high-frequency band, a 0.04- to 0.15-Hz low-frequency band, and a 0.0033- to 0.04-Hz very low-frequency band. The high-frequency band reflects fast changes in beat-to-beat variability resulting from parasympathetic activity. The low-frequency band is considered a fair approximation of sympathetic activity. The very low-frequency band reflects mostly sympathetic stimulation. Total power is the average of the total power (power in the band less than 0.04 Hz) of each 5-minute segment, including the very low-frequency, low-frequency, and high-frequency power spectrum bands. The low-frequency to high-frequency is the ratio of low-frequency to high-frequency power. A higher ratio indicates increased sympathetic activity or reduced parasympathetic activity.
Patients were divided into 3 groups according to SDNN. Our previous study showed that this parameter differed significantly in patients with glaucoma versus normal healthy controls. The lowest heart rate variability group consisted of patients within the lowest tertile in terms of SDNN. The middle heart rate variability group consisted of patients within the middle tertile, and the highest heart rate variability group consisted of patients within the highest tertile. The lowest heart rate variability group has a reduced value of SDNN, which means a higher tone of sympathetic activity with higher autonomic dysfunction of the heart than other groups.
Nailfold Capillaroscopy
Nailfold capillaroscopy was performed in a separate room after the heart rate variability assessment. The method has been described in detail elsewhere. Briefly, each patient was seated with the dorsum of the hand facing upward, with halogen lights illuminating the nails coated with immersion oil, under a nailfold microscope. Nailfolds of the second, third, and fourth digits of both hands were observed using a light microscope (Olympus SZ-PT, Tokyo, Japan) under ×100 and ×400 magnification. All microphotographs were transmitted to a computer via a digital camera (Polaroid, Minnetonka, Minnesota, USA).
The capillaroscopy results were analyzed by a single observer (S.-H.P.) who did not know the ophthalmologic diagnosis and the results of heart rate variability testing. The capillary vessel architecture, morphologic features, and distribution; the number of capillary vessels; and the presence of splinter hemorrhages were evaluated. Dilated loops were defined as detection of a microvascular loop with a homogeneous increase in diameter of more than 50 μm. Avascular areas were defined as the absence of capillaries in a field of at least 500 μm. Nailfold hemorrhages were considered present when more than 2 punctuated hemorrhages per finger or confluent areas of hemorrhage were observed.
Patients were categorized by nailfold capillaroscopy into 2 groups according to 3 signs: dilated loops, avascular areas, and nailfold hemorrhages. To be classified as abnormal, only 1 positive finding among the 3 signs was required. Patients with normal findings on all 3 signs were classified into the normal capillaroscopy group.
Dividing the Visual Field Defects by Location
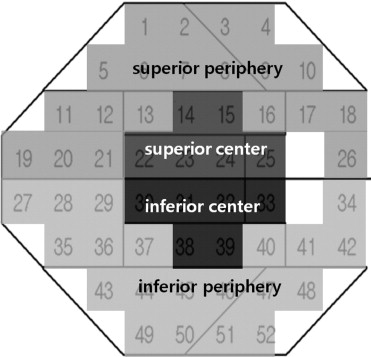
We selected consecutive eyes with VF defect clusters confined to the central 10 degrees or outside the central 10 degrees in 1 hemifield. The central 10 degrees and outside the central 10 degrees of the VF were divided into superior and inferior sectors ( Figure 1 ). Patients with overlapping VF defect clusters in different sectors were excluded from the analysis. The mean of the deviations of the pattern standard deviation (PSD) plot at 20 points for superior and inferior periphery sectors and at 6 points for superior and inferior center sectors were calculated.
Statistical Analysis
Statistical analysis was performed using the SPSS statistical package (SPSS, Inc, Chicago, Illinois, USA). The Student t test or a 1-way analysis of variance was used to compare differences between or among groups. The post hoc test with the Scheffe method was used for multiple comparison. The chi-square test was used where appropriate to compare frequencies. The frequency of VF defect locations in each sector was compared between groups by the chi-square test. The means of the deviations in each sector of the PSD plot were analyzed to compare the depth of VF defects with the Student t test. The relationship between mean deviation (MD) and PSD was evaluated by linear regression analysis according to the defect locations in each group. To find out factors related to the location of the VF defects, univariate and multivariate logistic regression analyses were carried out. The dependent variables were either central or peripheral VF defects. The independent variables were age, sex, spherical equivalent, MD, mean IOP, systolic BP, diastolic BP, MOPP, group of the heart rate variability assessment, and presence of abnormalities of nailfold capillaroscopy. Because the sex, group of the heart rate variability assessment, and presence of abnormalities of nailfold capillaroscopy are nominal in scale, these independent variables were investigated as independent factors using a regression model, and dummy variables were performed with male, heart rate variability group, and no abnormalities in nailfold capillaroscopy as a standard. The variables that retained significance at P < .10 in univariate analysis were included in the multivariate model. P < .05 was considered to represent statistical significance.
Results
In total, 60 eyes from 60 patients with NTG met the inclusion and exclusion criteria. The 60 patients with NTG had a mean age of 55.37 ± 11.84 years. VF examination produced −4.95 ± 3.84 dB in MD and 5.86 ± 4.01 dB in PSD. Forty-eight of 60 (80%) patients had unilateral NTG and 48 eyes with the disease were included. The remaining 12 of 60 patients (20%) patients had bilateral NTG, and the worse eye from these patients was included. The contralateral eye of these 12 patients that were not included in the study had the same location of VF damage as the eye that was included.
Of the 60 eyes, 20 were classified into the lowest heart rate variability group, 20 into the middle heart rate variability group, and 20 into the highest heart rate variability group. Of the 60 eyes, 31 were classified into the normal capillaroscopy group, and 29 were placed in the abnormal capillaroscopy group. The proportion of the abnormal capillaroscopic findings among groups classified by heart rate variability assessment were 14 (70.0%) of 20 eyes in the lowest heart rate variability group, 9 (45.0%) of 20 eyes in the middle heart rate variability group, and 6 (30.0%) of 20 eyes in highest heart rate variability group ( P = .038).
Between groups that were classified by the heart rate variability assessment, we found no significant differences in age ( P = .722), sex ( P = .419), or spherical equivalent ( P = .460). The VF showed similar stages of glaucoma damage in the 3 groups in terms of MD and PSD. The MD was −4.74 ± 2.97 dB in the lowest heart rate variability group, −5.19 ± 6.34 dB in the middle heart rate variability group, and −4.93 ± 2.93 dB in the highest heart rate variability group ( P = .565). The PSD was 6.37 ± 4.51 dB in the lowest heart rate variability group, 5.75 ± 3.98 dB in the middle heart rate variability group, and 5.45 ± 4.22 dB in the highest heart rate variability group ( P = .943). The mean IOP (16.09 ± 2.74 mm Hg, 15.33 ± 3.42 mm Hg, and 15.37 ± 3.20 mm Hg; P = .390), systolic BP (127.54 ± 16.50 mm Hg, 126.14 ± 12.75 mm Hg, and 129.43 ± 14.54 mm Hg; P = .117), diastolic BP (76.47 ± 12.33 mm Hg, 75.52 ± 13.44 mm Hg, and 76.35 ± 10.78 mm Hg; P = .768), and calculated MOPP (51.44 ± 9.15 mm Hg, 52.44 ± 3.99 mm Hg, and 51.33 ± 6.87 mm Hg; P = .556) in the lowest, middle, and highest heart rate variability group, which did not differ significantly. The heart rate variability assessment showed a significant difference among the groups in terms of SDNN ( P < .001), low frequency ( P < .001), and low frequency–to–high frequency ratio ( P < .001; Table 1 ). Analyses of the retinal nerve fiber layer (RNFL) thickness by the optical coherence tomography and the disc parameters by Heidelberg retinal tomography did not reveal any structural differences among the groups according to heart rate variability assessment (data not shown).
| Lowest Heart Rate Variability (n = 20) | Middle Heart Rate Variability (n = 20) | Highest Heart Rate Variability (n = 20) | P Value | Post Hoc Analysis | |
|---|---|---|---|---|---|
| Age, years | 58.67 ± 10.47 | 51.50 ± 13.28 | 55.93 ± 12.09 | .722 a | |
| Sex (male/female), n | 11/9 | 10/10 | 7/13 | .419 b | |
| SE, diopters | −0.74 ± 2.11 | −0.58 ± 1.94 | −0.88 ± 2.04 | .460 a | |
| VF MD, dB | −4.74 ± 2.97 | −5.19 ± 6.34 | −4.93 ± 2.93 | .565 a | |
| VF PSD, dB | 6.37 ± 4.51 | 5.75 ± 3.98 | 5.45 ± 4.22 | .943 a | |
| Mean IOP, mm Hg | 16.09 ± 2.74 | 15.33 ± 3.42 | 15.37 ± 3.20 | .390 a | |
| SBP, mm Hg | 127.54 ± 16.50 | 126.14 ± 12.75 | 129.41 ± 14.54 | .117 a | |
| DBP, mm Hg | 76.47 ± 12.33 | 75.52 ± 13.44 | 76.35 ± 10.78 | .768 a | |
| MOPP, mm Hg | 51.44 ± 9.15 | 52.44 ± 3.99 | 51.33 ± 6.87 | .556 a | |
| Use of topical β-blocker, n (%) | 4 (20.0%) | 5 (25.0%) | 3 (15.0%) | .732 b | |
| Mean heart rate | 74.40 ± 12.12 | 73.90 ± 9.93 | 73.80 ± 15.00 | .990 a | |
| SDNN | 15.98 ± 3.95 | 29.09 ± 4.20 | 49.78 ± 27.21 | < .001 a | LHV < MHV < HHV |
| Total power | 900.76 ± 2620.01 | 591.98 ± 265.17 | 188.18 ± 1576.92 | .082 a | |
| Very low-frequency band | 302.54 ± 215.25 | 458.50 ± 1338.61 | 646.93 ± 671.22 | .282 a | |
| Low-frequency band | 375.80 ± 1228.31 | 207.60 ± 278.24 | 102.24 ± 103.66 | < .001 a | LHV, MHV > HHV |
| High-frequency band | 149.81 ± 30.01 | 199.23 ± 58.88 | 281.32 ± 242.98 | .237 a | |
| Low- to high-frequency ratio | 2.05 ± 1.21 | 1.72 ± 2.56 | 1.34 ± 0.82 | < .001 a | LHV > MHV, HHV |
a One-way analysis of variance.
Between groups classified by nailfold capillaroscopy, we found no significant differences in age ( P = .684), sex ( P = .747), and spherical equivalent ( P = .512). The VF showed similar stages of glaucoma damage in the 2 groups in terms of MD and PSD. The MD was −4.69 ± 5.81 dB in the normal capillaroscopy group and −5.06 ± 3.91 dB in the abnormal capillaroscopy group ( P = .622). The PSD was 5.457 ± 4.22 dB in the normal capillaroscopy group and 6.37 ± 4.51 dB in the abnormal capillaroscopy group ( P = .813). The mean IOP (14.50 ± 3.62 mm Hg and 14.80 ± 2.75 mm Hg; P = .756), systolic BP (127.20 ± 11.54 mm Hg and 124.46 ± 10.94 mm Hg; P = .620), diastolic BP (75.33 ± 10.76 mm Hg and 74.92 ± 11.56 mm Hg; P = .721), and calculated MOPP (51.01 ± 7.07 mm Hg and 52.44 ± 6.58 mm Hg; P = .821) in the abnormal and normal capillaroscopy groups did not differ significantly. Abnormal nailfold capillaroscopy findings were present only in the abnormal capillaroscopy group ( Table 2 ). The RNFL thickness by optical coherence tomography and disc parameters by Heidelberg retinal tomography did not show any structural differences between the normal and abnormal capillaroscopy groups (data not shown).
| Abnormal Capillaroscopy (n = 29) | Normal Capillaroscopy (n = 31) | P Value | |
|---|---|---|---|
| Age, years | 57.16 ± 11.07 | 52.68 ± 13.92 | .684 a |
| Sex (male/female), n | 16/13 | 17/14 | .747 b |
| SE, diopters | −0.60 ± 2.20 | −0.62 ± 1.98 | .512 a |
| VF MD, dB | −5.06 ± 3.91 | −4.69 ± 5.81 | .622 a |
| VF PSD, dB | 6.37 ± 4.51 | 5.45 ± 4.22 | .813 a |
| Mean IOP, mm Hg | 14.50 ± 3.62 | 14.80 ± 2.75 | .756 a |
| SBP, mm Hg | 127.20 ± 11.54 | 124.46 ± 10.94 | .620 a |
| DBP, mm Hg | 75.33 ± 10.76 | 74.92 ± 11.56 | .721 a |
| MOPP, mm Hg | 51.01 ± 7.07 | 52.44 ± 6.58 | .821 a |
| Use of topical β-blocker, n (%) | 7 (24.1%) | 5 (16.1%) | .326 b |
| Dilated loops | 17 (55.2%) | 0 | < .001 b |
| Avascular areas | 8 (27.6%) | 0 | .002 b |
| Nailfold hemorrhages | 4 (13.8%) | 0 | .049 b |
Stay updated, free articles. Join our Telegram channel

Full access? Get Clinical Tree


