Purpose
To observe the progression of affected lesions using ultra-wide-field fundus autofluorescence (FAF) in multiple evanescent white dot syndrome.
Design
Retrospective, observational case series.
Methods
setting : Institutional. patient population : 14 eyes of 13 patients (mean age, 35.8 years) with acute disease unilaterally. observation procedures : Patients underwent ultra-wide-field FAF, spectral-domain optical coherence tomography (SD OCT), multifocal electroretinography (mfERG), and Goldmann or automated perimetry; the best-corrected visual acuity (BCVA) and refractive error were measured. main outcome measure : Ability of ultra-wide-field FAF to detect lesions with greater sensitivity compared with color fundus photography.
Results
Ultra-wide-field FAF imaging enabled improved visualization of the affected lesions and showed that the core lesion was in the posterior fundus involving the peripapillary retina and posterior pole and surrounded by hyper-autofluorescent spots outside the vascular arcade. The posterior lesions expanded rapidly and peripheral spots spread farther peripherally and reached a maximal extent during the acute stage. During follow-up, the peripheral hyper-autofluorescent spots resolved and then hyper-autofluorescence of the posterior fundus gradually faded. SD OCT showed diffuse disruption of the photoreceptor inner segment/outer segment junction (IS/OS) in the posterior fundus during the acute stage. The correlation between the IS/OS abnormality and hyper-autofluorescent areas was unclear. The disrupted IS/OS was restored with normalization of the FAF.
Conclusions
Ultra-wide-field FAF showed that the lesions arise from the peripapillary retina and the posterior pole and spread peripherally in a centrifugal manner during the acute stage. The hyper-autofluorescent spots faded from the periphery in a centripetal manner.
Multiple evanescent white dot syndrome (MEWDS), first reported by Jampol and associates in 1984, is an acute, generally unilateral retinopathy that develops predominantly in young adults. Patients report blurred vision, photopsia, or visual field defects and have multiple yellow or white spots in the fundus. Myopia was highly prevalent in Japanese patients with MEWDS. Although the clinical features of MEWDS have been well described, the cause is unknown. Fluorescein angiography showed multiple hyperfluorescent spots, but late-phase indocyanine green angiography (IA) showed more pronounced hypofluorescent spots. Full-field electroretinography (ffERG) and multifocal electroretinography (mfERG) showed dysfunctional photoreceptors. Spectral-domain optical coherence tomography (SD OCT) showed a disrupted or irregular photoreceptor inner segment/outer segment (IS/OS).
Fundus autofluorecence (FAF) imaging is a noninvasive method of retinal imaging. The FAF signal initially was thought to originate predominantly from lipofuscin in the retinal pigment epithelium (RPE). Material containing N-retinylidene-N-retinylethanolamine (A2E) is another source of FAF.
It is difficult to determine the affected lesions in the MEWDS because of faint and transient white dots in the peripheral fundus and diffuse faint retinal opacities in the posterior fundus. In the current study, we used an ultra-wide-field FAF camera to investigate the evolution of the affected lesions in acute MEWDS.
Methods
The Institutional Review Board/Ethics Committee of Gunma University School of Medicine (Gunma, Japan) approved the retrospective review of patient data for multiple evanescent white dot syndrome. This study complied with the tenets of the Declaration of Helsinki. All patients provided informed consent for participation in this research.
The study included 14 eyes of 13 patients (4 men, 9 women; mean age, 35.8 years; range, 17–50 years) with MEWDS at Gunma University Hospital. One patient developed the MEWDS bilaterally at a different time. All patients reported unilateral blurred vision and spotty visual field defects at the first examination. The fundi in the affected eyes all had faint white spots of varying diameters mainly in the midperiphery to equatorial region. The included patients had typical MEWDS with numerous transient white spots and diffuse disruption of the photoreceptor outer segment on SD OCT images, which was later restored. All patients were healthy except for the ocular symptoms. No women were pregnant. The mean refractive error of the affected eyes was −5.3 diopters (D) (range, −0.5 to −11.25 D). The patients were followed untreated for a mean of 13.7 months (range, 3–57 months). In addition to routine ocular examinations, we performed color fundus photography with a 50-degree angle camera (Topcon TRC-50DX; Topcon Corporation, Tokyo, Japan), Goldmann perimetry (GP) or Humphrey field analyzer (HFA), ffERG, mfERG, and SD OCT (Cirrus HD-OCT; Carl Zeiss Meditec, Inc, Dublin, California, USA). We evaluated the FAF using a wide-field scanning laser ophthalmoscope (OPTOS 200Tx; Optos PLC, Dunfermline, UK), which allows nonmydriatic FAF imaging of up to 200 degrees of the fundus. OPTOS fundus photograph with pseudo-color images were obtained at each examination. During the acute 3-week stage, we performed OCT and wide-field FAF weekly. At the 3- to 8-week intermediate stage, we performed those test every 4 weeks. At the late stage after 9 weeks, we performed the tests once or twice in 2-month intervals. Two independent retinal specialists (H.H., S.K.) evaluated all photographs. The agreement in the grading of the FAF, color fundus, and OCT images exceeded 90%.
Results
Ultra-wide-field FAF detected the affected lesions with greater sensitivity than conventional color fundus photography. The affected lesions appeared as diffuse hyper-autofluorescence in the posterior pole and involved the peripapillary retina and macular area and surrounding hyper-autofluorescent spots outside the vascular arcades in all 14 eyes of 13 patients. During the first 2 weeks of observation, diffuse hyper-autofluorescence in the posterior pole expanded to the midperiphery and the peripheral hyper-autofluorescent spots spread farther to their maximal extent. The peripheral hyper-autofluorescent spots faded first and the posterior diffuse autofluorescence then faded. SD OCT showed diffuse disruption or blurring of the IS/OS line in the posterior fundus. The disrupted IS/OS then aggregated in nodules on the RPE and the IS/OS was restored. As the abnormal hyper-autofluorescence in the periphery and the posterior fundus faded to the level of the unaffected fellow eyes, the continuity of the disrupted IS/OS was restored. Table 1 shows the patient characteristics.
| Case | Sex/Age | Affected Eye/BCVA | Refractive Error | Follow-up Period (Months) | FAF Pattern | Resolution of Peripheral Spots (Weeks) | IS/OS Status of Posterior Pole At First Visit | Restoration of IS/OS (Months) | ||
|---|---|---|---|---|---|---|---|---|---|---|
| First Visit | Last Visit | First Visit | Last Visit | |||||||
| 1 | F/39 | OS/0.3 | OS/1.2 | −1.25 | 16 | Posterior pole + peripheral spots | Normalized | 2 | Diffuse disruption | 3 |
| 2 | M/27 | OD/1.2 | OD/1.2 | −5.25 | 18 | Posterior pole | Normalized | 4 | Blurred IS/OS | 3 |
| 3 | M/49 | OD/1 | OD/1 | −6.5 | 16 | Posterior pole + peripheral spots | Normalized | 3 | Diffuse disruption | 12 |
| 4 | F/50 | OD/1.2 | OD/1.2 | −8.5 | 16 | Posterior pole | Hyper-autofluorescence | 4 | Blurred IS/OS | 7 |
| 5 | F/43 | OD/0.9 | OD/1.2 | −0.5 | 25 | Posterior pole + peripheral spots | Normalized | 6 | Blurred IS/OS | 12 |
| 6 | F/28 | OS/1.2 | OS/1.2 | −3 | 16 | Posterior pole | Hyper-autofluorescence | 20 | Blurred IS/OS | 4 |
| 7 | F/28 | OD/1.2 | OD/1.2 | −3 | 16 | Posterior pole | Normalized | 4 | Blurred IS/OS | 4 |
| 8 | F/43 | OD/1.2 | OD/1.2 | −9.5 | 14 | Posterior pole | Normalized | 8 | Diffuse disruption | 5 |
| 9 | M/17 | OD/0.4 | OD/1.2 | −7 | 3 | Posterior pole + peripheral spots | Normalized | 3 | Diffuse disruption | 3 |
| 10 | F/26 | OD/1.2 | OD/1.2 | −7 | 36 | Posterior pole | Normalized | 4 | Blurred IS/OS | 3 |
| 11 | F/18 | OD/1.2 | OD/1.2 | −1.75 | 7 | Posterior pole | Hyper-autofluorescence | 4 | Diffuse disruption | 6 |
| 12 | F/41 | OS/0.1 | OS/0.9 | −8.75 | 6 | Posterior pole + peripheral spots | Normalized | 4 | Diffuse disruption | 4 |
| 13 | M/33 | OS/1 | OS/1.2 | −0.5 | 4 | Posterior pole | Normalized | 4 | Diffuse disruption | 3 |
| 14 | F/28 | OS/0.2 | OS/1 | −11.25 | 57 | Posterior pole | Normalized | 4 | Diffuse disruption | 18 |
| Mean | 35.8 | 0.76 | 1.16 | −5.27 | 13.7 | 5.3 | 6.2 | |||
| Case | Affected Eye | Visual Field (First Visit) |
|---|---|---|
| 1 | OS | OD normal/OS enlarged blind spot |
| 2 | OD | OD enlarged blind spot/OS normal |
| 3 | OD | OD enlarged blind spot, temporal, inferior, and superior scotoma/OS slight superior scotoma |
| 4 | OD | OD enlarged blind spot, temporal, inferior, and superior scotoma/OS normal |
| 5 | OD | OD enlarged blind spot/OS inferior arcuate scotoma |
| 6 | OS | OD slight enlarged blind spot/OS enlarged blind spot |
| 7 | OD | OD enlarged blind spot/OS enlarged blind spot |
| 8 | OD | OD enlarged blind spot and central scotoma/OS normal |
| 9 | OD | OD enlarged blind spot/OS normal |
| 10 | OD | OD enlarged blind spot/OS normal |
| 11 | OD | OD enlarged blind spot and inferior scotoma/OS normal |
| 12 | OS | OD enlarged blind spot and central scotoma/OS normal |
| 13 | OS | OD normal/OS enlarged blind spot and superior nasal depression |
| 14 | OS | OD normal/OS enlarged blind spot and central scotoma |
Acute Stage (Within 3 Weeks After MEWDS Onset)
We observed the acute stage in all 14 eyes of 13 patients. At the first evaluation, the best-corrected visual acuity (BCVA) levels ranged from 0.2 to 1.2 (mean, 0.76) in the affected eyes and 1.0 to 1.2 (mean, 1.16) in the fellow eyes. In all eyes, the posterior fundus had faint white discoloration with multiple white spots in the midperiphery; in 5 eyes the spots spread to the far periphery. Ultra-wide-field FAF showed diffuse hyper-autofluorescence in the posterior pole that involved the peripapillary and macular areas with numerous hyper-autofluorescent spots in the midperiphery or far periphery in all 14 eyes. During the acute stage, the diffuse hyper-autofluorescence in the posterior pole expanded and the peripheral hyper-autofluorescent spots spread farther peripherally. SD OCT showed diffuse disruption of the IS/OS in 8 eyes with various BCVA levels or blurring of the IS/OS in 6 eyes with good BCVA in the posterior fundus. The fellow eyes appeared normal on the SD OCT images. Visual field tests were performed in 14 eyes. All 14 affected eyes had an enlarged blind spot; the macula was involved in 3 eyes. The correlation between the visual field abnormality and the white spots was unclear. GP of the unaffected fellow eyes showed that the blind spot enlarged in 2 patients and showed peripheral depression in 2 patients.
Intermediate Stage (3–8 Weeks)
Ultra-wide-field FAF showed gradual fading of the peripheral hyper-autofluorescent spots within 4 weeks in 11 affected eyes, but the spots remained for 6–20 weeks in 3 eyes. In contrast, the diffuse hyper-autofluorescence persisted in the posterior pole in all 14 eyes. SD OCT showed multiple nodules at the level of the disrupted IS/OS in 8 eyes and the IS/OS was blurred in 6 eyes. Restoration of the IS/OS started at around 2 weeks, but the disruption of the IS/OS frequently persisted.
Late Stage (After 9 Weeks)
After resolution of the peripheral hyper-autofluorescent spots, the diffuse hyper-autofluorescence in the posterior pole gradually decreased while slight hyper-autofluorescence remained in the posterior fundus over 12 weeks in 11 eyes. The IS/OS became continuous in 11 eyes by 12 weeks but was not restored completely in 3 eyes for more than 1 year.
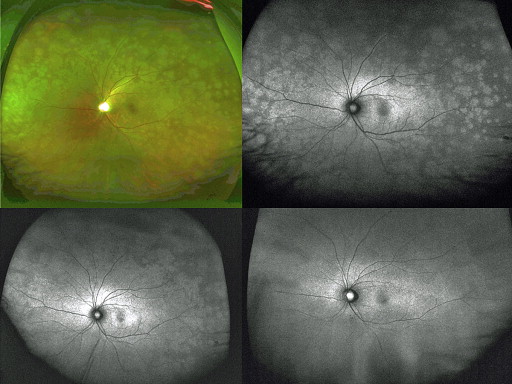
Case 1
A 41-year-old woman reported a central scotoma in the left eye 9 days before the first examination. The scotoma expanded gradually and caused generally blurred vision. At the first examination, the vision was 0.1 × −9.5 D in the left eye. Biomicroscopy showed cells in the anterior chamber in the left eye. A mild vitreous opacity was seen in the left eye. The right eye appeared normal. The left fundus had a slight whitish discoloration in the posterior fundus and numerous white spots of 1–2 disc diameters spreading in the midperiphery and equatorial regions ( Figure 1 ). Ultra-wide-field FAF showed diffuse hyper-autofluorescence in the peripapillary and macular regions. A hyper-autofluorescent spot was peripheral to the posterior lesion ( Figure 1 ). SD OCT showed diffuse disruption of the photoreceptor layer including the IS/OS, cone outer segment tips (COST), and external limiting membrane (ELM) in the posterior fundus. The RPE appeared irregular ( Figure 2 ). Cells were seen in the posterior vitreous. The photoreceptor layer was intact in the right eye. GP showed an enlarged blind spot that involved the macula in the left eye and peripheral depression in the right eye ( Figure 3 ). ffERG showed a nonrecordable rod response and low amplitudes of the maximal and cone responses in the affected eye and a normal response in the unaffected fellow eye. One week after the first examination, the whitish spot became faint but ultra-wide-field FAF showed diffuse hyper-autofluorescence that involved the posterior fundus and midperiphery. Multiple hyper-autofluorescent spots fused together in the peripheral fundus ( Figure 1 ). The BCVA of the left eye was 0.15. SD OCT showed multiple drusenoid nodules at the level of the disrupted IS/OS ( Figure 2 ). At 4 weeks, the left fundus appeared normal except for mottling in the equatorial region. Ultra-wide-field FAF showed irregular hyper-autofluorescence in the equatorial region but the retina was otherwise normal. The BCVA was 0.4 in the left eye. SD OCT showed that the IS/OS was restored except at the fovea. At 16 weeks, the BCVA of the left eye was 0.9. The left fundus appeared normal on ultra-wide color fundus photographs and FAF images ( Figure 1 , Bottom right). SD OCT showed that the IS/OS and COST were restored in the posterior pole, but the IS/OS was blurred and the COST was unidentifiable peripheral to the posterior pole ( Figure 2 ). ffERG showed slight recovery of the rod response, but the amplitudes of the maximal and cone responses were low. The GP became normal bilaterally ( Figure 3 ).
Stay updated, free articles. Join our Telegram channel

Full access? Get Clinical Tree


