(1)
University of Sydney, Sydney, Australia
Overview
The visual field is the portion of space visible to a single stationary eye.
The normal visual field extends 90° temporally, 70° inferiorly, and 60° nasally and superiorly [1].
Visual field testing involves assessment of contrast threshold at multiple points in the field.
Principles of Testing
Subjects are asked to fixate on a central target.
Multiple loci are tested using stimuli of varying luminance against uniform background luminance.
The minimal increment luminance required to detect the stimulus at each location is recorded.
Contrast threshold (CT) = minimal increment luminance (ΔL)/background luminance (L b).
Factors Determining Contrast Threshold (Table 23.1)
Table 23.1
Factors determining contrast threshold
Stimulus factors | Luminance Size Duration Color |
Retinal factors | Retinal location State of adaptation |
Optical factors | Ocular media Pupil size Refractive state |
Stimulus Factors
Stimulus Luminance
Bright stimuli are easier to detect than dim stimuli.
Stimulus luminance ranges from 10,000 apostilibs (asb) (brightest) to 0.08 asb (most dim).
This is over a total sensitivity range of 5.1 log units; each 0.1 log unit step is a decibel (dB).
Hence, sensitivity ranges from 0 (brightest) to 51 dB (most dim) [1].
Stimulus Size
Retinal Factors
Retinal Location: The Hill of Vision (Fig. 23.1)
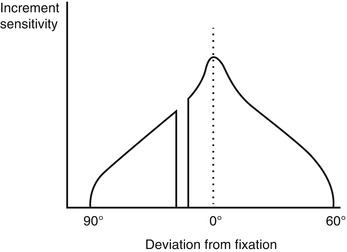
Fig. 23.1
The hill of vision along the horizontal meridian (2-dimensional representation)
Normal contrast sensitivity varies according to retinal location.
In photopic conditions contrast sensitivity is greatest at the center of the visual field, corresponding to the fovea centralis.
Contrast sensitivity reduces towards the periphery, described by a gradual slope or 3-dimensional “hill” of vision [12–14].
The rate of contrast sensitivity change determines the slope of the hill of vision.
There is a physiological scotoma, the “blind spot,” corresponding to the optic disc, located 15° temporal and slightly inferior to fixation.
Retinal Adaptation, Background Luminance, and Weber’s Law
Retinal adaptation influences contrast sensitivity across the field and is controlled by background luminance (L b) (see Chap. 21, Luminance Range for Vision).
That is, ΔL/L b remains constant (C); hence, as background luminance increases, so does the smallest detectable light stimulus.
A constant ΔL/L b allows more repeatable measurement of contrast threshold.
It provides ease in calibration, less sensitivity to fluctuations in light source output or pupil size.

Optical Factors (See Chap. 19, Visual Acuity)
Ocular Media
Media opacities scatter light, diffusing and skewing the light rays obliquely.
This results in less effective stimulation of photoreceptors and reduced contrast.
Pupil Size
Refractive State
Visual fields should be tested with full refractive correction and near correction for presbyopes.
Optical blur increases the point spread function of the light stimulus, reducing contrast.
Methods of Conducting Perimetry
Threshold Estimation Tests
Threshold tests determine the increment contrast threshold at specific visual field loci.
These can be broadly divided into kinetic and static techniques.
Kinetic Testing Techniques (e.g., with the Goldmann Perimeter)
Kinetic testing involves stimuli brought in from the far periphery towards fixation.
The location at which the stimulus is detected is documented along several meridian to generate an isopter; an isopter is a delineation of points of equal contrast threshold [21].
This is repeated for stimuli of different size and/or brightness allowing a series of isopters to be mapped to produce a representation of the hill of vision (Fig. 23.2) [22].
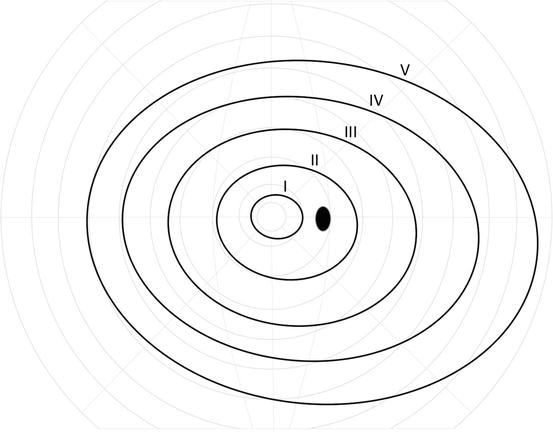
Fig. 23.2
Quantitative kinetic perimetry (e.g., with the Goldmann perimeter), with isopters derived using target sizes varying from V to I
Most kinetic testing is performed manually on a flat tangent screen or inside a Ganzfeld bowl [23]:
(a)
The tangent screen has a background luminance less than 31.5 asb, which is insufficient to maintain photopic conditions for Weber’s law.
Kinetic testing allows accurate characterization of the shape and slope of visual field defects and is effective at evaluating the far periphery [24].
Compared with static techniques, kinetic testing is often slow, labor intensive, and hence infrequently performed [25].
Static Testing Techniques (e.g., Humphrey automated perimetry)
Most static perimetric test procedures evaluate the central 24° or 30° of the visual field [26, 27].
Static tests involve stimuli of varying intensity at fixed locations.
Stimuli are shone inside a Ganzfeld bowl with background luminance 31.5 asb.
The minimum increment luminance detected by the subject is recorded at each locus and converted into sensitivity (in decibels).
Tests are automated, standardized, repeatable, and compared with an age-corrected normative database. This allows quantitative statistical determinations as to whether parameters are within normal limits.
Initial testing strategies involved staircase or bracketing strategy: stimulus luminance was increased in discrete steps until seen and then reduced in smaller steps until not seen [28, 33].
The Swedish Interactive Threshold Algorithm (SITA) is a more rapid estimation procedure than the older staircase methods with reduced test-retest variability.
Suprathreshold Screening Tests
All stimuli are greater than threshold and detectable by normal individuals.
Testing detects significant abnormalities in the visual field but may miss subtle scotomata.
Examples include confrontational field testing, and the binocular Esterman test for driving [36].
Interpretation of the Visual Field Printout
Figure 23.3 provides an example of single visual field analysis for a 24-2 SITA standard test using the Humphrey Field Analyzer.
Fig. 23.3
Single visual field analysis using the SITA Standard 24-2 Humphrey Field Analyzer
The components of the printout are discussed below.
Demographic Data and Test Information
The following information should be recorded:
(a)
Patient identification, age, test eye, and test date
(b)
Refractive state, pupil size, and visual acuity
(c)
Background luminance, size, and color of test stimuli
(d)
Fixation target and fixation monitoring method
(e)
Test strategy (e.g., SITA fast, SITA standard, or suprathreshold screening)
Reliability Indices
False-positive errors, false-negative errors, and fixation losses estimate test reliability [1, 2, 37–39].
False-Positive Errors
These are measured as patient responses when no stimulus is present.
A high false-positive rate implies a “trigger-happy” patient; it is indicative of low test reliability.
False-Negative Errors
These are failures to respond to stimuli brighter than a previously determined value at that location.
High false-negative error rate can be due to inattention, fatigue, or advanced field loss [40].
Fixation Losses
They imply a deviation of gaze from the central fixation target but may also indicate false-positive errors.
A high rate of fixation loss is indicative of poor test reliability.
Fixation can be monitored by an observer (telescope or video monitor), blink, or gaze tracking.
Numeric Values, Gray-scale Map, and Foveal Threshold
Numeric sensitivity values (in decibels) are provided for each visual field location.
This is converted into a gray-scale graphical representation of visual field sensitivity.
The gray-scale map provides an overall impression of the visual field.
The foveal threshold (in decibels) describes the numeric sensitivity value at fixation [43].
Total and Pattern Deviation Plots
The total deviation plot compares the patient’s values with an age-matched normal database.
The pattern deviation plot is similar to the total, except the overall height of the visual field is adjusted to correct for diffuse loss throughout the visual field.
This enables detection and monitoring of focal scotomata (e.g., from glaucoma) despite overall changes in sensitivity (e.g., due to media opacities or refractive error).
The significance of sensitivity loss for total and pattern plots reflects the probability of finding the detected sensitivity loss within the normative database. It is presented below each numeric chart; more dense stippling indicates increasing significance (p-values < 5 %, 2 %, 1 %, and 0.5 %).
Visual Field Indices
These are summary (global) statistics describing the general characteristics of the visual field.
Mean Deviation
The mean deviation (MD) is the average deviation from the age-corrected normal database for all tested points in the visual field.
If deviation is significant, a p-value is provided.
Visual Field Index
The visual field index (VFI) is similar to MD as a global indicator of the severity of field loss [44].
It summarizes each eye’s visual field as a percentage of normal age-corrected sensitivity.
Compared with MD the VFI [45]:
(a)
Is less affected by cataract and other media opacities
(b)
Has a closer correspondence to ganglion cell loss
(c)
Is more strongly weighed towards central rather than peripheral field loss
Pattern Standard Deviation
The pattern standard deviation (PSD) measures the irregularity of the slope of the hill of vision.
Stay updated, free articles. Join our Telegram channel

Full access? Get Clinical Tree


