Purpose
To review the progress and challenges in obtaining accurate corneal power measurements for intraocular lens (IOL) calculations.
Design
Personal perspective, review of literature, case presentations, and personal data.
Methods
Through literature review findings, case presentations, and data from the author’s center, the types of corneal measurement errors that can occur in IOL calculation are categorized and described, along with discussion of future options to improve accuracy.
Results
Advances in IOL calculation technology and formulas have greatly increased the accuracy of IOL calculations. Recent reports suggest that over 90% of normal eyes implanted with IOLs may achieve accuracy to within 0.5 diopter (D) of the refractive target. Though errors in estimation of corneal power can cause IOL calculation errors in eyes with normal corneas, greater difficulties in measuring corneal power are encountered in eyes with diseased, scarred, and postsurgical corneas. For these corneas, problematic issues are quantifying anterior corneal power and measuring posterior corneal power and astigmatism. Results in these eyes are improving, but 2 examples illustrate current limitations: (1) spherical accuracy within 0.5 D is achieved in only 70% of eyes with post–refractive surgery corneas, and (2) astigmatism accuracy within 0.5 D is achieved in only 80% of eyes implanted with toric IOLs.
Conclusion
Corneal power measurements are a major source of error in IOL calculations. New corneal imaging technology and IOL calculation formulas have improved outcomes and hold the promise of ongoing progress.
The cornea is the most important optical element of the human eye, and, despite its deceptive accessibility, clinicians encounter an array of challenges in acquiring the corneal optical data needed to optimize intraocular lens (IOL) selection. Surprisingly, only once have Jackson Lectures have addressed issues pertinent to this topic—in the first one delivered by W. H. Crisp in 1944. Entitled “Edward Jackson’s place in the history of refraction,” Crisp’s paper is an elegant history of progress in understanding and measuring refractive errors and of Jackson’s contributions to this progress. These include:
- 1)
Building on Stokes’ work describing a method of using 2 lenses to measure astigmatism ; Jackson’s development of the eponymous cross cylinder, first described in his 1887 presentation to the American Ophthalmological Society
- 2)
Jackson’s description of the change in corneal refractive power from center to periphery, presented to the American Ophthalmological Society meeting a year later; he called it “meridional astigmatism,” but it is certainly one of the first descriptions of ocular spherical aberration
- 3)
Jackson’s paper at the 1894 American Ophthalmological Society meeting in which he reported that corneal astigmatism differed from total ocular astigmatism in 75% of cases.
Since these early beginnings, our knowledge of corneal optics has exploded. Much of this progress occurred once we, first, acquired the ability to modify it: refractive surgery; and second—the topic of this paper—recognized the need to measure it: intraocular lens surgery.
In 2008, Norrby analyzed the sources of error in IOL power calculation by analyzing the precision of the biometric and clinical measurements. He concluded that the 3 greatest sources of error were effective lens position, postoperative refraction, and axial length, contributing 79% of the total error. However, he found that the total corneal contribution to IOL calculation error, which includes anterior and posterior power and asphericity, had a standard deviation of 0.22 diopter (D), which would translate to errors over 0.25 D in around 25% of eyes. As I will discuss, for many eyes, the cornea is a much larger source of error.
Advances in optical biometry have increased the accuracy of axial length measurements. Norrby’s study used the IOLMaster 500 (Carl Zeiss, Jena, Germany), and he cited a standard deviation (SD) of repeatability of 0.11 mm. The specification sheet for the Lenstar (Haag-Streit, Köniz, Switzerland), reports an SD of 0.035 mm or less (Lenstar technical specifications: http://www.haag-streit.com/product/biometry/lenstar-ls-900r/technical-specification.html ), and the SD for IOLMaster 700 is reported to be 0.009 mm ( http://www.zeiss.com/meditec/en_us/products—solutions/ophthalmology-optometry/cataract/diagnostics/optical-biometry/iolmaster-700.html#technical-data ). In 31 eyes scheduled to undergo cataract surgery, we found the SDs for axial length to be 0.010 mm for the Lenstar and 0.012 for the IOLMaster 700. This equates to dioptric errors of less than 0.05 D.
More persistent sources of error, therefore, are effective lens position and refraction. Effective lens position obviously cannot be measured preoperatively, but improvements in its estimation have occurred with inclusion in newer IOL calculation formulas of additional biometric data such as anterior chamber depth, lens thickness, and corneal diameter. Refraction is subject to myriad sources of variability, including patient responses, refractionists’ abilities, tear film status, chart distance, and ocular higher-order aberrations, especially spherical aberration and coma.
Despite these advances in technology and IOL calculation formulas, much is yet to be done. Referencing his database of over 260 000 operated eyes, Warren Hill reported that the percentage of eyes within 0.5 D of target refraction was: (1) equal to or less than 78% for over 90% of surgeons, (2) 79%–84% of eyes for up to 6% of surgeons, and (3) 89%–92% for fewer than 1% of surgeons (Charles Kelman Lecture, presented at the 2015 Annual Meeting of the American Academy of Ophthalmology). He described greatly improved accuracy using his new RBF formula. In a multicenter, prospective study of 467 eyes with axial lengths measuring between 20.97 mm and 29.10 mm, 91.0% of eyes were within 0.5 D of the target spherical equivalent. As excellent as these results are, it still means that 1 in 11 “normal” eyes will be off by more than 0.5 D. Worse outcomes are likely for the many outliers, among them very short eyes and eyes for which measuring the cornea is more problematic: ablated, incised, ectatic, and postkeratoplasty corneas. Another area in need of improved accuracy is astigmatism correction with toric IOLs, with recent studies showing predictive accuracy of ≤0.5 D for refractive astigmatism in around 80% of eyes.
A key step in improving the accuracy of our IOL calculations will be to obtain more accurate and comprehensive measurements of corneal power: in normal corneas, abnormal corneas, and corneas that have been surgically modified. The goal of this paper is, using illustrative actual cases, to review sources of error in our corneal measurements and the progress that is being made to rectify them. I categorize the problems into 3 sections based on fundamental optical properties of the cornea: spherical power, astigmatism, and higher-order aberrations. Institutional Review Board approval from Baylor College of Medicine was obtained for this work.
Determination of Corneal Spherical Power
Case 1: A Perfect Outcome
The patient in Case 1 had the perfect outcome ( Table 1 ), with an IOL prediction error of + 0.01 D.
| Preoperative refractive target (D) | −1.25 |
| Preoperative corneal power (D) | OLCR: 44.13 |
| IOL power calculation Predicted refraction with implanted 19.5 D IOL | With Holladay 1 formula: OLCR: −1.26 |
| Postoperative spherical equivalent refraction (D) | −1.25 sphere |
Factors that lead to a perfect outcome fall into 2 categories: (1) good science: accurate measurements, sophisticated IOL power formulas, and updated optimization of the formulas’ IOL constants; and (2) good fortune: measurement errors that fortuitously offset each other, IOL power exactly as labeled, and accurate assumed values for effective lens position and posterior corneal power. A less sanguine explanation is that the outcome was in fact not perfect, but the postoperative refraction incorrectly indicated the desired outcome.
Case 2: Variable Corneal Power Measurements With a Normal Cornea
The patient in Case 2 ( Table 2 ) wanted excellent reading vision without glasses. There was a disparity in the mean corneal power values, and the IOL power was selected based on the biometer’s higher value of 44.71 D. The patient was undercorrected postoperatively and upset with this outcome. Repeat biometry gave a corneal value of 44.04 D, which would have led to insertion of the IOL of desired power.
| Preoperative refractive target (D) | −1.75 |
| Preoperative corneal powers (D) | OLCR: 44.71 Color-LED: 44.50 Dual-Scheimpflug: 44.39 |
| IOL power calculation Predicted refraction with implanted 20.5 IOL (D) | With Holladay 1 OLCR: −1.45 Color-LED: −1.27 Dual-Scheimpflug: −1.18 |
| Postoperative spherical equivalent refraction (D) | −0.87 |
| Postoperative corneal power measurements (D) | OLCR: 44.04 Dual-Scheimpflug: 44.60 |
We used 3 imaging methodologies to measure this patient’s corneal curvature. Clinically available technologies for measuring anterior corneal curvature have included reflection, scanning slit imaging, Scheimpflug imaging, optical coherence tomography, and rasterstereography.
Reflection technology
Reflection methodologies use a range of light sources, including single mires (manual keratometry), Placido rings, and point-source light-emitting diodes (LED). Within each of these, variations exist. Manual keratometer light sources include circular mires and the unique mire pattern of the Javal device. Placido devices can have small, closely spaced mires or broader, more widely spaced mires, and measuring distances in various devices range from approximately 3 to 6 inches.
The software of these devices varies widely in the data that are routinely displayed and that can be accessed via software menus. The standard corneal power display is SimK, which in most devices is an attempt to mimic single-mire keratometry and is calculated from corneal curvature values along the 3-mm annular zone. However, for the dual Scheimpflug device (Galilei Dual Scheimpflug Analyzer; Ziemer, Port, Switzerland), SimK is the average of all values within the central 1- to 4-mm-diameter zone, calculated using a proprietary combination of Placido and Scheimpflug data.
Scanning slit
Scanning slit consists of measuring the width of a slit beam that is projected onto the cornea and rotated. The Orbscan (Bausch & Lomb, Inc, Rochester, New York, USA) is the only device that uses this methodology, and it was the first clinical device to provide posterior corneal curvature measurements. A later version of the Orbscan added wide-mire Placido to improve accuracy of anterior corneal measurements. The Orbscan is no longer being manufactured.
Scheimpflug imaging
Compared with scanning slit, Scheimpflug imaging methodology provides a more accurate means of measuring the thickness of optical sections of light passing through tissue. Because scanning is required to provide maximal corneal coverage, accurate eye tracking and correct registration of the scans are required. Both single-slit and dual-slit devices are available. Accuracy is within approximately 0.7 μm for edge detection.
Optical coherence tomography
Several devices now provide optical coherence tomography (OCT) measurements of corneal anterior and posterior curvature. OCT devices vary in the wavelength, number of meridians, number of scans per meridian, and the diameter of the cornea that is imaged. Evaluating a spectral-domain device, Li and associates reported repeatability of 1.3 μm for the central 2-mm zone and 1.8–2.8 μm for octants in the 2- to 5-mm zones. Theoretically, subpixel interpolation and transverse averaging or curve fitting could provide even greater repeatability (David Huang, personal communication).
Rasterstereography
With the rasterstereography methodology, after fluorescein dye is instilled on the cornea, the device projects a grid onto the corneal surface and measures the grid spacing to determine corneal height. The device using this technology is no longer being manufactured.
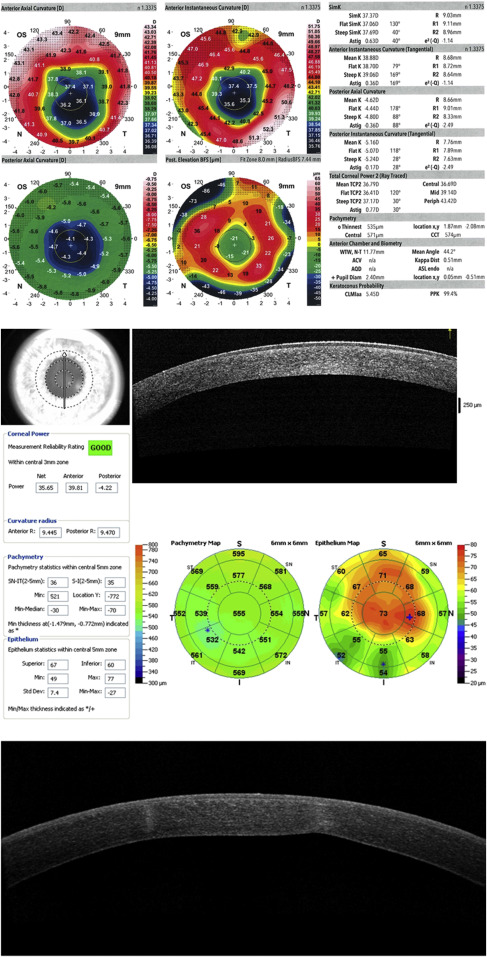
What can we expect regarding the accuracy and reproducibility of these devices? Causes of intradevice measurement variability include tear film abnormalities, corneal surface irregularities (such as epithelial basement membrane disease [ Figure 1 ] and subepithelial fibrosis), and technician error. These issues are likely to be magnified when comparing interdevice values.
Numerous studies have investigated the precision and comparability of devices for measuring corneal power. In eyes with normal corneas, we studied the repeatability of 3 measurements made by a single observer. Four device/software outputs were tested: Humphrey Atlas (Carl Zeiss) SimK, Galilei Dual Scheimpflug Analyzer (Ziemer) Sim K, IOLMaster 500 (Carl Zeiss), and manual keratometry (Bausch & Lomb, Inc, Rochester, New York, USA). As Table 3 indicates, the intradevice standard deviations and coefficients of variation were low, suggesting acceptable clinical repeatability. Interdevice differences were greater, albeit generally clinically acceptable, with 95% limits of agreement for mean corneal power ranging from 0.25 D for Galilei-IOLMaster to over 0.5 D for Atlas/manual keratometer and Atlas/Galilei. This magnitude of variability could certainly reduce the accuracy of IOL calculations.
| Analysis Type | Device | |||
|---|---|---|---|---|
| Dual Scheimpflug | Placido | PCI | Manual Keratometer | |
| CV (%) ± SD | 0.12 ± 0.07 | 0.22 ± 0.12 | 0.09 ± 0.07 | 0.18 ± 0.12 |
| SD (D) | 0.055 | 0.096 | 0.042 | 0.077 |
| ICC | 0.998 | 0.994 | 0.996 | 0.996 |
The commonly employed solution to mitigate errors from interdevice differences is to optimize lens constants based on corneal data from 1 device. However, one advantage of using more than 1 device is detection of erroneous measurements. Returning to our patient, the cause of the differences in the biometer’s preoperative and postoperative corneal measurements is unclear, and the preoperative similarities in the 3 devices’ measurements suggested that the corneal power readings were accurate and did not require being repeated. Further complicating the unraveling of this mystery is that the preoperative and postoperative dual-Scheimpflug measurements were nearly the same.
Obviously, concerns with device repeatability are equally relevant for measurements of corneal astigmatism. An excellent illustration of this was reported by Abulafia (Adi Abulafia, personal communication). Using 2 different optical biometers, he compared the repeatability of anterior corneal astigmatism measurements obtained in the same eyes 1 week apart. Two standard deviations of measurement differences were 0.15 D for one device and 0.28 D for the other. This is further evidence of the importance of caution and skepticism in trusting corneal measurements.
Case 3: Patient With a “Normal Cornea” Whose Posterior/Anterior Ratio Deviates From the Standard Value
The patient in Case 3 ( Table 4 ) had refractive prediction errors of −0.26 D and −0.29 D. Sources of this could of course include any error in the measurements or formula, particularly the estimation of effective lens position (ELP). The anterior corneal measurements were consistent, but this does not rule out the cornea as the cause of the error.
| Preoperative corneal power (D) | OLCR: 41.04 Dual Scheimpflug: 41.46 |
| Preoperative corneal radii with dual Scheimpflug | Anterior: 8.14 mm Posterior: 6.95 mm Posterior/anterior ratio 0.85 |
| Predicted refraction with implanted 21.5 D IOL | Holladay1: −0.11 Barrett: −0.08 |
| Postoperative spherical equivalent refraction (D) | −0.37 |
IOL calculations are routinely performed using only anterior corneal curvature measurements, assuming for normal corneas a constant ratio between the anterior and posterior curvatures. A standardized index, which is an artificially determined value, is used to convert anterior corneal values to total corneal power. In devices used in the United States, the value is 1.3375. In some countries, notably Germany, it is 1.336. These indices actually give corneal power values that are around 1 D higher than true corneal power. IOL calculation formulas solve this problem by converting corneal power values back to radius of curvature, using their own values for index of refraction, and incorporating a lens constant as a “fudge factor” to compensate for this, IOL optical features, and ELP.
Although the posterior cornea has a smaller radius of curvature than the anterior cornea, posterior corneal power is roughly 10 times lower than anterior corneal power (in absolute terms) owing to difference in adjacent media. There is a 0.04 difference in refractive index between the cornea (1.376) and aqueous humor (1.336), compared with the 0.376 difference between the anterior cornea and air.
Surprisingly (at least to me), it remains clinically challenging to measure posterior corneal curvature. Three technologies are currently available for clinical use: Scheimpflug, OCT, and reflection (by the color LED device). Since we cannot directly measure posterior corneal curvature, there is no gold standard. However, device data can be evaluated for precision, for comparability to other devices, and for clinical accuracy in IOL calculations. Using the dual Scheimpflug and color LED devices, we have found intradevice within-subject SDs for repeated measurements of 0.04 D and 0.16 D, respectively, and interdevice differences of −0.08 D between Galilei and Cassini.
A number of studies have evaluated the ratio of posterior to anterior curvatures. Gullstrand’s original ratio of 0.883, which converts to a standardized index of 1.3315, is now recognized to be too high. Using Scheimpflug photography, Dubbelman and associates calculated a mean ratio of 0.81. In our studies using the dual Scheimpflug and color LED devices, we found similar values for normal eyes, slightly lower values for myopic laser in situ keratomileusis (LASIK)/photorefractive keratectomy (PRK) corneas, and slightly higher for hyperopic LASIK/PRK corneas ( Table 5 ). Not surprisingly, however, we have seen variability in this ratio even for normal corneas of 0.80–0.86, representing a dioptric range of around 0.5 D. Thus, if we calculate IOL power using the mean, errors of up to 0.25 D can occur. Although this may seem small, if coupled with another measurement or calculation error in the same direction, it could produce a clinically relevant deviation from the intended refractive target.
| Anterior (Mean ± SD) | Posterior (Mean ± SD) | Ratio (Posterior/Anterior) | Standardized Index | |
|---|---|---|---|---|
| Gullstrand’s schematic eye | 7.7 | 6.8 | 0.883 | 1.3315 |
| Normal (n = 94) | 7.69 ± 0.24 | 6.27 ± 0.25 | 0.816 | 1.3278 |
| Myopic LASIK/PRK (n = 61) | 8.29 ± 0.34 | 6.34 ± 0.26 | 0.765 | 1.3246 |
| Hyperopic LASIK/PRK (n = 9) | 7.46 ± 0.14 | 6.40 ± 0.17 | 0.857 | 1.3302 |
| Data from Dubbelman et al | 7.87 ± 0.27 | 6.40 ± 0.28 | 0.81 | 1.3277 |
In the case of this patient, the posterior/anterior ratio was 0.85, which is higher than anticipated. This indicates that the posterior cornea has relatively less minus power than predicted by the standard ratio. Corneal power calculated from the anterior surface using the standard ratio was 41.46 D; correcting for the true posterior/anterior ratio gives a value of 41.74, which accounts for the overcorrection.
Case 4: Post–Laser In Situ Keratomileusis Case
The patient in Case 4 ( Table 6 ) had over a 2 D range in the IOL power predicted by various formulas. The causes include greater variability of anterior corneal power in the central 4 mm, interdevice differences, different formula assumptions, and difficulty in accurately measuring posterior corneal curvature, which is a much greater problem in eyes such as this whose corneas are not “normal.”
| Preoperative corneal powers (D) | OLCR: 34.41 PCI: 34.53 Placido: 34.70 Dual-Scheimpflug TCP: 32.07 |
| IOL power calculation Predicted refraction with implanted 28.0 D IOL | Wang-Koch-Maloney: −0.70 Shammas: −0.06 Haigis-L: +0.35 Galilei: +0.00 OCT: −1.39 Barrett True K no History: −1.50 |
| Intraoperative aberrometry Predicted refraction with implanted 28.0 D IOL | −0.31 |
| Postoperative spherical equivalent refraction (D) | −2.00 |
Procedures that remove corneal stromal tissue—corneal subtraction procedures (ablative [LASIK and PRK] and excisional [intrastromal lenticle removal])—change anterior corneal curvature, but data suggest that the posterior cornea is relatively unchanged (less than 0.1 D). For corneas that have undergone radial keratotomy, the posterior corneal curvatures change, but in unpredictable ways. As a result, measurements of only the anterior cornea cannot be used to calculate total corneal power. This problem was first described by Holladay. Koch and associates published the first article describing clinical cases in which this problem was demonstrated.
The change in corneal power introduces a second problem for those formulas that use corneal power in their formulas for estimating ELP, as the surgically modified corneal power will lead to incorrect calculation of ELP. The problem with ELP calculation was recognized by Holladay in his Holladay Consultant Program and by Aramberri, who described the “double-K” approach, in which current corneal power is used for the vergence calculation and the real or an assumed pre-LASIK K is used to calculate ELP. Koch and Wang published tables showing how to manually correct for this problem. Fortunately, solutions for this are included in the ASCRS Post-Refractive Surgery Calculator and in formulas such as the aforementioned Holladay program and the Barrett True-K.
Much work has been done to try to accurately calculate true refractive power of ablated corneas. The range of proposed methods is remarkable, as no single method or even combination of methods matches the accuracy that we achieve with standard IOL calculations. These approaches have used various combinations of historical data, regression analysis, and measurements obtained immediately before or during surgery.
Because of the large number of approaches that have been devised, spreadsheets containing several methods have been developed. The Post-Refractive IOL Calculator on the website of the American Society of Cataract and Refractive Surgery (ASCRS) originally categorized methods into 3 groups:
- 1)
Methods relying on prior clinical data. Two approaches have been used: estimated corneal power is calculated by subtracting the surgically induced refractive change from the pre-LASIK corneal power (as originally described by Holladay ), or IOL power is calculated using the pre-LASIK K readings, and IOL power is modified based on the magnitude of the surgically induced refractive change. Theoretically, these formulas should be extremely accurate, but clinical studies have not borne this out. The problem lies in their sensitivity to errors in the historically obtained data: a 1 D error in either the keratometric or refractive values translates to a nearly 1 D error in the calculated IOL power. These errors could be caused by a number of factors, including technician error in measuring either corneal readings or refraction, a keratometer that was out of calibration, and refractive change determined either before the cornea had fully stabilized or after the cataract had altered the refractive error. With reported accuracy of less than 60% within 0.5 D, these methods have been removed in the most recent iteration of the ASCRS calculator.
- 2)
Methods that use a combination of the surgically induced refractive change and current corneal power values obtained at the time the patient presents for surgery. These approaches multiply the surgically induced refractive change by some fraction, between 0.14 and 0.33 depending on the formula, and use this value to modify either the corneal power used for IOL calculations or the IOL power after it has been calculated using standard formulas. Some of these methods have consistently been among the more accurate approaches.
- 3)
Methods that use only measurements obtained when the patient presents for surgery and therefore require no historical data. These methods have been shown to perform as well as those in the second category. They fall into 2 categories: (1) regression formulas that adjust measured corneal power based on analyses of prior data, and (2) formulas based on total corneal power measurements provided with either Scheimpflug or OCT technology. Aspirationally, the latter would seem to be more promising because it uses the patient’s actual data and not an average value obtained by regression. In a study of 104 post-LASIK/PRK eyes that underwent cataract surgery, Wang and associates compared an OCT-based formula to 4 others: Barrett True-K No History, Wang-Koch-Maloney, Shammas, and Haigis-L. The median refractive prediction error of 0.35 for the OCT formula was significantly lower than the values of 0.48 and 0.51 for the Shammas and Wang-Koch-Maloney. However, the percentage of eyes within 0.5 D of target refraction was under 70% for all formulas, the highest value being 68.3% for the OCT formula. Obviously, further progress is needed.
Aphakic refraction is a fourth approach that has the advantage of incorporating total corneal power in the calculation. Intraoperative retinoscopy and autorefraction were tried initially, but an important recent advance has been the use of intraoperative aberrometry. Following removal of the crystalline lens, the aberrometer obtains an aphakic refraction, and proprietary formulas use this information plus biometric data to calculate IOL power. These formulas are vergence-based but are modified using prior group and surgeon-specific outcomes; hence regression is again involved. Comparing results in 39 eyes of intraoperative aberrometry, OCT, and the Haigis-L formula, Fram and associates reported refractive prediction accuracies of ±0.5 D in 74%, 72%, and 69% of eyes, respectively, still well below Hill’s recent data in normal eyes and, of course, patients’ expectations.
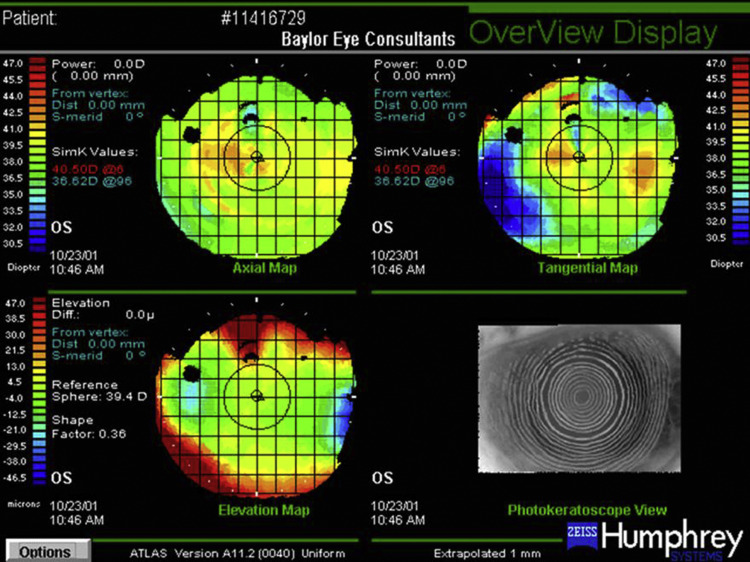
IOL calculation in eyes that have undergone radial keratotomy is even more difficult owing to the greater irregularity of the anterior corneal curvature and the posterior corneal curvature changes that are themselves irregular and difficult to characterize ( Figure 2 ). Ma and associates compared the accuracy of the double-K Holladay 1, OCT, and Barrett True K formulas in 26 eyes seen 4 or more months following cataract surgery. The percentages of eyes within 0.5 D and 1.0 D of predicted refraction were 62% and 69%, 38% and 77%, and 38% and 62% for each formula, respectively. Further complicating lens selection for eyes that have undergone radial keratotomy are the high incidence of diurnal fluctuation and progressive hyperopic shift due to long-term corneal flattening.