Purpose
To conduct a systematic review and meta-analysis of the association between blood pressure levels and hypertension with primary open-angle glaucoma and intraocular pressure endpoints.
Design
Systematic review with quantitative meta-analysis.
Methods
Studies were identified by searching the PubMed and EMBASE databases. Inverse-variance weighted random-effects models were used to summarize relative risks. Subgroup analyses and meta-regression were used to explore potential sources of heterogeneity across studies.
Results
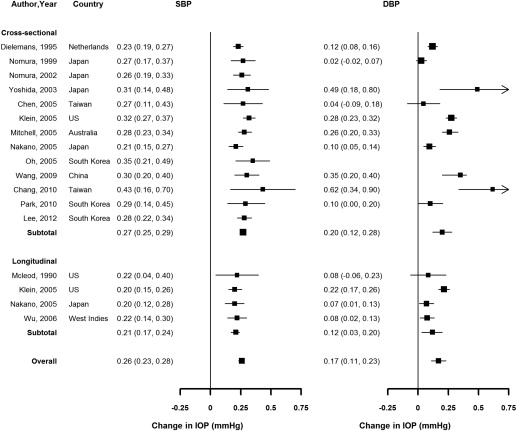
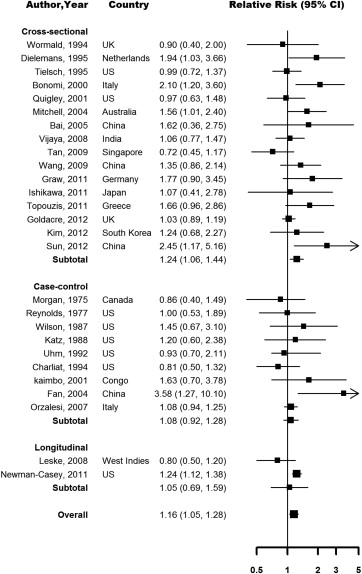
Sixty observational studies were included. The pooled relative risk for primary open-angle glaucoma comparing patients with hypertension to those without hypertension was 1.16 (95% CI = 1.05–1.28), with modest heterogeneity across studies ( I 2 34.5%). Virtually all studies reported a positive association between blood pressure and intraocular pressure (IOP). The pooled average increase in IOP associated with a 10 mm Hg increase in systolic blood pressure was 0.26 mm Hg (95% CI 0.23–0.28, I 2 30.7%), and the average increase associated with a 5 mm Hg increase in diastolic blood pressure was 0.17 mm Hg (95% CI 0.11–0.23, I 2 90.5%).
Conclusions
In this meta-analysis, hypertension was associated with increased intraocular pressure. The association between hypertension and primary open-angle glaucoma was stronger in cross-sectional compared with case-control and longitudinal studies. Our findings support a role of increased blood pressure in elevated intraocular pressure and possibly in the development of glaucoma.
Glaucoma is the leading cause of irreversible blindness, affecting more than 60 million people worldwide. The risk and prognosis of primary open-angle glaucoma (POAG), the most common type of glaucoma, is influenced by demographic factors such as age, race, and family history, and by several ocular parameters including myopic refractive error, optic disc shape, and corneal thickness. Increased intraocular pressure (IOP) is the most important modifiable risk factor for POAG, but there is substantial interest in identifying other potentially modifiable risk factors.
Systemic hypertension may contribute to increased IOP via overproduction or impaired outflow of aqueous humor. Some but not all population studies have found statistically significant positive associations of systolic blood pressure (SBP) and diastolic blood pressure (DBP) with IOP. Furthermore, the literature on the association between blood pressure (BP) and POAG is limited and inconsistent. Qualitative reviews have summarized the evidence on BP, IOP, and glaucoma, but these reviews did not conduct systematic searches of the literature to incorporate all relevant studies and did not produce quantitative estimates of the associations. In addition, most studies included in these reviews were published before 2005. The objective of this meta-analysis was thus to summarize and quantitatively synthesize available literature on the association of BP with IOP and POAG.
Materials and Methods
Search Strategy
Our systematic review and meta-analysis was conducted according to the Meta-analysis of Observational Studies in Epidemiology (MOOSE) guidelines. To identify relevant studies, we searched MEDLINE and EMBASE for observational studies investigating the relation of BP or hypertension with POAG, IOP, or ocular hypertension (OHT), with no restrictions on language or publication date. The search period was through April 2013. Keywords included systolic blood pressure, diastolic blood pressure, blood pressure, hypertension, intraocular pressure, intraocular tension, eye pressure, eyeball pressure, eye internal pressure, intraorbital pressure, ocular pressure, ocular tension, intraocular hypertension, intraocular tension, and glaucoma. In addition, we manually reviewed the reference lists from relevant original research.
Study Selection
We aimed to identify all relevant observational studies that assessed the association of BP or hypertension with IOP, OHT, or POAG in general population settings. We applied the following exclusion criteria: (1) reviews, editorials, or letters; (2) case reports or case series; (3) studies not conducted in humans; (4) studies not conducted in adults; (5) studies conducted in population samples composed only of patients with established glaucoma or ocular hypertension at baseline; (6) studies not reporting glaucoma, IOP, or OHT outcomes; (7) studies not using BP or hypertension as exposure; (8) studies investigating mainly drug effects or metabolism; and (9) studies of populations with specific conditions (eg, pregnancy or eye surgery) that limit their generalizability to general population samples. Furthermore, since age is a strong risk factor for glaucoma and for hypertension development, we further excluded studies that did not adjust for age in the design or the analysis.
For studies that did not report POAG separately from other types of glaucoma, we used results for open-angle glaucoma or glaucoma as endpoints. For studies that reported both cross-sectional associations at baseline and prospective longitudinal associations, we included both associations separately by design. If more than 1 paper reported on the same association within a study population, we selected the publication with the largest sample size or the longest follow-up. Several studies reported estimates of measures of association without standard errors or any other estimates of statistical variability. These studies were included in the systematic review but were excluded from the quantitative meta-analysis.
Data Extraction and Quality Assessment
Two investigators (D.Z. and M.K.) independently reviewed all search results to identify eligible papers and abstracted data from selected articles, including study design, study population, age and sex distribution, sample size, study outcomes, duration of follow-up, exposure and outcome assessment, main results, and variables included in the adjusted model. Discrepancies between reviewers were solved by consensus. We assessed the risk of bias in studies using the methods described by Sanderson and associates and Viswanathan and associates. We examined the methods for selecting study participants, the criteria for defining exposures and outcomes, the risk of bias associated with different designs, the methods used to control for confounding, and potential conflicts of interest.
Statistical Analysis
The study endpoints were POAG, IOP, and OHT. We used as many endpoints as reported in each study and conducted separate meta-analyses for each endpoint ( Table ). For hypertension, we combined hazard ratios, odds ratios, and relative risks for POAG or OHT, comparing participants with vs those without hypertension, and average differences in IOP (in mm Hg) comparing participants with vs those without hypertension. For SBP and DBP, we combined hazard ratios, odds ratios, or relative risks for POAG or OHT associated with an increase of 10 mm Hg for SBP and of 5 mm Hg for DBP, and average differences in IOP (in mm Hg) associated with an increase of 10 mm Hg for SBP and of 5 mm Hg for DBP. These measures of association and their 95% confidence intervals (CIs) were abstracted or derived from published data. For studies reporting standardized regression coefficients, we used the standard deviations for BP and IOP reported for that population to recalculate unstandardized regression coefficients. Finally, for studies reporting measures of association based on log-transformed SBP or DBP, we calculated the measures of association based on 10 and 5 mm Hg increases in SBP or DBP, respectively, calculated from the population mean.
| First Author, Year | Country | Population | Setting | Sample Size | Recruit (Follow-up) Year | Exposure | Outcome | IOP Measure | Mean Age/Range (y) | Mean IOP (mm Hg) | Prevalence of POAG/OHT (%) |
|---|---|---|---|---|---|---|---|---|---|---|---|
| Cross-sectional | |||||||||||
| Leske, 1983 | USA | Framingham Heart Study and Framingham Eye Study | Community | 2433 | 1975 | HTN | OHT | GAT | NA | NA | NA |
| David, 1987 | Israel | Participants from urban areas in southern Israel | Health screening examination | 2594 | 1984 | HTN | OHT | GAT | 40–79 | 15.0 | NA |
| Wormald, 1994 | UK | African Caribbean immigrants living in London | Community | 873 | 1991 | HTN | Glaucoma | NA | >35 | NA | 3.5 |
| Dielemans, 1995 | Netherlands | The Rotterdam Study | Community | 4187 | 1993 | SBP, DBP | IOP | GAT | 55–95 | 14.6 | NA |
| Tielsch, 1995 | USA | The Baltimore Eye Survey | Community | 5308 | 1988 | SBP, DBP, HTN | POAG | NA | >40 | NA | 3% |
| Nomura, 1999 | Japan | Office workers and their family members | Health screening examination | 68 998 | 1997 | SBP, DBP | IOP | NCT | 20–79 | 11.8 | NA |
| Bonomi, 2000 | Italy | The Egna-Neumarkt Study | Community | 4297 | NA | HTN | POAG | NA | 40–89 | NA | 1.4 |
| Quigley, 2001 | USA | Hispanics in Arizona | Community | 4774 | 1990 | SBP, DBP, HTN | OAG | GAT | >40 | 15.6 | 2 |
| Nomura, 2002 | Japan | National Institute for Longevity Sciences–the Longitudinal Study of Aging program (NILS-LSA) | Community | 1317 | 1999 | SBP, DBP | IOP | NCT | 40–80 | 13.5 | NA |
| Yoshida, 2003 | Japan | Participants from a general hospital | Health screening examination | 569 | 2000 | SBP, DBP | IOP | NCT | 29–79 | 12.9 | NA |
| Mitchell, 2004 | Australia | The Blue Mountains Eye Study | Community | 3654 | 1994 | HTN | OAG | GAT | 66.2 | NA | 3 |
| Bai, 2005 | China | Participants in rural province in China | Community | 1775 | 2003 | HTN | POAG | PAT | 50–91 | NA | NA |
| Chen, 2005 | Taiwan | Hospital-based healthy subjects | Health screening examination | 1271 | 2001 | SBP, DBP | IOP | NCT | 50.0 | 13.6 | NA |
| Mitchell, 2005 | Australia | The Blue Mountains Eye Study | Community | 3302 | 1994 | SBP, DBP | IOP | PAT | 49–97 | NA | NA |
| Oh, 2005 | South Korea | Healthy visitors to health promotion center | Health screening examination | 943 | 2003 | SBP | IOP | NCT | 45.8 | 15.4 | NA |
| Hulsman, 2007 | Netherlands | The Rotterdam Study | Community | 5317 | 1993 | SBP, DBP | OAG | GAT | 68.8 | 16.0 | 4 |
| Vijaya, 2008 | India | The Chennai Glaucoma Study | Community | 3850 | 2004 | HTN | POAG | GAT | 54.8 | 15.2 | 3.5 |
| Tan, 2009 | Singapore | The Singapore Malay Eye Study | Community | 3280 | 2006 | SBP, DBP, HTN | POAG | GAT | 58.7 | NA | 3.2 |
| Wang, 2009 | China | The Beijing Eye Study | Community | 3222 | 2006 | HTN | POAG | NCT | 60.4 | 15.7 | 2.4 |
| Chang, 2010 | Taiwan | University hospital | Health screening examination | 1044 | 2006 | SBP, DBP | IOP | NCT | 50.8 | 14.5 | NA |
| Imai, 2010 | Japan | General hospital | Health screening examination | 14 003 | 2008 | HTN | OHT | NCT | 18–83 | 14.8 | NA |
| Memarzadeh, 2010 | USA | Los Angeles Latino Eye Study | Community | 6130 | 2003 | SBP, DBP | OAG | GAT | 54.7 | 14.2 | 4.7 |
| Park, 2010 | South Korea | Kyunggi Province | Community | 446 | 2008 | SBP, DBP | IOP | NCT | 41.6 | 12.4 | NA |
| Graw, 2011 | Germany | KORA Eye Study | Community | 2593 | 1999 | HTN | Glaucoma | NA | 32–71 | NA | 1.5 |
| Ishikawa, 2011 | Japan | Subjects attending community health screenings | Health screening examination | 710 | 2007 | HTN | POAG | GAT | >30 | 15.1 | 3.7 |
| Topouzis, 2011 | Greece | Thessaloniki Eye Study | Community | 2261 | 1999 | HTN | POAG | GAT | 70.4 | 15.9 | 6 |
| Goldacre, 2012 | UK | Analysis of the Oxford Record Linkage Study (ORLS) and English Linked Hospital Episode Statistics (LHES) | Community | 94 591 | ORLS: 1963–1998 | HTN | Glaucoma | NA | 0–80+ | NA | 1.1 |
| LHES: 1999–2010 | |||||||||||
| Kim, 2012 | South Korea | Survey of local residents | Community | 1464 | 2006 | HTN | POAG | GAT | 63.7 | 13.5 | 3.8 |
| Lee, 2012 | South Korea | Healthy Twin Study | Community | 3096 | 2005 | SBP | IOP | NCT | 37.8 | 13.7 | NA |
| Sun, 2012 | China | Villagers | Community | 4956 | NA | HTN | POAG | PAT | >40 | 14.0 | 0.7 |
| Case-control | |||||||||||
| Morgan, 1975 | Canada | Cases drawn from University of British Columbia, and from a private practitioner with a large glaucoma referral practice | Hospital outpatient clinic | 91 cases, 91 controls | NA | HTN | POAG, OHT | NA | NA | NA | NA |
| Reynolds, 1977 | USA | Records from pathology clinic | Hospital outpatient clinic | 87 cases, 87 controls | 1975 | HTN | OAG | NA | ≥18 | NA | NA |
| Wilson, 1987 | USA | Patients from General Eye Service of the Massachusetts Eye and Ear Infirmary | Community | 121 cases, 237 controls | 1984 | SBP, HTN | POAG | NA | NA | NA | NA |
| Katz, 1988 | USA | Patients from Wilmer Institute, Johns Hopkins Hospital | Hospital outpatient clinic | 94 cases, 94 controls | NA | SBP, DBP, HTN | Glaucoma | GAT | NA | NA | NA |
| Uhm, 1992 | USA | Patients from Kresge Eye Institute | Hospital outpatient clinic | 361 cases, 927 controls | NA | HTN | POAG | GAT | 65.5 | NA | NA |
| Charliat, 1994 | USA | Patients from private practice and public hospitals | Hospital outpatient clinic | 175 cases, 175 controls | 1994 | HTN | POAG | GAT | 65.7 | 16.9 | NA |
| kaimbo, 2001 | Congo | Patients from an ophthalmologic clinic | Hospital outpatient clinic | 40 cases, 104 controls | 1997 | SBP, DBP, HTN | OAG | GAT | 28–81 | 19.3 | NA |
| Fan, 2004 | China | Patients from a hospital | Hospital outpatient clinic | 32 cases, 96 controls | 2000 | HTN | POAG | GAT | 32–71 | 20.6 | NA |
| Orzalesi, 2007 | Italy | Patients from outpatient clinic | Hospital outpatient clinic | 2879 cases, 973 controls | NA | HTN | POAG | GAT | 67.2 | 16.2 | NA |
| Longitudinal | |||||||||||
| Mcleod, 1990 | USA | Baltimore Longitudinal Study of Aging | Community | 572 | 1966, 6 y follow-up | SBP, DBP | IOP | ST | 19–89 | 16.1 | NA |
| Hennis, 2003 | West Indies | Barbados Eye Study | Community | 2996 | 1988, 4 y follow-up | HTN | IOP | GAT | 57.5 | 18.4 | NA |
| Klein, 2005 | USA | Beaver Dam study | Community | 4926 | 1990, 5 y follow-up | SBP, DBP | IOP | GAT | 60.4 | 15.4 | NA |
| Nakano, 2005 | Japan | Male aircraft crew members | Community | 2330 | 1985, 5 y follow-up | SBP, DBP | IOP | GAT | 35.9 | 13.8 | NA |
| Wu, 2006 | West Indies | Barbados Eye Study | Community | 2298 | 1992, 9 y follow-up | SBP, DBP | IOP | GAT | 55.1 | 17.5 | NA |
| Leske, 2008 | West Indies | Barbados Eye Study | Community | 3222 | 1992, 9 y follow-up | SBP, DBP, HTN | OAG | NA | 56.9 | 18.0 | NA |
| Newman-Casey, 2011 | USA | InVision Data Mart database | Community | 2 182 315 | 2001, 6 y follow-up | HTN | OAG | NA | 54.5 | NA | Incidence: 2.5 |
When several models for a given endpoint were reported in the same study, we selected the maximally adjusted model. For studies reporting results separately by subgroups (eg, men and women, hypertension with and without medication, hypertension only and with other diseases, or participants from different locations), we used each group as an independent result for the meta-analyses. For studies reporting both overall and subgroup results, we used overall estimates.
We used DerSimonian and Laird’s random-effects models to calculate summary relative risks across studies. Between-study heterogeneity was quantified using the I 2 statistic, which describes the proportion of total variation in study estimates attributable to heterogeneity. We also assessed the relative influence of each study by omitting 1 study at a time from the pooled analysis. Publication bias was evaluated using funnel plots and Egger’s tests. The funnel plots depict the distribution of the measures of association vs their standard errors. The null hypothesis of Egger’s test is that the regression of measures of association over their standard error has an intercept of zero. The rejection of the null hypothesis ( P < .05) suggests that the measures of association depend on the study sample size, which may reflect publication bias. We assessed heterogeneity of the association of hypertension or BP with study outcomes by study type (case-control, cross-sectional, longitudinal), location (Europe, America, Asia, others), and year of publication (<2000, ≥2000) using meta-regression with restricted maximum likelihood estimates of between-study variance. We did additional meta-regression by adjustment for IOP (Yes, No) and adjustment for central corneal thickness (Yes, No).
Studies presenting measures of association for BP in 3 or more categories or as continuous exposures were also combined using a random-effects dose-response meta-analysis. One study reporting the dose-response association between BP and POAG was excluded because of the small number of POAG cases in each BP interval. All statistical analyses were conducted with Stata version 12 (STATA Corp, College Station, Texas, USA).
Results
Study Characteristics
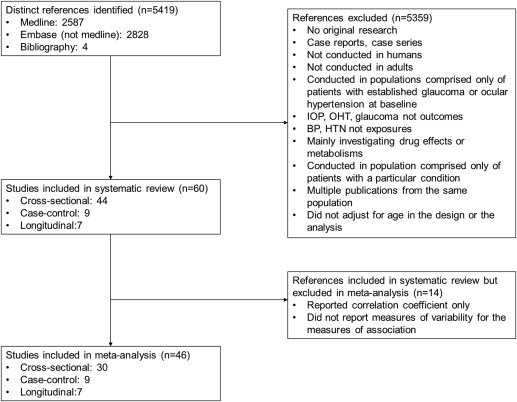
We identified 60 studies (44 cross-sectional, 9 case-control, and 7 longitudinal cohort studies) that met our inclusion criteria ( Figure 1 , Supplementary Table 1 , available at AJO.com ). Twenty-six studies were performed in Asia, 13 in the United States, 9 in Europe, 3 in the West Indies, 3 in Australia, 3 in Canada, 2 in the Middle East, and 1 in Congo. The prevalence of POAG in cross-sectional studies ranged from 0.7% to 9%. The number of studies that presented quantitative estimates and 95% CIs that could be incorporated in our meta-analysis was 29 for POAG (27 with estimates for hypertension, 10 for SBP, and 8 for DBP), 5 for OHT (4 with estimates for hypertension, 1 for SBP, and 1 for DBP), and 18 for IOP (3 for hypertension, 17 for SBP, and 14 for DBP).
POAG, open-angle glaucoma, and glaucoma criteria differed across studies. To identify and define glaucoma cases, 9 studies considered characteristics of the optic disc, anterior chamber angle, optic nerve damage, or visual field changes; 14 studies also considered OHT as an additional criterion; 2 studies used self-reported glaucoma; 1 study used medical history records; and 1 study used ICD-9 codes from a medical database. Among the studies that assessed the association between BP and IOP, 5 measured IOP using a Goldmann applanation tonometer, while the rest used noncontact tonometers, Schiotz tonometers, or handheld tonometers. The average IOP of the study populations ranged from 11.5 to 16.1 mm Hg ( Table ). For studies reporting OHT as an outcome, 1 study defined OHT as IOP >20 mm Hg, 1 as IOP ≥21 mm Hg, and 3 as IOP >21 mm Hg. The studies also differed in their definition and ascertainment methods for hypertension ( Supplementary Table 2 , available at AJO.com ) and in the covariates adjusted for ( Supplementary Table 3 , available at AJO.com ).
Primary Open-Angle Glaucoma
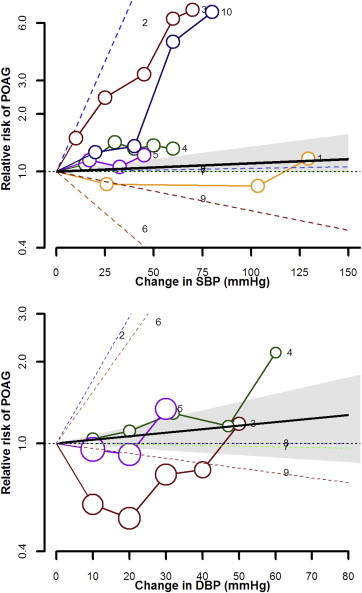
The association between hypertension and POAG was heterogeneous across studies. Eighteen studies reported a positive association and 9 studies reported an inverse or null association. Seven studies adjusted for IOP and 2 studies adjusted for central corneal thickness (CCT) in their analysis. The pooled relative risk (RR) for POAG comparing participants with vs those without hypertension was 1.16 (95% CI 1.05–1.28), with modest across-study heterogeneity ( I 2 34.5%) ( Figure 2 ). The pooled RR was significant for cross-sectional studies (1.24, 95% CI 1.06–1.44), but it was smaller and not statistically significant for case-control (1.08, 95% CI 0.92–1.28) and longitudinal studies (1.05, 95% CI 0.69–1.59), although only 2 longitudinal studies contributed to the pooled estimates. The overall pooled RR in sensitivity analysis based on studies that defined POAG without using IOP as a diagnostic criterion was 1.14 (1.03–1.25, I 2 24.0%). In dose-response meta-analysis of studies that presented data using 3 or more categories of BP or that reported BP as a continuous exposure, the pooled RR for POAG associated with a 10 mm Hg increase in SBP was 1.01 (95% CI 1.00–1.03, I 2 26.1%) and the pooled RR associated with a 5 mm Hg increase in DBP was 1.02 (95% CI 0.99–1.04, I 2 25.9%) ( Figure 3 ).
Intraocular Pressure
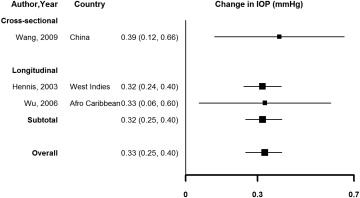
Virtually all studies reported a positive association or correlation between SBP, DBP, and IOP ( Figure 4 , Supplementary Table 4 , available at AJO.com ). The pooled average increase in IOP associated with a 10 mm Hg increase in SBP was 0.26 mm Hg (95% CI 0.23–0.28, I 2 42.5%), and the average increase associated with a 5 mm Hg increase in DBP was 0.17 mm Hg (95% CI 0.11–0.23, I 2 91.2%), with similar results in cross-sectional compared to longitudinal studies. The pooled average difference in IOP comparing participants with vs those without hypertension was 0.33 mm Hg (95% CI 0.25–0.40, I 2 0%), although this estimate was based on only 3 studies ( Figure 5 ).