Purpose
To determine if small hard drusen in patients with basal laminar drusen show short-term changes.
Design
Prospective observational case series.
Methods
Ten subjects with basal laminar drusen were longitudinally followed during a period of 4 months by spectral-domain optical coherence tomography. Drusen that showed a spontaneous change in volume were further analyzed according to 5 morphologic parameters: shape, reflectivity, homogeneity, and concurring photoreceptor layer/retinal pigment epithelium damage. Odds ratios (OR) and risk for regression and progression of drusen volumes were calculated.
Results
One hundred and five small hard drusen in 19 eyes showed a spontaneous change in volume over the period of follow-up. Drusen with a “pointed” shape were significantly associated ( P = .031; OR 4.89; 95% confidence interval [CI] 1.16−20.67) with spontaneous progression in drusen volume, with a chance of 0.80 (95% CI 0.55−0.93) to progress. Drusen that showed a decreased reflectivity of overlying photoreceptor layer ( P = .041; OR 7.67; 95% CI 1.09−54.24) or retinal pigment epithelium ( P = .022; OR 12.38; 95% CI 1.44−106.57), showed a significant association with spontaneous regression in drusen volume, with chances of regression of 0.86 (95% CI 0.41−0.98) and 0.89 (95% CI 0.49−0.99), respectively.
Conclusion
Small hard drusen in patients with the basal laminar drusen phenotype are subject to a process of short-term remodeling. The dynamic nature of this disease points to high biochemical activity that may be sensitive to future pharmacologic treatment strategies. In addition, these short-term changes of drusen may be a source of misclassification in disease staging.
Macular drusen are the hallmark lesions of age-related macular degeneration (AMD). They are identified on ophthalmoscopy as focal yellow-white subretinal deposits, which are pathologic extracellular deposits between the basal lamina of the retinal pigment epithelium (RPE) and the inner collagenous layer of Bruch membrane. Drusen contain a wide variety of compounds that appear to reflect the complex pathogenesis of AMD. Important constituents of drusen are neutral lipids, carbohydrates, zinc, and a wide variety of proteins. Many proteins found in drusen are associated with inflammation and/or immune-associated processes, including a broad spectrum of complement components. In addition, associations between AMD and genetic variants in complement genes have been reported, which supports the role of low-grade inflammation and an abnormal regulation of the complement system in drusen pathogenesis. Drusen are an important quantifier of the severity of AMD. Therefore, the size and number of drusen are used for AMD staging and for the prediction of the likelihood of disease progression and vision loss.
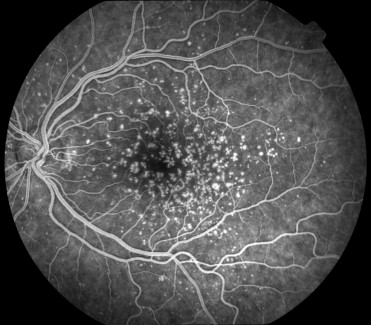
Different clinical subtypes of drusen have been described in AMD, but all drusen seem to be indistinguishable in location, composition, and substructure. “Basal laminar drusen,” also termed “cuticular drusen,” refers to an early-onset drusen phenotype with innumerable small (25 to 75 μm) hard drusen. This subtype of AMD is more easily visualized angiographically than biomicroscopically, with a typical “stars-in-the-sky” appearance during the early arteriovenous phase of fluorescein angiography ( Figure 1 ) . In later stages, the number of drusen often increases, with clustered groups of drusen scattered throughout the retina.
In general, color fundus photographs are used to evaluate the morphology of drusen over time. However, color images do not provide detailed information about the changing morphology of small drusen. The introduction of spectral-domain optical coherence tomography (SD-OCT) has enabled an improved in vivo visualization of drusen morphology. SD-OCT is able to acquire 3-dimensional images of the retina with high speed and high resolution. Subsequently, studies of the fine details of small drusen and adjacent retinal structures become possible.
After we observed occasional changes of drusen morphology in routinely followed eyes with basal laminar drusen, we decided to longitudinally investigate the appearance of small hard drusen in eyes with this phenotype. The focus of our investigation was to determine whether morphologic parameters may be predictive for processes of progression or regression of small hard drusen in basal laminar drusen affected eyes.
Patients and Methods
Patients
A total of 10 subjects who met the diagnostic criteria of basal laminar drusen were retrieved from the European Genetic Database (EUGENDA, www.eugenda.org ), a large multicenter database for clinical and molecular analysis of AMD and different early-onset drusen phenotypes.
For inclusion in the study, subjects had basal laminar drusen of the posterior pole and ocular media allowing adequate SD-OCT scanning, defined by a maximum score of NO3/NC2/C1/P1 according the Lens Opacities Classification System III. Study participants had to be able to fixate for at least 1 minute per eye to allow adequate SD-OCT scanning. The basal laminar drusen phenotype was defined as a symmetrically distributed pattern between both eyes of at least 50 scattered, uniformly sized, small (25 μm to 75 μm), hyperfluorescent drusen on fluorescein angiography in each eye, of which at least 20 drusen are located outside the Wisconsin age-related maculopathy grading template. Eyes with choroidal neovascularization (CNV), a large area of central geographic atrophy (>1500 μm), and retinal abnormalities other than AMD-related were excluded from the study. In order to exclude possible effects of antioxidant agent use on changing drusen morphology, the use of antioxidant agents was prohibited 1 month prior to study entry and during the follow-up period.
Image Acquisition
All study participants were examined 3 times with a 2-month interval during a follow-up period of 4 months. During each visit, visual acuity was recorded with Early Treatment Diabetic Retinopathy Study (ETDRS) charts. Multimodal imaging was performed by a combined confocal scanning laser ophthalmoscope (cSLO)/SD-OCT device (SPECTRALIS; Heidelberg Engineering, Heidelberg, Germany) after pupil dilation with 1 drop of 2.5% phenylephrine hydrochloride and 1 drop of 1% tropicamide. A standardized imaging protocol was performed in each study eye, which included near-infrared reflectance imaging in high-speed mode (λ = 815 nm; scan angle, 30 degrees; image resolution, 768 × 768 pixels) and simultaneous SD-OCT scanning (λ = 870 nm; 40 000 A-scans per second; number of B-scans, 38; distance between B-scans, 122 μm) using a second, independent pair of scanning mirrors. Because of the independent pairs of scanning mirrors, eye movements were registered and corrected automatically (“eye tracking”) by the cSLO/SD-OCT device. The eye tracker enabled the identification of the same scanning location during follow-up visits. By this means, a very high repeatability and reproducibility of longitudinal measurements with an exceedingly small measurable change (1.5 μm) of retinal structure has been shown for this device. Therefore, a highly reliable comparison of drusen as small as 25 to 75 μm, like in basal laminar drusen, is possible on follow-up OCT scans.
To increase image quality, the Automatic Real-Time (ART) function was used. With ART activated, 35 SD-OCT B-scans of the same scanning location were performed during the scanning process and images were averaged for noise reduction.
Image Analysis
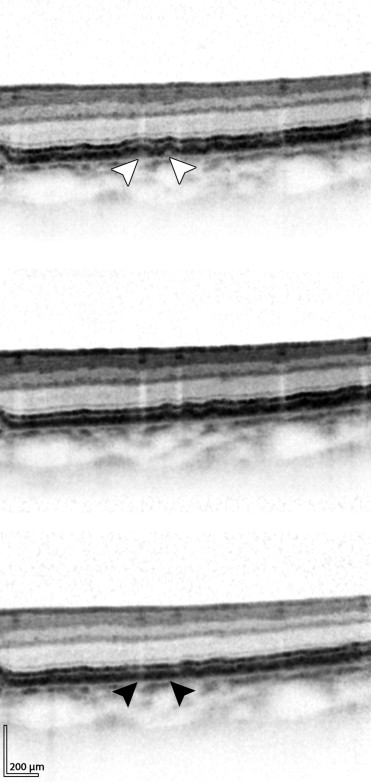
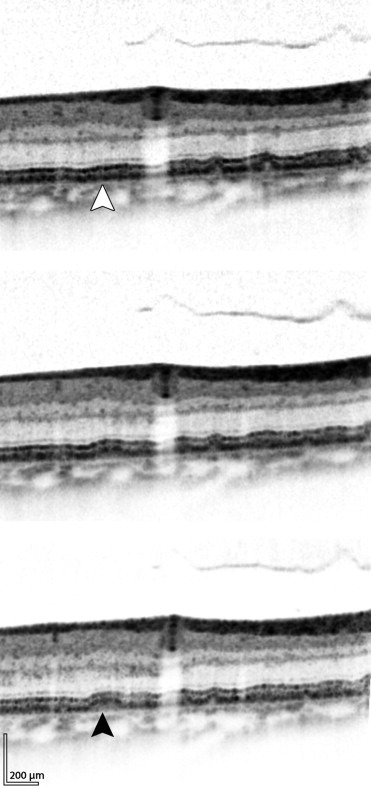
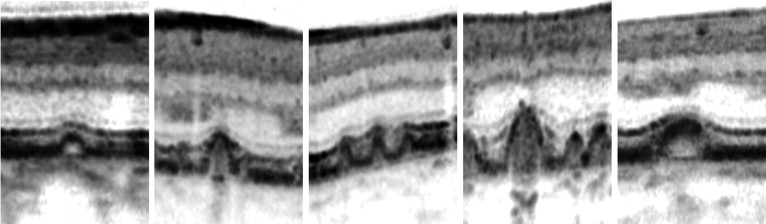
For the morphologic evaluation of the small hard drusen, baseline SD-OCT scans and SD-OCT scans after 4 months were studied side by side by 2 graders (J.vd.V. and Y.L.). Only drusen that showed increasing volume over time or decreasing volume over time were analyzed for this study ( Figures 2 and 3 ) . The analysis focused on 5 morphologic parameters ( Figure 4 ) , partly adopted from Khanifar and associates, with the additional parameters for photoreceptor layer and RPE layer damage, scored as follows: the shape of the drusen was characterized as dome-shaped (basal diameter ≥ height), pointed (basal diameter < height), or saw-toothed (grouped pointed drusen edging each other at the level of Bruch membrane); the predominant internal reflectivity between RPE elevation and the Bruch membrane was characterized as low (isoreflective or hyporeflective compared to the photoreceptor outer segment layer), medium (hyperreflective compared to the photoreceptor outer segment layer but hyporeflective relative to the RPE), or high (isoreflective or hyperreflective in relation to the RPE); the homogeneity of internal drusen reflectivity was characterized as homogeneous (uniform internal reflectivity), nonhomogeneous with core (varying internal reflectivity with a distinct single focus of hyperreflectivity), or nonhomogeneous without core (varying internal reflectivity without a distinct focus of hyperreflectivity); photoreceptor layer damage was characterized as present (hyporeflective photoreceptor layer overlying a druse relative to the average photoreceptor layer reflectivity in the surrounding areas without drusen) or absent (isoreflective photoreceptor layer overlying a druse relative to the surrounding average photoreceptor layer reflectivity); and RPE damage was characterized as present (hyporeflective RPE overlying a druse relative to the surrounding average RPE reflectivity in retinal areas without drusen) or absent (isoreflective RPE overlying a druse relative to surrounding average RPE reflectivity).
Statistics
Statistical analysis was performed by SPSS statistical software, version 18.0 (SPSS Inc., Chicago, Illinois, USA). The prevalence (number of eyes and number of drusen) of each basic morphologic pattern was calculated and analyzed with descriptive statistics. Drusen were measured by the Heidelberg Eye Explorer software, version 1.6.4.0 (Heidelberg Engineering GmbH, Heidelberg, Germany), and a ratio between height and basal diameter was calculated. For interindividual correction, a model for generalized estimating equations for binary outcome was used to analyze differences in drusen characteristics between drusen that showed a progression in drusen volume (the “drusen progression” group) and drusen that showed an decreasing drusen volume (the “drusen regression” group). Strength of association of the different drusen characteristics between the “drusen regression” group and “drusen progression” group is shown as odds ratios (ORs) with a 95% confidence interval (95% CI). The chance of drusen morphology change was expressed as a value between 0 (0% chance) and 1.0 (100% chance). Reported P values are 2-sided and a value of <.05 was considered statistically significant.
Results
SD-OCT was performed on 19 eyes of 10 patients. One eye was excluded from this study because of a large area of central geographic atrophy. The mean age of the patients was 64.6 ± 13.9 years, ranging from 45 to 86 years. Nine patients were female and 1 patient was male. The mean baseline best-corrected visual acuity was 78 letters (range, 20 to 95). In all eyes visual acuity remained stable ( P = .231) during the period of follow-up, with a mean increase of 1 letter on the ETDRS visual acuity chart.
The morphologic results of small hard drusen with spontaneous volume regression and the morphologic results of small hard drusen with progression are depicted in the Table . The most common small hard drusen that showed short-term changes were homogeneous, dome-shaped drusen with medium internal reflectivity and without overlying RPE or photoreceptor layer damage. Dome-shaped small hard drusen (n = 67) showed an average base-to-height ratio of 1:0.58, while pointed small hard drusen (n = 25) showed an average base-to-height ratio of 1:1.43. Of the cases with drusen volume regression, 30.6% (15/49) completely regressed during follow-up, whereas 69.4% (34/49) showed a decreased drusen volume only. In cases of small hard drusen with increased drusen volume, 33.9% (19/56) showed development of new drusen, whereas 66.1% (37/56) of those small hard drusen showed an increased drusen volume.
| Drusen Regression Group | Drusen Progression Group | P Value a | |||
|---|---|---|---|---|---|
| No. Drusen (%) | No. Eyes (%) b | No. Drusen (%) | No. Eyes (%) b | ||
| Shape | |||||
| Dome | 37 (75.5%) | 16 (84.2%) | 30 (53.6%) | 14 (73.7%) | n.s. |
| Pointed | 5 (10.2%) | 3 (15.8%) | 20 (35.7%) | 10 (52.6%) | .031 |
| Saw-toothed | 7 (14.3%) | 5 (26.3%) | 6 (10.7%) | 6 (31.6%) | n.s. |
| Reflectivity | |||||
| Low (≤ photoreceptor layer) | 2 (4.1%) | 2 (10.5%) | 1 (1.8%) | 1 (5.3%) | n.s. |
| Medium (between photoreceptor layer and RPE) | 47 (95.9%) | 18 (94.7%) | 55 (98.2%) | 18 (94.7%) | n.s. |
| High (≥RPE) | 0 (0.0%) | 0 (0.0%) | 0 (0.0%) | 0 (0.0%) | n.s. |
| Homogeneity | |||||
| Homogeneous | 43 (87.8%) | 19 (100.0%) | 51 (91.1%) | 17 (89.5%) | n.s. |
| Nonhomogeneous with core | 0 (0.0%) | 0 (0.0%) | 2 (3.6%) | 2 (10.5%) | n.s. |
| Nonhomogeneous without core | 6 (12.2%) | 5 (26.3%) | 3 (5.4%) | 3 (15.8%) | n.s. |
| Photoreceptor layer damaged | |||||
| Present | 6 (12.2%) | 4 (21.1%) | 1 (1.8%) | 1 (5.3%) | .041 |
| Absent | 43 (87.8%) | 18 (94.7%) | 55 (98.2%) | 18 (94.7%) | |
| RPE damaged | |||||
| Present | 9 (18.2%) | 6 (31.6%) | 1 (1.8%) | 1 (5.3%) | .022 |
| Absent | 40 (83.3%) | 17 (89.5%) | 55 (98.2%) | 18 (94.7%) | |
Stay updated, free articles. Join our Telegram channel

Full access? Get Clinical Tree


