Purpose
To characterize the costs of caring for patients with open-angle glaucoma (OAG) in the United States over time and to identify factors that influence these costs.
Design
Longitudinal cohort study.
Methods
Claims data from 19 927 newly diagnosed OAG patients enrolled in a large United States managed care network were reviewed to identify glaucoma-related charges for all incident OAG patients from 2001 through 2009. Average glaucoma-related charges for enrollees with OAG were characterized in 6-month blocks from the date of initial OAG diagnosis through the ensuing 5 years. Factors associated with being an enrollee in the costliest 5% for glaucoma-related charges (accruing $5810 or more in charges in the first 2 years) were identified using logistic regression.
Results
The costliest 5% of enrollees were responsible for $10 202 871 (24%) of all glaucoma-related charges. By comparison, those whose costs fell within the lower 50% of the cost distribution collectively amassed only $7 986 582 (19%) of all glaucoma-related charges. A spike in glaucoma-related charges occurred in the 6-month period around the time of OAG diagnosis, stabilized by 1 year after diagnosis, and remained relatively constant over time. Risk factors associated with being in the costliest 5% for glaucoma-related care included younger age, Northeastern United States state residence, undergoing cataract surgery, and possessing ocular comorbidities ( P < .006 for all comparisons).
Conclusions
A small subset of enrollees account for a large proportion of all glaucoma-related charges. Understanding the characteristics of these individuals and finding ways to reduce disease burden and costs associated with their care can result in substantial cost savings.
Open-angle glaucoma (OAG) is a chronic, progressive, incurable disease that affects more than 2 million individuals in the United States and many more worldwide. It is the most common cause of blindness among African Americans, and caring for patients with OAG in the United States carries a total societal cost estimated of nearly $1 billion annually. Thus, developing an understanding of the resource use of people with glaucoma and identifying those expected to have the largest resource use is important in a resource-constrained health care environment. Further, by collecting longitudinal information on resource use we, can quantify better the value of slowing glaucoma progression through various interventions.
Although there have been many studies examining the cost of caring for people with glaucoma, most have been based on persons with prevalent OAG, and few have examined changes in cost of care over time. The few longitudinal studies lacked sufficient power to examine long-term trends in resource use, and none confined their study cohort to incident cases, thus limiting their ability to assess the impact of disease progression on the cost of care. Two studies that used administrative data sets focused on comparing resource use of glaucoma care with that for other ocular conditions.
In this investigation, we examined 2 questions: (1) What is the pattern of resource use for patients with OAG during the first 7 years after disease onset? and (2) What are the characteristics of those patients who have the greatest glaucoma-related resource use?
Methods
We identified patients with incident OAG from the i3 InVision Data Mart data set (Ingenix, Eden Prairie, Minnesota, USA), taking an incidence approach to cost estimation. Incidence of OAG was determined using the criteria detailed below. We described resource use for glaucoma care over 7 years in total and stratified costs by resource type (glaucoma-related surgery, medications, eye visits, and diagnostic testing). In addition, we used logistic regression methods to evaluate demographic predictors of a person with OAG being in the top 5% of glaucoma resource users. These analyses were conducted from the payor perspective, meaning that the cost of care recognized is reflected in the provider’s paid (not billed) charges.
Data Source
The i3 InVision data set contains fully deidentified records of all beneficiaries in a large, national, managed care network in the United States. Included are beneficiaries in commercial, Medicaid, and Medicare Advantage plans sponsored by the managed care provider providing the claims. We had access to data for a subset of beneficiaries who had any form of eye care from January 1, 2001, through December 31, 2009. This subset consisted of beneficiaries who had 1 or more International Classification of Diseases, Ninth Revision, Clinical Modification (ICD-9-CM) codes for any eye-related diagnosis (360 through 379.9) or Current Procedural Terminology, Fourth Edition, code for any eye-related visits, diagnostic or therapeutic procedures (65091 through 68899 or 92002 through 92499), or any other claims submitted by an ophthalmologist or optometrist during the beneficiary’s time in the medical plan. We had access to all inpatient and outpatient medical claims for ocular and nonocular conditions, along with outpatient pharmacy prescription records and sociodemographic information (age, sex, race, education level, household net worth, and region of residence).
Study Participants
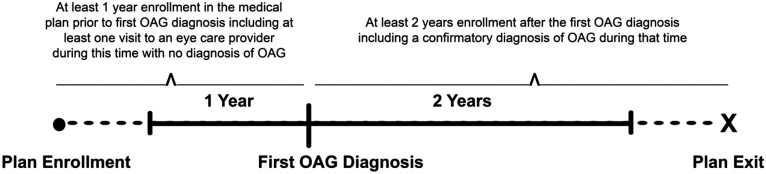
We identified all individuals who were continuously enrolled in the plan for 3 years or more and had 1 or more diagnoses of OAG (ICD-9-CM codes 365.1, 365.10, 365.11, 365.12, and 365.15) as the first through fifth diagnosis on the encounter form. From this group, we then identified all individuals with newly diagnosed OAG (ie, incident case) based on the following criteria (see also Figure 1 ) :
- •
A visit to an eye care provider (optometrist or ophthalmologist) where the provider recorded an ICD-9-CM billing code for OAG (the date of this visit is the index date).
- •
At least 1 year of enrollment in the medical plan before the index date without a claim that included a diagnosis of OAG. The enrollee must have also seen an eye care provider at least once during this period.
- •
At least 1 visit to an eye care provider subsequent to the index visit that included an OAG diagnosis.
- •
At least 2 years of continuous enrollment in the plan after the index visit.
Charges
Glaucoma-related charges were identified by using Current Procedural Terminology, Fourth Edition, billing codes and included all visits to ophthalmologists or optometrists, all glaucoma-related diagnostic procedures, all glaucoma-related laser and incisional surgeries, and all topical and oral intraocular pressure-lowering medications. The charges captured in this data source are the allowed charges. To account for inflation, all charges were adjusted 3% per year to 2009 United States dollars. For each enrollee, all glaucoma-related charges from each encounter were summed to determine the total glaucoma-related charges. Next, we determined the total length of time in years that each enrollee was in the medical plan. Each beneficiary’s total glaucoma-related charges during their first 2 years after OAG diagnosis were used to determine the annual glaucoma-related charges (AGCs) for that individual.
Trends in Charges Over Time
For each beneficiary, we computed the total glaucoma-related charges generated in the 12 months before the initial OAG diagnosis and then every 6 months from the first date of OAG diagnosis out to 5 five years after the initial glaucoma diagnosis. Next, we summed the total glaucoma-related charges for all the beneficiaries during each of these intervals and divided each of these totals by the number of enrollees with OAG enrolled in the plan during that interval to determine the mean glaucoma-related charges incurred at each interval. Similar analyses were performed to assess mean charges for visits, glaucoma diagnostic procedures, glaucoma surgeries, glaucoma medications, and other eye surgeries at each interval.
Ranking of Enrollees Based on Glaucoma-Related Charges
Each enrollee was ranked according to their AGC generated during their first 2 years after the index date. Based on these rankings, we identified the beneficiaries in the top 5%, 10%, 25%, and 50% for AGCs. The total AGC for individuals in the top 5% was divided by the total AGC for all enrollees in the plan to determine the proportion of total AGCs that were generated by the top 5% costliest beneficiaries for glaucoma-related services. Similar calculations were performed for those in the top 10%, 25%, 50%, and lower 50% for AGCs.
Statistical Analyses
Statistical analyses were performed using SAS software version 9.2 (SAS Institute, Cary, North Carolina, USA). Participant characteristics were summarized for the entire sample using means and standard deviations for continuous variables and frequencies and percentages for categorical variables. Univariate and multivariable logistic regression analyses were conducted to ascertain whether sociodemographic factors, ocular conditions, or surgeries affected the likelihood of being in the top 5% for AGCs during the first 2 years after OAG diagnosis. Regression covariates included sociodemographic characteristics (age, sex, race, education, net worth), region of residence in the United States, comorbid ocular conditions (cataract, diabetic retinopathy, macular degeneration, pseudophakia or aphakia), diabetes mellitus, hypertension, hyperlipidemia, depression, dementia, and a measure of overall health, the Charlson comorbidity index.
The human studies offices at the University of Michigan and Washington University School of Medicine determined this study met conditions for being exempt from institutional review board review because of a lack of identifiable data in the data set.
Results
A total of 19 927 enrollees met our definition of incident OAG. These patients had a mean ± standard deviation age of 60.2 ± 11.0 years and were more likely to be female (n = 10 992; 55.2%). Most people with incident OAG were white (n=14 875; 81.4%), followed by black (n=1508; 8.3%), Latino (n = 1185; 6.5%), and Asian (n=546; 3.0%). Almost all were high school graduates (n=18 908; 98.3%), and 24.7% (n=4756) had graduated from college. Most of the enrollees with incident OAG (n=14 057; 75.4%) had household net worth levels of $150 000 or more ( Table 1 ).
| Categorical Variables | Frequency | Percent |
|---|---|---|
| Sex | ||
| Male | 8935 | 44.8 |
| Female | 10 992 | 55.2 |
| Race | ||
| White | 14 875 | 81.4 |
| Black | 1508 | 8.3 |
| Latino | 1185 | 6.5 |
| Asian | 546 | 3 |
| Other | 171 | 0.9 |
| Education | ||
| Less than high school | 326 | 1.7 |
| High school | 6721 | 34.9 |
| Some college | 7437 | 38.7 |
| College degree | 4714 | 24.5 |
| Postgraduate | 39 | 0.2 |
| Household net worth ($) | ||
| < 25 000 | 1256 | 6.7 |
| 25 000 to 74 000 | 1150 | 6.2 |
| 75 000 to 149 000 | 2174 | 11.7 |
| 150 000 to 499 000 | 8464 | 45.4 |
| > 500 000 | 5593 | 30 |
| Region | ||
| Northeast | 3346 | 16.8 |
| Southeast | 7923 | 39.8 |
| Midwest | 5992 | 30.1 |
| West | 2645 | 13.3 |
| Other | 17 | 0.1 |
| AMD | 2730 | 13.7 |
| DR (NPDR or PDR) | 1835 | 9.2 |
| Cataract | 11 725 | 58.8 |
| Pseudophakia or aphakia | 3978 | 20.2 |
| Continuous Variables | Mean (SD) | Minimum, Maximum |
|---|---|---|
| Age | 60.2 (11.0) | 41.0, 85.0 |
| Charlson comorbidity index | 4.2 (3.4) | 0.0, 29.0 |
Distribution of Charges for Open-Angle Glaucoma
During the first 2 years after OAG diagnosis, a total of $42 333 499 was spent on glaucoma-related care for all of the enrollees with incident OAG, including $13 730 227 (32%) for visits to eye care providers, $13 022 649 (31%) for glaucoma medications, $6 906 353 (16%) for glaucoma diagnostic tests, and $8 674 269 (20%) for laser or incisional glaucoma surgeries.
Timing of Charges
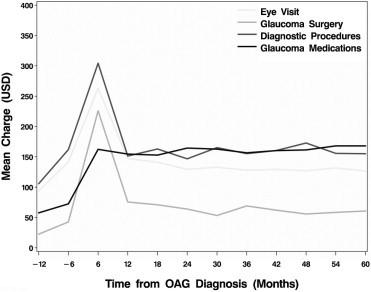
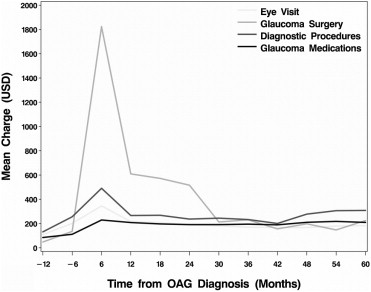
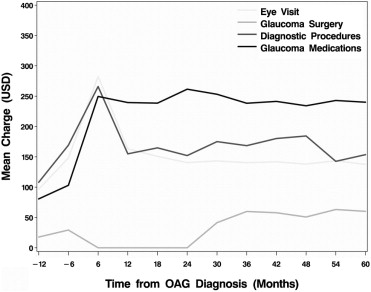
Figure 2 illustrates the trend in average charges for glaucoma-related care for all individuals with incident OAG at 6-month intervals from 1 year before the time of diagnosis and through the subsequent 5 years. Figure 3 depicts a similar plot among the subset of OAG patients who underwent at least 1 laser or incisional glaucoma surgery during their first 2 years in the plan. Likewise, Figure 4 shows a similar plot for those who had no laser or incisional glaucoma surgery during their first 2 years in the plan. The figures demonstrate that there is a spike in mean charges in the first 6 months after OAG diagnosis. For the overall group, diagnostic testing and glaucoma medications contributed more than office visits and glaucoma surgery to the mean charges ( Figure 2 ). However, among the subset of enrollees with incident OAG who underwent glaucoma surgery in the first 2 years (n = 2466; laser surgery, n = 1550; incisional surgery, n = 752; both laser and incisional surgery, n = 164), charges for surgery itself far exceeded charges for visits, diagnostic tests, and medications ( Figure 3 ). Among the entire group of incident OAG patients, of all glaucoma-related charges incurred in the first 2 years after diagnosis, the proportion incurred in the first 6 months after diagnosis was 37.8%; in months 6 to 12 after diagnosis, it was 21.0%; in months 12 to 18 after diagnosis, it was 20.8%; and in months 18 to 24 after diagnosis, it was 20.5%. By 1 year after diagnosis, the mean amount of glaucoma-related charges stabilized and remained relatively constant for subsequent periods.
Mean Charges for Glaucoma-Related Services Per Enrollee
The mean charges accrued for glaucoma-related services were $955.37 in the first 6 months after OAG diagnosis, $528.23 from months 6 to 12 after diagnosis, $527.61 from months 12 to 18 after diagnosis, and $504.40 from months 18 to 24 after diagnosis. The mean cumulative charges for glaucoma-related services were $1484 at 1 year and $2516 at 2 years after disease diagnosis ( Table 2 ).
| Time since OAG Diagnosis (mos) | Mean (SD) Charges during Interval | 5% a | 10% a | 25% a | 50% a | 75% a | 90% a | 95% a | Mean Cumulative Charges since Diagnosis |
|---|---|---|---|---|---|---|---|---|---|
| 0 to 6 | $955.37 ($1834.10) | $148.40 | $208.69 | $349.09 | $592.25 | $963.09 | $1699.52 | $2839.13 | $955.37 |
| 6 to 12 | $528.23 ($1281.12) | $0 | $0 | $99.31 | $323.29 | $620.72 | $1030.88 | $1495.01 | $1483.60 |
| 12 to 18 | $527.61 ($908.54) | $0 | $0 | $107.46 | $345.66 | $649.90 | $1059.03 | $1515.26 | $2011.21 |
| 18 to 24 | $504.40 ($1859.16) | $0 | $0 | $72.10 | $311.85 | $620.26 | $1016.33 | $1440.18 | $2515.61 |
Stay updated, free articles. Join our Telegram channel

Full access? Get Clinical Tree


