Purpose
To describe the incidence and significance of retinal changes in pediatric eyes with glaucoma and nonglaucomatous optic atrophy by optical coherence tomography (OCT).
Design
Retrospective observational case series.
Methods
OCT scans performed on children with either glaucoma or nonglaucomatous optic atrophy were retrospectively reviewed. Excluded were poor-quality scans and diagnoses of ocular hypertension or glaucoma suspects.
Results
Included were 227 eyes (227 children), 151 with glaucoma and 76 with nonglaucomatous optic atrophy. Outer retinal changes were present in 20 of 151 glaucoma eyes (13.2%) (12 prior intraocular surgery, 5 uveitis, 3 primary retinopathy) and 6 of 76 nonglaucomatous optic atrophy eyes (7.9%) (1 retinal vasculitis, 3 papilledema, 2 infiltrative optic neuropathy). Excluding eyes with outer retinal changes, isolated inner nuclear layer (INL) cysts were found in 6 of 131 eyes with glaucoma (4.6%) (3 uveitis, 1 prior hydrocephalus, 1 uveitis and pars plana vitrectomy, and 1 juvenile open-angle glaucoma) and 21 of 70 eyes with nonglaucomatous optic atrophy (30%) (5 optic neuritis, 11 anterior visual pathway tumors, 2 papilledema, 3 other) ( P < .0001). Compared to eyes without INL cysts, those with INL cysts had thinner average retinal nerve fiber layer (RNFL) (78.2 ± 1.8 μm vs 52.0 ± 4.8 μm, P < .0001) and worse vision (logMAR = 0.33 ± 0.04 vs 0.65 ± 0.09, P < .002).
Conclusions
INL cysts are more frequent in pediatric nonglaucomatous optic atrophy than glaucoma; they are associated with worse vision and thinner RNFL. Outer retinal changes were exclusively seen in pathology that directly affected the retina. In children, INL cysts and/or outer retinal changes without prior history of intraocular surgery or uveitis should prompt further evaluation.
Optical coherence tomography (OCT) can detect the presence of structural changes in the neurosensory retina and nerve fiber layer in various retina and optic nerve diseases. Classically, retinopathies are thought to be accompanied by outer retinal and photoreceptor changes, while glaucoma and other optic neuropathies are accompanied by thinning of the ganglion cell layer and retinal nerve fiber layer (RNFL) without affecting the outer retina. Recent papers have described retinal changes in optic nerve disease. In histologic sections of postmortem human glaucomatous eyes and animal models of glaucoma, Nork and associates reported patchy loss of photoreceptors in glaucomatous eyes. Recently, inner nuclear layer (INL) cysts have been described in various optic neuropathies including optic neuritis, glaucoma, Leber hereditary optic neuropathy, Kjer dominant optic atrophy, and optic pathway gliomas. In adults, the presence of INL cysts has been suggested as a marker of trans-synaptic degeneration in optic atrophy. Little has been described regarding the association of outer retinal changes and INL cysts with optic atrophy in the pediatric population. In this study, we describe the retinal changes seen by spectral-domain OCT (SD OCT) and their associated clinical features in a cohort of pediatric patients with glaucoma and nonglaucomatous optic atrophy.
Methods
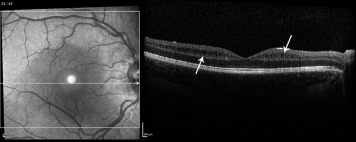
This retrospective observation case series was approved prospectively by the Duke Medical Center Institutional Review Board and is in accord with all Health Insurance Portability and Accountability Act (HIPAA) regulations. The charts of children (younger than 18 years of age at presentation) with an ICD-9 diagnosis indicating any pediatric glaucoma subtype (diagnosed by a single pediatric glaucoma specialist [S.F.F.]), or optic atrophy or partial optic atrophy (diagnosed by a single pediatric neuro-ophthalmologist [M.A.E.]) were identified retrospectively, and those having had an ordered/attempted macular OCT were reviewed. If a macular OCT was performed but found unreadable in both eyes then the patient was excluded. Included was 1 eye from each child who had Spectralis SD OCT (Heidelberg Engineering, Heidelberg, Germany) and who had imaging between January 1, 2012 and July 15, 2014. In children with binocular disease, the eye with the better-quality OCT scan was chosen for analysis. Since 2003, children with glaucoma or any other optic neuropathy were routinely imaged by OCT at our institution with both a macular map and a peripapillary RNFL scan. All eyes had a macular map with a B-scan pattern of 61 high-resolution retinal sections, spaced 120 μm and centered on the macula, along with peripapillary RNFL thickness imaging. Clinical data, previous surgical history, vision, intraocular pressure (IOP), cup-to-disc ratio, and RNFL thickness were collected and macular scans were examined. Excluded were poor-quality macular scans with poor reliability index (manufacturer signal index <15) and patients with ocular hypertension or glaucoma suspects. Macular OCT scans were reviewed by 2 graders (M.A.E. and S.F.F.) who were masked to the clinical diagnosis. After review of the macular scans, eyes were assigned into 3 groups: (1) normal; (2) isolated INL cysts (if retina structure was normal except for the presence of isolated INL cysts [example, Figure 1 ]); and (3) abnormal retina (if outer retinal changes and/or epiretinal membrane were present). On OCT, the vitreous was reviewed for an attached posterior hyaloid membrane for all eyes. Statistical analysis was performed using Microsoft Excel (Microsoft Corporation, Redmond, Washington, USA; 2013), Analyse-it (Analyse-it Software, Ltd., The Tannery, Leeds, United Kingdom) statistical program, and JMP Pro11.0.0 (SAS Institute Inc, Cary, North Carolina, USA; 2013).
Results
Macular scans were obtained on 256 eyes (256 children), 165 with glaucoma and 91 with nonglaucomatous optic atrophy. In 14 pediatric glaucoma patients, a readable macular OCT could not be obtained in either eye owing to poor media and/or severe nystagmus. In 15 pediatric patients with nonglaucomatous optic atrophy, a readable macular OCT could not be obtained in either eye owing to severe developmental delay, severe nystagmus, and/or lack of cooperation. Included were 227 eyes (227 children), 151 with glaucoma and 76 with nonglaucomatous optic atrophy. Baseline characteristics for the pediatric glaucoma were described ( Table ). One hundred five of 151 glaucoma patients had glaucoma with RNFL thinning, while 46 of 151 had normal-appearing optic nerves with RNFL >90 μm with a history of successfully treated childhood glaucoma (primary congenital glaucoma, juvenile open-angle glaucoma, port wine mark–associated glaucoma, uveitic glaucoma, and glaucoma after pediatric cataract removal). Baseline characteristics for the pediatric glaucoma and nonglaucomatous optic atrophy groups were described as presented in the Table . Patients with glaucoma had a higher IOP and larger cup-to-disc ratio than those with nonglaucomatous optic atrophy ( Table ). Two patients with nonglaucomatous optic atrophy due to optic pathway glioma (chiasmal) had IOP >25 mm Hg but <30 mm Hg in both eyes and were being medically treated for ocular hypertension; the optic atrophy in these 2 patients was thought to be mainly due to the compression from the glioma rather than the high IOP and they were therefore included only in the nonglaucomatous optic atrophy group.
| Baseline Characteristics | Glaucoma (N = 151) | Percentage (%) | Nonglaucomatous Optic Atrophy (N = 76) | Percentage (%) | χ 2 |
|---|---|---|---|---|---|
| Sex | |||||
| Male | 72 | 47.7 | 31 | 40.8 | 0.32 |
| Female | 79 | 52.3 | 45 | 59.2 | |
| Race | |||||
| White | 93 | 61.6 | 42 | 55.3 | 0.13 |
| Black | 38 | 25.2 | 24 | 31.6 | |
| Asian | 7 | 4.6 | 0 | 0.0 | |
| Other a | 13 | 8.6 | 10 | 13.1 |
| Mean ± SD | Range | Mean ± SD | Range | P Value b | |
|---|---|---|---|---|---|
| Vision (logMAR) | 0.40 ± 0.50 | [−0.12 to 2.30] | 0.46 ± 0.52 | [−0.12 to 1.90] | .75 |
| Cup-to-disc ratio | 0.58 ± 0.29 | [0–1] | 0.37 ± 0.22 | [0–0.9] | <.0001 |
| Intraocular pressure | 16.88 ± 6.78 | [3–46] | 15 ± 3.84 | [0–27] | .0081 |
| Age (at first visit) | 12.03 ± 4.40 | [0–18] | 12.41 ± 3.72 | [5.08–18.46] | .79 |
| Age (at last visit) | 14.38 ± 6.23 | [2.7–31.9] | 13 ± 4.71 | [5.08–26.15] | .08 |
a Other = multiracial, American Indian, East Indian, Hispanic.
b P value is given for comparison between glaucoma and nonglaucomatous optic atrophy for given characteristic.
Outer Retinal Findings
Abnormal retinal changes noted on evaluation of macular scans by SD OCT included cystoid macular edema, total retinal atrophy, pigment epithelial detachment with subretinal fluid, choroidal folds, disruption of the inner segment and outer segment photoreceptor band, outer retinal loss with photoreceptor loss, and cystoid macular edema with subretinal fluid (select examples of outer retinal changes are shown in Figure 2 ). Outer retinal changes were present in 20 of 151 eyes with glaucoma (13.2%) (12 with prior intraocular surgery, 5 with uveitis, 3 with primary retinopathy additional to glaucoma). Previous intraocular surgery included pars plana vitrectomy, glaucoma drainage device implantation, and trabeculectomy with mitomycin C. Outer retinal changes were present in 6 of 76 eyes with nonglaucomatous optic atrophy (7.9%). The outer retinal changes were distributed among the various diagnoses of nonglaucomatous optic atrophy as follows: 1 of 1 with intracranial and retinal vasculitis, 3 of 13 (2.3%) with papilledema, 2 of 2 with infiltrative optic neuropathy. Eyes with outer retinal changes compared to those without outer retinal changes had worse vision (logMAR = 0.6 ± 0.10 vs 0.32 ± 0.04, respectively, P < .0001; Figure 3 ). None of the eyes with glaucoma but without uveitis or intraocular surgery had outer retinal changes (59/151); none of the eyes with nonglaucomatous optic atrophy due to retrobulbar optic pathway pathology (56/76) such as compressive lesions or optic neuritis had outer retinal changes. RNFL and macular volumes of eyes with outer retinal changes in the nonglaucomatous optic atrophy and glaucoma groups were not compared owing to unreliable plotting in the group that had retinal changes.
Isolated Inner Nuclear Layer Cysts
Excluding eyes with outer retinal changes, macular SD OCT evaluation revealed isolated INL cysts in 6 of 131 (4.6%) of the remaining eyes with glaucoma and 21 of 70 (27.8%) of the remaining eyes with nonglaucomatous optic atrophy. Of the 6 of 131 eyes with glaucoma showing isolated INL cysts, 3 had a history of uveitis, 1 had a prior history of hydrocephalus, 1 had history of uveitis and previous pars plana vitrectomy, and 1 had juvenile open-angle glaucoma. The INL cysts were distributed among eyes with various diagnoses of nonglaucomatous optic atrophy as follows: 5 of 18 (27.8%) had a history of optic neuritis, 11 of 36 (30.6%) had anterior visual pathway tumors, 2 of 13 (15.4%) had atrophic papilledema, 3 of 9 (33.3%) had other causes of optic atrophy (1 each with drusen, bilateral optic atrophy of unknown cause, and a history of prematurity with encephalomalacia of the occipital and parietal lobe secondary to ischemic/hypoxic injury and periventricular leukomalacia).
Eyes with isolated INL cysts, compared to those without INL cysts or other retinal changes, had thinner average RNFL (all eyes, n = 227, 52.0 ± 4.8 μm vs 78.2 ± 1.8 μm, respectively, P < .0001 [ Figure 4 , Left]; nonglaucomatous optic atrophy group, n = 76, 50.5 ± 2.4 μm vs 67.7 ± 3.8 μm, respectively, P = .03 [ Figure 4 , Right]). Excluding 2 eyes with unusually thick average RNFL of 147 μm and 151 μm, respectively, in the glaucoma group without isolated INL cysts, eyes with INL cysts still had statistically significantly thinner RNFL than those without INL cysts ( P = .03).
Furthermore, eyes with isolated INL cysts, compared to those without INL cysts or other retinal changes, had worse vision (all eyes, N = 227, logMAR = 0.65 ± 0.09 vs 0.33 ± 0.04, respectively, P < .002 [ Figure 5 , Left]; nonglaucomatous optic atrophy group, n = 76, logMAR=0.70 ± 0.5 vs 0.37 ± 0.5, respectively, P = .017 [ Figure 5 , Right]). In the nonglaucomatous optic atrophy group, there was no significant correlation between presence of isolated INL cysts and age (13.1 ± 1.0 vs 13.3 ± 0.7, years, P = .94), race (χ 2 , P = .88), average macular thickness on SD OCT (279.3 ± 22.2 vs 271.5 ± 31.1, mm, P = .34), or total macular volume on SD-OCT (7.88 ± 0.5 vs 7.99 ± 0.6, mm 3 , P = .47). Only 1 child with isolated INL cysts had ocular fluorescein angiography testing and it did not show leakage ( Figure 6 ).


