Purpose
To investigate the retinal and choroidal changes using spectral-domain optical coherence tomography (SD OCT) and to identify factors associated with visual outcome in eyes with central retinal artery occlusion (CRAO).
Design
Retrospective, observational case series.
Methods
setting : Institutional. patients : A total of 134 eyes diagnosed with acute (symptom onset ≤ 7 days) nonarteritic CRAO examined with SD OCT at baseline and follow-up visits. observations : Based on funduscopic and angiographic findings, CRAO was categorized into 3 stages: incomplete, subtotal, and total. Abnormal morphologic features were evaluated from SD OCT images. Central macular thickness (CMT), inner and outer retinal thicknesses, and subfoveal choroidal thickness (SFCT) were measured. The clinical and SD OCT features were correlated with the final best-corrected visual acuities (BCVA). main outcome measures : Retinal and choroidal thickness and BCVA.
Results
Features of SD OCT at the initial presentation included inner and outer retinal thickening. At baseline, the frequency of inner and outer retinal thickening and macular edema (CMT > 300 μm) differed significantly among CRAO stages (all P < .05). SFCT in eyes with total CRAO was significantly thinner compared with that of the contralateral eyes ( P = .009). A higher CRAO stage was associated significantly with macular edema at baseline ( P < .001) and retinal thinning at the final visit ( P = .010). Baseline CMT was correlated significantly with final BCVA ( P < .001). Multivariate logistic regression analyses revealed that severe vision loss (BCVA < 20/200) was associated significantly with CRAO stage ( P < .001) and baseline CMT ( P = .005).
Conclusions
CRAO resulted in inner and outer retinal thickening in the acute stages and subsequent atrophic changes in the inner and outer retina. SD OCT may be a useful noninvasive imaging tool for diagnosis, staging, and prognosis of CRAO.
Central retinal artery occlusion (CRAO), or end-organ ischemia of the eye, is an ocular emergency that causes sudden visual loss. Visual acuity at the time of initial presentation ranges from counting fingers to light perception in 74% to 90% of eyes. Visual prognosis in patients with CRAO has been reported to be very poor, because up to 92% have permanent loss of vision, with a final visual acuity of counting fingers or less.
Schmidt and associates categorized CRAO as incomplete, subtotal, or total CRAO on the basis of the degree of vision loss, extent of retinal edema, and delay in arterial blood flow. Incomplete CRAO is characterized by diminished visual acuity with slight retinal edema and a cherry-red spot. Subtotal CRAO presents as a severe reduction in visual acuity and distinct retinal edema and a cherry-red spot. Total CRAO is distinguished from the other 2 stages by the presence of massive edema and occluded perimacular arterioles (in some cases with additional interruption to the choroidal blood flow). Previous studies have proved stage-dependent outcomes after treatment in eyes with CRAO. Consequently, the stage of CRAO should be considered for a complete clinical evaluation. The current staging system is based on funduscopic and angiographic features, and has several limitations. For example, the degree of retinal edema is not easily discernible by funduscopic examination, and thus, this staging system can be subjective and often ambiguous for determining the CRAO stage. Therefore, a more objective method to detect and document the degree of retinal edema may be useful clinically to facilitate the staging process.
Optical coherence tomography (OCT), which provides an in vivo high-resolution quasi-histologic image of the retina, has been used by several authors to identify microscopic damage in the neurosensory retina caused by CRAO. Previous studies have focused predominantly on changes to the inner retina and have shown inner retinal edema in eyes with acute CRAO and inner retinal thinning at subsequent phases. The role of OCT for staging CRAO, however, has not been well documented. One report has suggested that OCT may be useful in the diagnosis of retinal artery occlusion if the patient is observed first at a later stage of the course of the disease. Because OCT provides an accurate measurement of retinal thickness around the macula, the present study hypothesized that OCT may be useful for documenting the degree of retinal edema and for staging CRAO. Furthermore, spectral-domain (SD) OCT with enhanced depth imaging (EDI) techniques allows better visualization of the outer retina and choroid, abnormalities of which have been reported rarely in eyes with CRAO from previous studies.
To investigate the role of EDI OCT in CRAO, the structural changes of the retina and choroid were evaluated in each stage of CRAO and compared between the stages. To investigate further the use of OCT in CRAO, the OCT findings were correlated with visual outcome to identify the associated OCT features.
Methods
The present study was approved by the Institutional Review Board of Seoul National University, Bundang Hospital (Seoul, South Korea), and the study adhered to the tenets of the Declaration of Helsinki.
Patient Selection
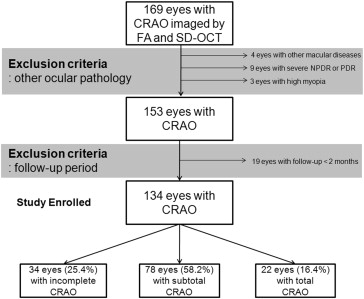
This retrospective study included 169 eyes from 168 patients with CRAO who (1) had visited Seoul National University Bundang Hospital between January 2009 and April 2014 for vision loss or a defect of the visual field occurring within 7 days of the initial visit and (2) had undergone fluorescein angiography and SD OCT (Spectralis OCT; Heidelberg Engineering Inc, Heidelberg, Germany) evaluation at the initial visit. Patients with a history of ocular trauma, macular disease (n = 4), severe nonproliferative or proliferative diabetic retinopathy (n = 9), ocular surgery other than cataract surgery, or high myopia (>6 diopters; n = 3) were excluded. Patients with a follow-up of less than 2 months (n = 19) also were excluded. In total, 134 eyes from 133 patients with acute CRAO were included for the analyses ( Figure 1 ).
Ophthalmic Examinations
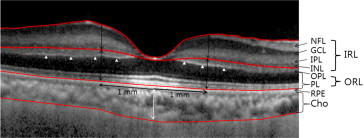
All patients underwent a complete ophthalmic examination, which included a measurement of the best-corrected visual acuity (BCVA), slit-lamp biomicroscopy, indirect ophthalmoscopy, fundus photography (VX-10; Kowa OptiMed, Tokyo, Japan), fluorescein angiography, and SD OCT imaging. The SD OCT scans were performed at a scan rate of 40 000 A-scans/second over a 4.5 × 6.0-mm area. The eye-tracking system (ART Module, Heidelberg Engineering Inc) of the Spectralis SD OCT was used to minimize motion artifacts and enhance image comparability over time. Follow-up scans were performed automatically in the same location at each visit, and the scan position was confirmed before comparing the serial images. In patients with unilateral CRAO, structural changes in the retina were evaluated and compared with the contralateral eye without CRAO by assessing the structural integrity of the retinal layers and changes in the thickness or reflectivity of specific retinal layers. In 1 patient with sequential bilateral CRAO, the first eye with CRAO was compared with the contralateral eye (healthy at the first evaluation). In this patient, the contralateral eye at 12 months after the initial visit, when it subsequently had developed CRAO, was compared with the same eye at the first evaluation. The thickness of the inner and outer retinal layers was measured at 1 mm temporal, nasal, superior, and inferior to the fovea. The inner retinal thickness, consisting of the combined ganglion cell layer, inner plexiform layer, and inner nuclear layer in the macular area, was measured manually using the in-built calipers of the OCT system ( Figure 2 ). The outer retinal thickness, consisting of the combined outer plexiform layer, outer nuclear layer, inner segment, and outer segment, was measured between the inner border of the outer nuclear layer and that of the retinal pigment epithelium ( Figure 2 ). The protocol used for macular thickness acquired a 512 × 128 scan macular cube, which was used for quantitative evaluation of the thickness. A circular topographic macular map of 3 circular areas (including the foveal region, an inner macular ring, and an outer macular ring) with Early Treatment Diabetic Retinopathy Study–type sectors, was generated for obtaining the retinal thickness in the fovea, parafovea, and perifovea, respectively. Central macular thickness (CMT) was measured within the innermost central circle (1000 μm in diameter) of the macular thickness scan. Macular edema (ME) was defined as CMT of more than 300 μm.
Full-thickness choroidal images were obtained using EDI OCT with eye-tracking and image-averaging systems, as previously described. The device was operated by an experienced technician, who positioned the OCT camera close enough to the eye to obtain an inverted image. Subfoveal choroidal thickness (SFCT) was measured manually using calipers, as the distance between the outer border of the retinal pigmented epithelium to the inner surface of the sclera. All measurements were performed independently by 2 masked investigators (S.J.A., S.J.W.). For quantitative analyses, the average of 2 independent measurements was used. Interobserver agreement in the thickness measurements of the SFCT and inner and outer retinal thickness was assessed by an intraclass correlation coefficient. Baseline OCT images were compared with those obtained 1 month later and those obtained at the final visit to identify quantitative and qualitative changes in the retina and choroid over time.
Treatment
Patients with CRAO were treated with either standard treatment or intra-arterial thrombolysis (IAT) as described in our previous report. The standard treatment consisted of ocular massage (repeated manual compression for 10 to 15 seconds followed by sudden release, using a 3-mirror contact lens for 3 to 5 minutes) and IOP-lowering agents (topical timolol 0.5%, oral acetazolamide 500 mg).
Detailed procedures for IAT have been described in our previous report. IAT was performed together with cerebral angiography. The microcatheter (Excelsior SL-10; Stryker Neurovascular, Fremont, California, USA) was placed in the proximal segment of the ophthalmic artery, and up to 500 000 units of urokinase (Green Cross, Yongin, South Korea) were injected slowly by hand until visual improvement was noted.
Statistical Analyses
Data for continuous variables are expressed as the mean ± standard deviation, where applicable, and were compared among CRAO stages by analysis of variance. Frequency data were compared using a χ 2 or Fisher exact test. Visual acuity measurements were converted to the logarithm of the minimal angle of resolution (logMAR) for all analyses. Severe vision loss was defined as BCVA of worse than 20/200 at the final examination. Linear and multivariate stepwise regression analyses were performed to evaluate the association of baseline clinical and OCT features with final BCVA. To identify the clinical and OCT features significantly associated with severe vision loss, multivariate logistic regression analysis was performed. Statistical analyses were performed using SPSS version 18.0 for Windows (SPSS, Inc, Chicago, Illinois, USA), and a P value less than .05 was considered to indicate a statistically significant difference.
Results
Clinical Characteristics and Optical Coherence Tomography Features at Baseline
Table 1 presents the demographic and clinical characteristics of the study subjects (81 men and 52 women; mean age, 59.3 ± 17.0 years [range, 17 to 88 years]; mean follow-up duration of OCT examination, 11.7 ± 14.0 months [range, 2 to 57 months]). The incomplete, subtotal, and total CRAO group included 34 (25.4%), 78 (58.2%), and 22 (16.4%) eyes, respectively.
| Characteristic | Mean or Number |
|---|---|
| Male-to-female ratio, no. (%) | 81:52 (60.9%:39.1%) |
| Mean age at presentation (y) | 59.3 ± 17.0 (range, 17 to 88) |
| Mean follow-up period (mo) | 11.7 ± 14.0 (range, 2 to 57) |
| Time from symptom onset to visit (h) | 31.4 ± 43.1 (range, 1 to 168) |
| CRAO stage, incomplete:subtotal:total (%) | 34:78:22 (25.4:58.2:16.4) |
| Intra-arterial thrombolysis (%) | 73 (54.5%) |
| Baseline best-corrected visual acuity, logMAR (range) | 2.25 ± 0.52 (NLP to 20/30) |
| Baseline central macular thickness (μm) | 416.9 ± 181.0 (213 to 1176) |
| Baseline subfoveal choroidal thickness (μm) | 239.0 ± 84.9 (91 to 504) |
Representative photographic images of the fundus and SD OCT for each group of incomplete, subtotal, and total CRAO are shown in Figure 3 . Hyperreflectivity without definite thickening in the inner retinal layers was noted in the eye with incomplete CRAO. In contrast, severe edema of the inner retinal layers, which mainly contributed to ME, was observed in the eyes with subtotal and total CRAO. Overall, OCT revealed inner and outer retinal thickening (frequency, 85.8% and 73.1%, respectively), loss of the organized layered structure of the retina (56.7%), and inner retinal (5.2%) and subretinal fluid (14.2%) in eyes with CRAO. Inner retinal thickening was noted in 64.7% with incomplete, 91.0% with subtotal, and 100% with total CRAO ( Table 2 ). A loss of the organized layered structure of the inner retina was noted in 11.8%, 7.5%, and 77.3% of eyes with incomplete, subtotal, and total CRAO, respectively.
| Features | All (n = 134) | Incomplete (n = 34) | Subtotal (n = 78) | Total (n = 22) | P Value a |
|---|---|---|---|---|---|
| At baseline | |||||
| Macular edema b | 104 (77.6) | 14 (41.2) | 69 (88.5) | 21 (95.5) | < .001 c |
| Inner retinal morphologic features | |||||
| Inner retinal thickening | 115 (85.8) | 22 (64.7) | 71 (91.0) | 22 (100) | < .001 c |
| Loss of the organized layered structure | 76 (56.7) | 4 (11.8) | 55 (70.5) | 17 (77.3) | < .001 c |
| Inner retinal hyperreflectivity | 134 (100) | 34 (100) | 78 (100) | 22 (100) | 1.0 |
| Inner retinal fluid | 7 (5.2) | 0 | 6 (7.7) | 1 (4.5) | .287 |
| Outer retinal morphologic features | |||||
| Outer retinal thickening | 98 (73.1) | 19 (55.9) | 59 (75.6) | 20 (90.9) | .011 c |
| Prominent middle limiting membrane | 80 (59.7) | 25 (73.5) | 50 (64.1) | 5 (22.7) | < .001 c |
| Subretinal fluid | 19 (14.2) | 0 | 11 (14.1) | 8 (36.4) | < .001 c |
| At the final examination | |||||
| Retinal thinning d | 133 (99.3) | 33 (97.1) | 78 (100) | 22 (100) | .458 |
| Foveal photoreceptor defect | 66 (49.3) | 5 (14.7) | 39 (50) | 22 (100) | < .001 c |
a Obtained by 2 × 3 Fisher exact test, which examined the difference of frequencies among the 3 stages of central retinal artery occlusion.
b Central macular thickness > 300 μm.
d Baseline central macular thickness in the contralateral eye more than final CMT in the eye with central retinal artery occlusion.
In the outer retinal layers, a prominent middle limiting membrane sign (as denoted by arrowheads in Figure 2 ) was noted in 73.5%, 50%, and 22.7% of patients with incomplete, subtotal, and total CRAO, respectively. Nineteen (55.9%), 59 (75.6%), and 20 (90.9%) patients with incomplete, subtotal, and total CRAO, respectively, showed outer retinal thickening. Subretinal fluid was observed in 0%, 14.1%, and 36.4% of patients with incomplete, subtotal, and total CRAO, respectively.
Table 2 and Figure 4 outline the qualitative and quantitative OCT features in each group of CRAO patients, respectively. As shown in Figure 4 , the mean baseline CMT showed significant differences among the 3 groups ( P < .001, analysis of variance) The differences in the frequency of ME and severe macular thickening (CMT > 500 μm) among the 3 stages were statistically significant (both P < .001, Fisher exact test). The SFCT was measurable in 32 (94.1%), 71 (91.0%), and 17 (77.3%) of incomplete, subtotal, and total CRAO patients at baseline, respectively. The intraclass correlation coefficient between the 2 measurements of SFCT was 0.982 (95% confidence interval, 0.966 to 0.991). There was a significant difference in the SFCT between the eyes with CRAO and the contralateral eyes only in a subgroup of the total CRAO.
Structural Changes of the Retina over Time
Figure 5 shows the structural changes of the retina over time in eyes with CRAO. Inner retinal atrophic changes were noted particularly in the area of previous hyperreflectivity and thickening, which resulted in a thinning of the inner retina by the final examination. The intraretinal and subretinal fluid and the prominent middle limiting membrane sign had disappeared by 1 month after the initial visit. In all the stages, the mean CMT decreased significantly at 1 month and had decreased further by the final visit (both P < .001, paired t test). The final CMT in the eye with incomplete, subtotal, and total CRAO showed significant differences among the 3 groups ( P = .010). Notably, a foveal photoreceptor defect was observed in 5 (14.7%), 39 (50%), and 22 (100%) patients with incomplete, subtotal, and total CRAO, respectively, showing a significant difference among the groups ( P < .001, Fisher exact test) at the final visit.


