Purpose
To evaluate the test-retest reliability and validity of the new automated computerized distance visual acuity and stereoacuity test for children, which uses an interactive video game.
Design
Retrospective, observational case series.
Methods
A total of 102 children aged between 3 and 7 years underwent the Snellen visual acuity test, the Distance Randot Stereotest, and the new automated computerized distance visual acuity and stereoacuity test. The test-retest reliability and validity of the automated computerized tests were assessed and compared with the Snellen visual acuity test and the Distance Randot Stereotest with frequency distributions of the differences, Bland-Altman plots, and Deming regression.
Results
The automated computerized distance visual acuity test had high test-retest reliability (95% limits of agreement ±0.18 logMAR, 90.0% of the differences within 0.2 logMAR) and acceptable validity as compared with the Snellen visual acuity chart (95% limits of agreement ±0.27 logMAR, 81.3% of the differences within 0.2 logMAR). The automated computerized distance stereoacuity test had high test-retest reliability (95% limits of agreement ±0.29 log arc second, 95.1% of the differences within 0.3 log arc second) and acceptable validity as compared with the Distance Randot Stereotest (95% limits of agreement ±0.35 log arc second, 93.9% of the differences within 0.3 log arc second).
Conclusions
The new automated computerized distance visual acuity and stereoacuity test, which uses an interactive video game, has good reliability and acceptable validity compared with the Snellen visual acuity chart and the Distance Randot Stereotest.
An accurate measurement of visual acuity and stereoacuity is essential for the screening of amblyopia and disturbance of binocular vision in children. An accurate, standardized, and easy-to-perform visual acuity and stereoacuity measurement is necessary to screen for visual disturbance, especially outside the hospital setting.
A computerized visual acuity and stereoacuity test is a potential alternative to visual function tests in community-based screenings or hospital-based measurements. Several studies have reported results of computerized visual acuity tests and stereoacuity tests. However, only a few studies have evaluated their validity compared with the standard tests, and most studies have not involved preschool-aged children.
We developed a computerized visual acuity and stereoacuity test and an automated protocol to measure visual acuity and stereoacuity. In addition, we assessed the test-retest reliability and validated our new automated computerized test, comparing it with the Snellen visual acuity chart and the Distance Randot Stereotest in preschool subjects.
Methods
Subjects
The institutional review board of Seoul National University Bundang Hospital (SNUBH) approved this retrospective observational case series study. A total of 102 children aged between 3 and 7 years who visited the pediatric ophthalmology and strabismus clinic of SNUBH participated. Only subjects who had completed all measurements were included.
Automated Computerized Distance Visual Acuity and Stereoacuity Test
We developed a computerized automated distance visual acuity and distance stereoacuity measurement program with an Adobe Flash–based user interface (Seoul National University R&DB Foundation, Seoul, Republic of Korea). It consists of picture-matching tasks in a video game format with several animated characters representing Seoul National University Children’s Hospital. In the test, a single optotype or vectograph is presented, and then the subject must select a proper match from 3 examples in order to advance to the next stage of the game ( Figure 1 , Left). Optotypes in our computerized visual acuity test were black digits and Landolt rings with illuminated white backgrounds at 11 levels with varying sizes corresponding to the Snellen visual acuity chart. One to 3 questions are asked at each visual acuity level. Correct responses to more than half of the questions at each level are required to progress to the next level. Starting at level 20/40, the level goes either up or down, according to the subject’s response. In the computerized stereoacuity test, vectographs yielding thresholds of 60, 100, 200, and 400 arc seconds (arcsec) are presented, the same as the Distance Randot Stereotest (Stereo Optical Co, Inc, Chicago, Illinois, USA). Vectographs were created using color anaglyph systems with complementary colors red and cyan. Four geometric shapes (circle, triangle, square, and star) were anaglyphed. At each stereoacuity level, 2 out of 2 correct responses are required to progress to the next level ( Figure 1 , Right).

After all tests were completed, the results were displayed on a report screen. A report file was also generated on the desktop database, containing the subject’s identification, elapsed time, and the measurement of visual acuity and stereoacuity.
Evaluation Procedures
Each subject underwent a distance visual acuity test using the Snellen visual acuity chart and a distance stereoacuity test using the Distance Randot Stereotest administrated by eye care professionals and at a distance of 3 meters. Then, computerized tests were conducted by a non–medical professional, who followed written instructions on the display terminal. An eye patch was applied to occlude the opposite eye during monocular computerized visual acuity tests, and a pair of red-and-green glasses was used to dissociate the eyes during the computerized stereoacuity test. The computerized visual acuity tests and stereoacuity tests were administered 2 times, in succession per subject. We used a desktop personal computer connected to a monitor. Subjects sat 3 meters away from the monitor and played with a computer mouse. Only the visual acuities of the left eyes were included in the analysis.
Statistical Analyses
Visual acuity and stereoacuity values were transformed to logMAR and log arcsec for analysis. Transformed visual acuity ranged from 0.00 (decimal visual acuity 1.0) to 1.00 (decimal visual acuity 0.1). For the decimal visual acuity worse than 0.1, the next log level (0.1 logMAR progression) above the largest disparity, 1.10, was assigned. Transformed stereoacuity ranged from 1.78 (60 arcsec) to 2.60 (400 arcsec), and the next log level (0.3 log arcsec progression) above the largest disparity, 2.90, was assigned for “nil.”
The test-retest reliability between initial and repeated computerized tests and the validity of the computerized test compared with conventional tests were assessed according to the frequency distributions of the differences, Bland-Altman plots, and Deming regression. Mean differences and 95% limits of agreement were evaluated and graphically presented as Bland-Altman plots.
All statistical analyses were conducted with SPSS for Windows (version 18.0; SPSS, Inc, Chicago, Illinois, USA) and Analyse-It statistical software (version 2.26; Analyse-It Software, Ltd Leeds, United Kingdom). Continuous variables were expressed as means ± standard deviations.
Results
Subjects
The mean age of the 102 subjects was 5.0 ± 1.0 years. Fifty-three subjects (52.0%) were girls, 12 (11.8%) had a history of strabismus surgery, and 53 (52.0%) had ocular deviation greater than 10 prism diopters. Thirty-seven subjects (36.3%) wore spectacles.
The mean distance visual acuity of the left eye measured by the Snellen visual acuity chart was 0.22 ± 0.19 logMAR. The mean distance stereoacuity measured by the Distance Randot Stereotest was 2.81 ± 0.23 log arcsec, and 85 subjects (83.3%) reported 2.90 log arcsec (“nil”).
Of the 102 subjects, 80 subjects who underwent the computerized visual acuity test with digits and 81 subjects who underwent the computerized stereoacuity test in its final version were included in the reliability and validity analysis.
Automated Computerized Visual Acuity Test
The mean distance visual acuity of the left eyes measured by the computerized test was 0.18 ± 0.14 logMAR in the initial test and 0.22 ± 0.17 logMAR in the repeated test.
Table 1 shows the agreement between the initial and repeated computerized tests, and between the Snellen visual acuity chart and the initial computerized test. The 95% limits of agreement were ±0.18 logMAR between the initial and repeated computerized tests, and ±0.27 logMAR between the Snellen visual acuity chart and the initial computerized test. These results are also represented in the Bland-Altman plots in Figures 2 and 3 .
| Mean Difference | 95% CI for the Mean | SD Differences | 95% CI for Agreement | Min/Max Difference | |
|---|---|---|---|---|---|
| Initial program measurement – repeated program measurement (logMAR) | −0.03 | −0.05, −0.01 | 0.09 | −0.21, 0.14 | −0.22, 0.20 |
| Snellen visual acuity chart measurement – initial program measurement (logMAR) | 0.05 | 0.02, 0.08 | 0.14 | −0.22, 0.31 | −0.22, 0.48 |
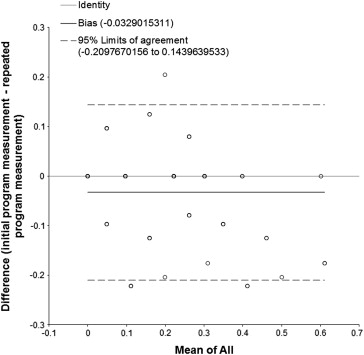
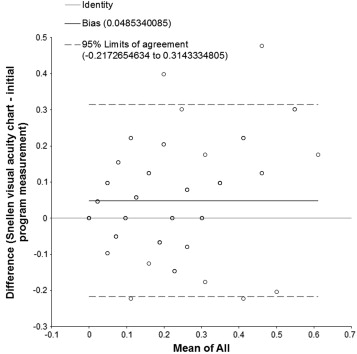
Ninety percent of the repeated computerized test measurements were within 0.2 logMAR units of the initial measurements (0.2 logMAR unit represents 2 logMAR lines on a visual acuity chart). The initial computerized test measurements were within 0.2 logMAR units of the Snellen visual acuity chart measurements in 81.3%.
A greater level of disagreement between measurements in those with worse visual acuity can be inferred from Figures 2 and 3 , suggesting proportional biases. The results of Deming regression performed to investigate for such proportional biases are presented in Table 2 . Significant proportional biases existed between measurements with the initial and repeated program measurements, and between the Snellen visual acuity chart and initial program measurements. However, there was no constant bias between measurements.
| Model | Deming Regression Slope (SE) | 95% CI Slope | 95% CI y Intercept When x = 0 |
|---|---|---|---|
| Initial program measurement (y), repeated program measurement (x) (logMAR) | 0.80 (0.05) | 0.70, 0.90 | −0.01, 0.04 |
| Snellen visual acuity chart measurement (y), initial program measurement (x) (logMAR) | 1.40 (0.20) | 1.01, 1.79 | −0.09, 0.04 |
Thirty-four subjects (34/80, 42.5%) who were under the age of 5 showed similar results compared with the whole subjects. The 95% limits of agreement were ±0.19 logMAR between the initial and repeated computerized tests, and ±0.27 logMAR between the Snellen visual acuity chart and the initial computerized test.
Automated Computerized Stereoacuity Test
The mean distance stereoacuity measured by the computerized tests was 2.88 ± 0.11 log arcsec in the initial test and 2.83 ± 0.18 log arcsec in the repeated test. Among the 81 subjects who underwent the computerized stereoacuity test, 79 (97.5%) and 69 (85.1%) reported 2.90 log arcsec (“nil”), respectively.
Table 3 shows the agreement between the initial and repeated computerized tests, and between the Distance Randot Stereotest and the initial computerized test. The 95% limits of agreement were ±0.29 log arcsec between the initial and repeated computerized tests, and ±0.35 log arcsec between the Distance Randot Stereotest and the initial computerized test.


