Purpose
To compare choroidal thickness in patients with intermediate or advanced age-related macular degeneration (AMD) and control subjects using enhanced-depth imaging optical coherence tomography (EDI-OCT).
Design
Retrospective cross-sectional study of 325 eyes from 164 subjects who underwent EDI-OCT for the Age-Related Eye Disease Study (AREDS) 2 Ancillary Spectral Domain OCT study.
Methods
Choroidal thickness was measured by semi-automated segmentation of EDI-OCT images from 1.5 mm nasal to 1.5 mm temporal to the fovea. Multivariate linear regression was used to evaluate the association of subfoveal choroidal thickness or average choroidal thickness across the central 3-mm segment with systemic and ocular variables. Choroidal thickness measurements were compared between eyes with no AMD (n = 154) (ie, controls), intermediate AMD (n = 109), and advanced AMD (n = 62).
Results
Both subfoveal and average choroidal thicknesses were associated with age ( P < .001) and refractive error ( P < .001), but not other variables tested. Mean average choroidal thickness was significantly reduced in advanced AMD as compared with control eyes ( P = .008), with no significant difference between advanced and intermediate AMD eyes ( P = .152) or between intermediate AMD and control eyes ( P = .098). Choroidal thinning was also noted from 1.5 mm nasal to 1.5 mm temporal to the fovea when comparing advanced AMD with control eyes ( P < .05 at all 0.5 mm interval locations). After adjustment for age and refractive error, however, there was no significant difference in subfoveal ( P = .675) or average choroidal thickness ( P = .746) across all 3 groups.
Conclusions
When adjusted for age and refractive error, central choroidal thickness may not be significantly influenced by AMD status based on AREDS categorization.
The pathogenesis of age-related macular degeneration (AMD) has been attributed to a combination of genetic and environmental factors. In early and intermediate stages, disease progression is hypothesized to be associated with oxidative damage and inflammation at the level of the retinal pigment epithelium (RPE), which results in focal hyperpigmentation and drusen formation. In later stages, exudation may result from choroidal neovascularization (CNV) through processes driven by vascular endothelial growth factor (VEGF), while nonexudative loss of outer retina, RPE, and choriocapillaris may occur in the form of geographic atrophy (GA). However, the choroid’s role in AMD pathophysiology has remained unclear.
Early hypotheses of a hemodynamic model for AMD progression suggest that stiffening of the sclera with advanced age leads to a reduction in choroidal perfusion resulting in outer retinal ischemia. Studies using laser Doppler flowmetry have demonstrated impaired choroidal blood flow in eyes with increasing severity of AMD. Histopathologic analyses have also shown choroidal vascular dropout in early AMD, particularly within the choriocapillaris layer. The advent of enhanced-depth imaging optical coherence tomography (EDI-OCT), which provides improved signal penetration over conventional spectral-domain OCT (SD OCT), has in recent years allowed better in vivo visualization of choroidal anatomy in AMD. Yet, studies measuring choroidal thickness in AMD have yielded conflicting results, with some describing choroidal thinning in nonexudative AMD and others reporting no significant difference from normal subjects. Neovascular AMD has also been linked with choroidal thinning in some reports, although the effect may be related to anti-VEGF therapy. Conclusions drawn from many of these studies are limited by the significant variability of choroidal thickness with age, refractive error, axial length, and diurnal cycle, which are not often adjusted for in these studies. Moreover, the diagnosis of neovascular AMD may overlap with similar conditions, including polypoidal choroidal vasculopathy and central serous chorioretinopathy, which are associated with a thickened choroid.
The purpose of this investigation is to compare choroidal thickness in AMD and control eyes from subjects prospectively enrolled in the Age-Related Eye Study 2 (AREDS2) Ancillary Spectral Domain OCT study who underwent EDI-OCT imaging. Multivariate regression modeling was employed to identify systemic and ocular factors that may be associated with choroidal thickness. We then measured and compared choroidal thickness in eyes with intermediate or advanced AMD, based on AREDS classification, vs those from control subjects using semi-automated choroidal segmentation software and adjusting for covariate factors. Finally, we performed subgroup analysis to compare choroidal thickness in neovascular AMD vs GA.
Methods
Patient Selection
The AREDS2 Ancillary Spectral Domain OCT Study ( ClinicalTrials.gov identifier NCT00734487 ) is an ancillary study to the prospective, multicenter AREDS2 ( ClinicalTrials.gov identifier NCT00345176 ) for the purpose of identifying and evaluating SD OCT characteristics associated with AMD disease progression. The study followed the tenets of the Declaration of Helsinki and was approved by the Institutional Review Board at all respective institutions. Subjects from the Duke Eye Center and National Eye Institute underwent EDI-OCT on at least 1 study visit between 2011 and 2013, and were included in this cross-sectional analysis. Major inclusion and exclusion criteria for AREDS2 and control subjects, as well as criteria for AMD classification, have been previously described. Additionally, eyes with high myopia >6 diopters were also excluded from this study. All participants had best-corrected visual acuity (BCVA) measured as Early Treatment Diabetic Retinopathy Study (ETDRS) letter score and refractive error measured by a certified ophthalmic technician.
Image Acquisition
Enhanced-depth imaging was performed on both eyes from each subject using the Heidelberg Spectralis SD OCT (870 nm) device (Heidelberg Engineering, Heidelberg, Germany). EDI-OCT scans were obtained using the Spectralis EDI mode, a preset, software-driven algorithm that places the RPE near the zero-delay line while producing an upright enhanced choroidal image. In EDI-OCT mode, a single 30-degree horizontal line scan (approximately 8.9 mm) captures 1536 A-scans per B-scan with 40 averaged B-scans per image, with automatic averaging and eye-tracking features. Parameters for standard SD OCT volume scans have been described previously.
Choroidal Segmentation
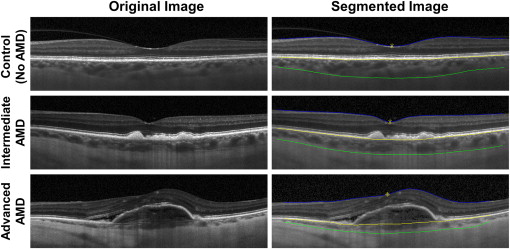
CT was measured semi-automatically using the Duke Optical Coherence Tomography Retinal Analysis Program (DOCTRAP). This software, which employs automated segmentation algorithms based on graph theory and dynamic programming, also provides a custom graphical user interface (GUI) for manual adjustments to allow for improved segmentation precision. The inner boundary of the choroid is defined by the outer border of the hyperreflective layer corresponding to the Bruch membrane, while the outer boundary is defined by the outer border of the choroid stroma. The visibility of a hyporeflective band corresponding to the suprachoroidal layer was determined by 2 independent masked observers (G.Y. and P.A.P.) using methods described previously, with any disagreements resolved by a masked senior grader (C.A.T.). When visible, the suprachoroidal layer was not included in choroidal thickness measurements, as the relevance of the suprachoroidal layer to AMD pathogenesis has not been well established. Choroidal thickness measurements were recorded at the subfoveal location and at 0.5-mm intervals from 1.5 mm nasal to 1.5 mm temporal to the fovea ( Figure 1 ). Corresponding retinal thickness measurements were also taken at the fovea (CFT) and at 0.5-mm intervals from 1.5 mm nasal to 1.5 mm temporal to the fovea. To minimize the variability in measurements taken at single point locations, average choroidal and retinal thicknesses were also calculated, respectively, as the mean of choroidal and retinal thickness measurements from the central 3-mm segment (from 1.5 mm nasal to 1.5 mm temporal to the fovea), based on the 3-mm diameter of the AREDS maculopathy grading grid for color fundus photography grading.
Statistical Analyses
Statistical analyses were performed using SAS (version 9.3; SAS Institute Inc, Cary, North Carolina, USA). Differences in systemic (age, sex, and smoking status) and ocular (laterality, lens status, refractive error, BCVA) characteristics between control and eyes with AMD were compared using generalized estimating equations to account for up to 2 eyes measured per subject. Time of image acquisition was compared using generalized estimating equations. Univariate linear regression followed by multivariate linear regression modeling was employed to evaluate the association of choroidal thickness with systemic and ocular parameters, as well as retinal thickness (CFT or average retinal thickness). Differences in choroidal and retinal thickness measurements were compared using analysis of variance using generalized estimating equations. To adjust for choroidal thickness variation with age and refractive error, comparisons were made using analysis of covariance using generalized estimating equations. Fellow eye comparisons were made using paired-samples t tests.
Results
Demographic and Clinical Characteristics
The 164 subjects (mean age 72.1 ± 8.6 years) included in this analysis consisted of 67 male (40.9%) and 97 female subjects (59.1%), with 151 (92.1%) white and 13 (7.9%) nonwhite ( Table 1 ). Among these, 81 (49.4%) were never smokers, 28 (17.1%) were former smokers (quit >1 year prior), and 55 (33.5%) were current smokers. Both eyes were included from 161 subjects; in the remaining 3 subjects, 1 eye was excluded owing to high myopia >6 diopters. Of the 325 eyes included in this study, 154 eyes (47.4%) were from control participants with no AMD, 109 eyes (33.5%) had intermediate AMD, and 62 eyes (19.1%) had advanced AMD. A total of 162 (49.8%) were right eyes and 256 (78.8%) were phakic at the time of imaging, with more pseudophakic eyes in AMD vs control eyes ( P < .001). Mean refractive error was +0.194 ± 2.06 diopters spherical equivalent, with no significant difference among the 3 groups ( P = .236). As expected, BCVA was significantly reduced in eyes with intermediate AMD ( P < .001) and advanced AMD ( P < .001) when compared with control eyes. Mean age of subjects was also greater with more advanced AMD status ( P < .001). There was no significant difference among the 3 groups with respect to the median time of day at which the EDI-OCT image was obtained ( P = .084).
| No AMD (n = 154) | Intermediate AMD (n = 109) | Advanced AMD (n = 62) | P Value a | |
|---|---|---|---|---|
| Age (y ± SD) | 68.22 ± 7.33 | 74.34 ± 8.32 | 77.82 ± 7.56 | <.001 b |
| Sex (male/female) | 64/90 | 41/68 | 29/33 | .623 |
| Smoking (never/former/current) | 79/2/73 | 56/35/18 | 26/18/18 | .185 |
| Laterality (right/left) | 77/77 | 53/56 | 32/30 | .767 |
| Lens status (phakic/pseudophakic) | 143/11 | 73/36 | 40/22 | <.001 b |
| Refraction (mean diopters ± SD) | −0.023 ± 2.11 | +0.23 ± 1.79 | +0.67 ± 2.29 | .236 |
| BCVA (mean ETDRS letters ± SD) | 84.13 ± 4.96 | 78.75 ± 10.28 | 52.50 ± 24.14 | <.001 b |
| Time of OCT (median time) | 12:56 | 12:54 | 12:45 | .084 |
a Using generalized estimating equations.
Variables Associated With Choroidal Thickness
Univariate regression analyses of systemic and ocular variables revealed a significant association of subfoveal choroidal thickness with age (β = −4.58, P < .001), lens status ( P = .046), refractive error (β = 6.52, P = .045), and BCVA (β = 1.30, P = .001), but not with sex, smoking history, laterality, CFT, or average retinal thickness ( Table 2 ). Similarly, average choroidal thickness was also associated with age (β = −4.22, P < .001), lens status ( P = .041), refractive error (β = 6.45, P = .037), and BCVA (β = 1.10, P = .003), but not with other variables. Multivariate regression modeling using these variables ( Table 2 , Model 1) showed that only age ( P < .001) and refractive error ( P < .001), but not lens status ( P = .614–.641) or BCVA ( P = .143–.261), were significant predictors of subfoveal and average choroidal thickness. A repeat analysis using only age and refractive error ( Table 2 , Model 2) confirmed that both subfoveal and average choroidal thickness are associated with younger age and hyperopic refractive error ( P < .001 for all values). These results suggest that choroidal thickness decreases with advanced age and myopic refractive error across all eyes included in the study.
| Subfoveal Choroidal Thickness | Average Choroidal Thickness | |||||
|---|---|---|---|---|---|---|
| Estimate | SE | P Value a | Estimate | SE | P Value a | |
| Univariate linear regression | ||||||
| Age | −4.58 | 0.82 | <.001 c | −4.22 | 0.78 | <.001 c |
| Sex | ||||||
| Female | 249.39 | 9.18 | .316 | 240.25 | 8.79 | .290 |
| Male | 233.25 | 13.20 | ||||
| Smoking history | ||||||
| Current | 253.97 | 14.02 | .225 | 243.30 | 13.44 | .199 |
| Former | 215.26 | 18.05 | 206.81 | 16.50 | ||
| Never | 244.52 | 10.41 | 236.43 | 9.68 | ||
| Laterality | ||||||
| Right | 245.59 | 8.13 | .292 | 236.23 | 7.54 | .250 |
| Left | 239.90 | 8.17 | 231.23 | 7.54 | ||
| Lens status | ||||||
| Phakic | 250.58 | 8.31 | .046 c | 241.15 | 7.85 | .041 c |
| Pseudophakic | 213.62 | 16.90 | 206.16 | 15.5 | ||
| Refractive error | 6.52 | 3.25 | .045 c | 6.45 | 3.10 | .037 c |
| BCVA | 1.30 | 0.40 | .001 c | 1.10 | 0.37 | .003 c |
| CFT | −0.07 | 0.07 | .289 | −0.07 | 0.06 | .271 |
| Average retinal thickness | −0.03 | 0.10 | .729 | −0.04 | 0.09 | .667 |
| Multivariate Linear Regression | ||||||
| Model 1 | ||||||
| Age | −4.69 | 0.91 | <.001 c | −4.42 | 0.85 | <.001 c |
| Lens status | 9.11 b | 18.04 | .614 | 7.80 b | 16.71 | .641 |
| Refractive error | 10.75 | 2.93 | <.001 c | 10.23 | 2.81 | <.001 c |
| BCVA | 0.57 | 0.39 | .143 | 0.40 | 0.36 | .261 |
| Model 2 | ||||||
| Age | −4.97 | 0.79 | <.001 c | −4.60 | 0.75 | <.001 c |
| Refractive error | 9.93 | 2.96 | <.001 c | 9.61 | 2.81 | <.001 c |
a Using generalized estimating equations.
Choroidal and Retinal Thickness in Age-Related Macular Degeneration
Without adjusting for age and refractive error, mean average choroidal thickness was significantly lower in eyes with advanced AMD when compared to control eyes ( P = .008), with no significant differences between eyes with advanced and intermediate AMD ( P = .152) or between intermediate AMD and control eyes ( P = .098). Decreased choroidal thicknesses were also noted at the fovea (subfoveal choroidal thickness) and at all other locations from 1.5 mm nasal to 1.5 mm temporal to the fovea ( P < .05 at all locations) when comparing advanced AMD with control eyes ( Figure 2 ). However, after adjustment for age and refractive error, mean average choroidal thickness and all choroidal thickness measurements across the macula ( Table 3 , Figure 2 ) showed no significant differences between the 3 groups ( P > .05 at all locations). In contrast, average retinal thickness ( Table 3 ) and retinal thickness measurements across the macula ( Table 3 , Figure 2 ) were significantly greater in more advanced forms of AMD even after adjusting for age and refractive error ( P < .05 at all locations except 1.0 mm nasal to the fovea, where P = .054). A scatterplot showing the relationship between average choroidal thickness and age shows significant variability of choroidal thickness among individuals in each of the 3 groups, with no discernable mean reduction in average choroidal thickness among eyes with AMD ( Figure 3 ). Together, these results indicate that unlike differences in retinal thickness, the apparent choroidal thinning in advanced AMD may be attributed at least to age and refractive error as covariants. Variation in choroid-scleral junction appearance does not appear to affect these findings, as the proportion of eyes with a visible suprachoroidal layer is similar between the 3 groups ( P = .107) ( Table 3 ).
| No AMD (N = 154) | Intermediate AMD (N = 109) | Advanced AMD (N = 62) | P Value a | |
|---|---|---|---|---|
| Mean subfoveal choroidal thickness (μm) ± SE | 246.87 ± 9.62 | 246.00 ± 10.87 | 226.74 ± 16.80 | .526 |
| No AMD vs intermediate AMD | (.953) | |||
| No AMD vs advanced AMD | (.297) | |||
| Intermediate AMD vs advanced AMD | (.297) | |||
| Mean average choroidal thickness (μm) ± SE | 237.01 ± 15.52 | 236.61 ± 10.16 | 220.47 ± 15.52 | .591 |
| No AMD vs intermediate AMD | (.979) | |||
| No AMD vs advanced AMD | (.353) | |||
| Intermediate AMD vs advanced AMD | (.341) | |||
| Mean central foveal thickness (μm) ± SE | 238.74 ± 3.89 | 260.43 ± 6.29 | 331.96 ± 28.70 | <.001 b |
| No AMD vs intermediate AMD | (.004) b | |||
| No AMD vs advanced AMD | (.002) b | |||
| Intermediate AMD vs advanced AMD | (.013) b | |||
| Mean average retinal thickness (μm) ± SE | 311.08 ± 2.60 | 323.34 ± 3.90 | 366.74 ± 19.44 | .004 b |
| No AMD vs intermediate AMD | (.009) b | |||
| No AMD vs advanced AMD | (.006) b | |||
| Intermediate AMD vs advanced AMD | (.025) b | |||
| Suprachoroidal layer visible (yes/no) | 89/65 | 58/51 | 26/36 | .107 |
a After adjustment for age and refractive error, using generalized estimating equations.
Choroidal Thickness in Neovascular Age-Related Macular Degeneration or Geographic Atrophy
Among eyes with advanced AMD (n = 62), 48 eyes (14.8%) showed CNV and were classified as neovascular AMD, while 14 eyes (4.3%) had central GA. Although mean average choroidal thickness was lower in eyes with CNV (193.5 ± 101.7 μm) than in eyes with central GA (224.9 ± 108.9 μm), there was no significant difference between the 2 groups ( P = .431), even after adjustment for age and refractive error ( P = .374). Similarly, choroidal thickness measurements across all points in the macula showed no significant difference between eyes with CNV and central GA ( P > .05 at all points). Among eyes with neovascular AMD, the mean cumulative number of anti-VEGF treatments was 9.43 injections, with no clear association between total anti-VEGF injections received and average choroidal thickness ( P = .583) or subfoveal choroidal thickness ( P = .492).
Although the category of advanced AMD included only fovea-involving central GA based on AREDS2 categorization, many eyes with intermediate AMD also exhibited signs of noncentral GA on fundus examination or color fundus photographs. Among eyes with intermediate or advanced AMD (n = 171), 44 eyes (25.7%) had either central or noncentral GA. Interestingly, while eyes with either central or noncentral GA showed no significant reduction in average choroidal thickness or single choroidal thickness measurements when compared with eyes without GA ( P > .05 at all points), adjustment for age and refractive error revealed borderline thinning along the central 1-mm segment among eyes with either type of GA ( P = .05–.069). Moreover, subgroup analysis of 13 eyes with GA area measured on color fundus photographs showed a significant inverse association between average choroidal thickness and GA area (R 2 = .906, P < .0001) after adjusting for age and refractive error ( Supplemental Figure , available at AJO.com ). These subgroup analyses suggest the possibility that choroidal thinning may be present in GA when larger areas of noncentral GA are also taken into account.
Fellow Eye Comparisons
To further assess choroidal thickness in AMD while minimizing confounding variables such as age and refractive error, choroidal thickness measurements were compared between fellow eyes in subjects with discordant stages of AMD. Twenty subjects had intermediate AMD in 1 eye and advanced AMD in the other (14 with neovascular AMD, 6 with GA). No subjects had intermediate or advanced AMD in only 1 eye with no ocular pathology in the fellow eye. Fellow eyes showed significant correlation in refractive error (R = 0.608, P = .004). CFT was significantly greater in eyes with neovascular AMD (353.2 ± 145.6 μm) relative to fellow eyes with intermediate AMD (271.4 ± 59.9 μm) ( P = .033). However, there was no significant difference in subfoveal choroidal thickness between eyes with neovascular AMD (215.6 ± 111.9 μm) and those with intermediate AMD (228.1 ± 106.1 μm) ( P = .360). Likewise, average choroidal thickness also showed no statistical difference between neovascular AMD (213.1 ± 107.7 μm) and intermediate AMD (221.7 ± 102.2 μm) ( P = .482). Eyes with central GA showed no significant difference from fellow eyes with intermediate AMD in CFT (186.3 ± 49.9 μm vs 201.3 ± 37.9 μm; P = .562), subfoveal choroidal thickness (229.7 ± 117.9 μm vs 225.8 ± 82.9 μm; P = .921), or average choroidal thickness (211.5 ± 105.2 μm vs 224.0 ± 86.4 μm; P = .684). These results further support our finding that advanced AMD is not associated with choroidal thinning when compared with fellow eyes with intermediate AMD.
Stay updated, free articles. Join our Telegram channel

Full access? Get Clinical Tree


