Purpose
To evaluate corneal endothelial cell density (ECD) in patients with dry eye disease (DED) compared to an age-matched control group.
Design
Cross-sectional, controlled study.
Methods
This study included 90 eyes of 45 patients with moderate to severe DED (aged 53.7 ± 9.8 years) and 30 eyes of 15 normal controls (aged 50.7 ± 9.8 years). All subjects had a complete ophthalmic evaluation including symptom assessment using the Ocular Surface Disease Index (OSDI) and corneal fluorescein staining. In addition, laser scanning in vivo confocal microscopy was performed to measure the density of the following parameters in the central cornea: endothelial cells, subbasal nerves, and subbasal immune dendritic cells.
Results
Corneal ECD was significantly lower in the DED group (2595.8 ± 356.1 cells/mm 2 ) than in the control group (2812.7 ± 395.2 cells/mm 2 , P = .046). The DED group showed significantly lower corneal subbasal nerve density (17.1 ± 6.9 mm/mm 2 ) compared to the control group (24.7 ± 4.4 mm/mm 2 , P < .001). Dendritic cell density was significantly higher in the DED group than in the controls (111.7 ± 137.3 vs 32.0 ± 24.4 cells/mm 2 , respectively, P = .002). There were statistically significant correlations between corneal ECD and dry eye severity parameters including the OSDI score (r s = −0.26, P = .03), and corneal fluorescein staining (r s = −0.28, P = .008).
Conclusions
There is a significant reduction in corneal ECD in DED that correlates with clinical severity of the disease.
Dry eye disease (DED) is one of the most commonly seen conditions in ophthalmic practice, affecting 5%–35% of the general population. It has been shown that the underlying pathogenic mechanisms for DED at the level of the ocular surface relate to tear hyperosmolarity, tear film instability, and associated ocular surface inflammation. In addition, there is ample evidence that innervation of the ocular surface plays a critical role in maintenance of a normal tear film, and disruption of the nerves leads to reduced tear secretion and resultant DED. In fact, reduced corneal nerve density has been demonstrated in patients with DED using in vivo confocal microscopy (IVCM).
The cornea has the highest nerve density in the body. In addition to providing sensation and regulating tear secretion, these nerves have been shown to play a significant role in maintaining corneal health and function. Although the trophic function of the corneal nerves on the epithelium has been established, this supportive role may not be limited to the epithelium. This has been suggested by recent data showing the presence of neurotrophic factors in all corneal layers, as well as significant changes in all these layers, including the endothelium, in cases with neurotrophic keratopathy.
As corneal nerves have been shown to be decreased in DED, we hypothesized that this would result in reduced corneal endothelial cell density (ECD). Therefore, this study was designed to evaluate ECD in patients with DED compared to an age- and sex-matched control group and to correlate this parameter with the clinical severity of the disease.
Patients and Methods
This cross-sectional study included 90 eyes of 45 patients with DED (DED group) and 30 eyes of 15 normal age- and sex-matched controls (control group), which were all recruited from the Cornea and Refractive Surgery Service, Massachusetts Eye and Ear Infirmary, Boston, Massachusetts. All subjects signed an informed consent form prior to participation in the study. The protocol of the study was approved by the Human Studies Committee of the Massachusetts Eye and Ear Infirmary, Boston, Massachusetts, and the research was conducted in accord with the requirements of the Health Insurance Portability and Accountability Act (HIPAA) and the tenets of the Declaration of Helsinki.
The DED group included patients with symptoms of DED who had an Ocular Surface Disease Index (OSDI) score greater than 22 and corneal fluorescein staining of 4 or more in National Eye Institute (NEI) grading scale. Patients with a history of increased intraocular pressure, previous contact lens wear, history of use of any medications known to have corneal toxicity, previous ocular surgery, any corneal disease including herpetic keratitis, or endothelial guttae were excluded. Individuals in the control group had normal healthy corneas and did not have any symptoms of DED, with a normal tear meniscus and no corneal or conjunctival staining. Individuals with a history of contact lens wear were also excluded from the control group. Individuals with diabetes mellitus were excluded from both DED and control groups.
All participants in the DED group had a complete ophthalmic evaluation, which included the following: OSDI questionnaire; measurement of the best-corrected visual acuity and intraocular pressure; slit-lamp biomicroscopy to assess corneal fluorescein staining (NEI scale, 0–15), conjunctival staining with lissamine green (NEI scale, 0–18), and tear break-up time (TBUT); and Schirmer test with anesthesia.
In Vivo Confocal Microscopy
To measure the density of corneal endothelium, subbasal immune dendritic cells, and subbasal nerves, central corneas of both eyes of all subjects were evaluated by IVCM using a Heidelberg Retina Tomograph 3 with the Rostock Cornea Module (Heidelberg Engineering, Heidelberg, Germany). This machine, which uses a 670-nm diode laser, provides digital images from the full thickness of the cornea through sequences consisting of 100 images per each one. Each image represents a coronal section of 384 × 384 pixels, which is equivalent to 400 × 400 μm of the cornea.
The details of imaging with IVCM have been described before. Briefly, a disposable sterile polymethylmethacrylate cap (Tomo-Cap; Heidelberg Engineering), filled with a layer of 0.3% hypromellose (GenTeal gel; Alcon, Fort Worth, Texas, USA) in the bottom, was mounted in front of the cornea module. After topical anesthesia by 0.5% proparacaine hydrochloride (Alcaine; Alcon), a drop of 0.3% hypromellose (GenTeal gel) was instilled in the eye. One drop of 0.3% hypromellose was also placed on the outside tip of the cap to improve optical coupling. Then, the module was manually advanced until the gel contacted the central surface of the cornea. After visualization of the superficial corneal epithelium, the focus was advanced to the corneal subbasal layer, usually at the depth of 50–80 μm. After obtaining 3–4 sequence scans of the subbasal layer in various locations of the central cornea, the focus was then advanced through the full thickness of the stroma and, finally, to the endothelium. Again, multiple locations in the central cornea were imaged using sequence scans of the endothelium.
The IVCM images from the endothelial layer were chosen to measure ECD using the variable-frame method. For this, the image was imported into the ImageJ software (National Institutes of Health, Bethesda, Maryland, USA; http://imagej.nih.gov/ij/ ). After adjusting for pixel/micrometer ratio, the Polygon Selection tool of ImageJ was used to mark the borders of the cells in the area of the image that had good quality with no distortion. Then, this selected area was measured in mm 2 . The cells present in the selected area were then counted using the Cell Counter plug-in of ImageJ, and were expressed as cells/mm 2 . For each eye, 2 IVCM images of the central corneal endothelium were measured and then averaged. Two independent observers measured ECD for each image and the average of the measurements by the observers was used for the analysis.
In addition to the measurement of ECD, the IVCM images of the subbasal layer were used to measure the density of subbasal nerves and epithelial immune dendritic cells, as previously described. To do so, 3 good-quality representative images from different locations of the subepithelial layer, which is located immediately posterior to the basal epithelial layer, were chosen for analysis. Dendritic cells were identified by their morphology of bright dendritiform structures with cell bodies that were different from linear structures of corneal nerves. For calculating the density of subbasal dendritic cells, ImageJ software (National Institutes of Health) was used. For this, the Cell Counter plug-in of ImageJ was used to count the number of dendritic cells in the entire frame (160 000 μm 2 ). The average count of 3 different IVCM images was then calculated and expressed as cells/mm 2 . To measure subbasal nerve density, the nerves were traced using NeuronJ software ( http://www.imagescience.org/meijering/software/neuronj/ ), which is a semi-automated nerve analysis plug-in program of ImageJ. Nerve density was measured by tracing all visible nerve fibers in the image and calculating the length of the nerve fibers in millimeters. Then, the average nerve density of 3 different IVCM images was calculated and expressed as mm/mm 2 . All measurements were performed by 2 independent observers and the average values were used for the analysis.
Statistical Analysis
Statistical analysis was performed with SPSS version 20 (SPSS Inc, Chicago, Illinois, USA). The normality of the data was first assessed using the Shapiro-Wilk test. Owing to non-normal distribution of the data, the Mann-Whitney U test was used to compare the age between the DED and control groups. To compare the densities of endothelial cells, nerves, and dendritic cells between the groups, mixed model analysis was used to compensate for including both eyes of each individual. The confounding effect of age was also considered in this model. Furthermore, the correlations between the ECD and the clinical parameters were investigated using the Spearman test. To correlate the ECD with the OSDI scores in the DED group, the ECD values of both eyes were averaged. P values of less than .05 were considered statistically significant.
To determine the sample size, a pilot study was performed on 66 eyes with DED and 20 eyes of normal subjects. The ECD was found to be 2633 ± 399 cells/mm 2 in the DED group and 2866 ± 367 cells/mm 2 in the control group. Therefore, a difference of 233 with an average standard deviation of 383, a 0.05 2-sided significance level, and 80% power were used to calculate the study sample size, which resulted in 116. Thus, for our study a sample size of 120 eyes was employed, which were divided between the DED and the control groups in a ratio of 3:1.
Results
This study included 90 eyes of 45 patients with DED (28 women and 17 men, mean age: 53.7 ± 9.8 years, range: 34–71 years) and 30 eyes of 15 subjects in the control group (8 women and 7 men, mean age: 50.7 ± 9.8 years, range: 25–64 years). There were no significant differences found between the 2 groups in terms of age ( P = .15) or sex ( P = .40). Patients with DED had a mean OSDI score of 61.5 ± 20.8, a mean score for corneal fluorescein staining of 7.0 ± 3.4, a mean lissamine green staining score of 2.0 ± 2.9, a mean TBUT of 3.2 ± 2.8 seconds, and a mean Schirmer score of 6.7 ± 6.8 mm.
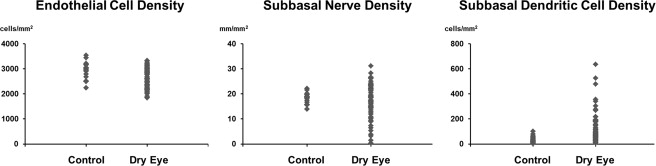
Mixed-model analysis demonstrated that after adjustment for age the mean ECD was significantly lower in the DED group (2595.8 ± 356.1 cells/mm 2 ) than in the control group (2812.7 ± 395.2 cells/mm 2 , P = .046, Figure , Left). In addition, nerve density in the subbasal layer was significantly lower in the DED group (17.1 ± 6.9 mm/mm 2 ) than in the control group (24.7 ± 4.4 mm/mm 2 , P < .001, Figure , Middle). There was also a significantly higher density of subbasal immune dendritic cells in the DED group (111.7 ± 137.3 cells/mm 2 ) than in the control group (32.0 ± 24.4 cells/mm 2 , P = .002, Figure , Right).