2
Principles of Audiology and Auditory Physiology
David K. Brown and Robert W. Keith
The physiology of the auditory system is complex, and our understanding of how the system works is not yet complete. Chapter 1 discussed the anatomy of the auditory system, but a complete understanding of the auditory system also requires knowledge of the nature of sound and the function of the structures. Only with this comprehensive understanding can we have the greatest impact on patients with hearing loss.
The complex nature of the auditory system has been observed, studied, and debated since the days of George Berkeley and his tree falling in the forest, and we are still acquiring new knowledge about the auditory system. In fact, a large part of what we know was learned only since World War II, when many men returned home after the war with hearing loss. Audiology, the study of hearing, was born in the 1940s and the profession of audiology is dedicated to the detection, evaluation, and rehabilitation of patients with hearing disorders.
This chapter discusses the nature of acoustics and the way sound can be described and measured. The physiology of sound, which is the input to the auditory system, is discussed as it traverses through the outer, middle, and inner ear to the brain.
 Acoustics
Acoustics is the science that is concerned with the production, control, transmission, reception, and effects of sound. Sound is energy, mechanical radiant energy that is transmitted through pressure waves in a material medium (e.g., air, water, metal). In the case of hearing, sound is the sensation perceived by the ear. This sound energy is captured by the outer ear, transformed by the middle ear, and transduced by the inner ear. Sound is described in terms of its basic physical attributes: frequency, intensity, and time/phase of the vibration.1 These physical attributes also have psychological correlates, which are pitch, loudness, and quality, respectively. These terms are often used interchangeably, thus leading to misunderstanding and misuse, which is especially true for frequency and intensity.
People often mistakenly refer to the pitch of a tone when they really mean its frequency and to the loudness of a tone when they mean its intensity. The pitch of a tone is perceived by the listener, whereas one can quantifiably measure the frequency of the same tone with an oscilloscope. A tone with a frequency of 1000 Hz may fluctuate in frequency by a few hertz (cycles per second) either up or down over a period of time, which can be measured by the oscilloscope. However, the normal-hearing listener is not able to perceive such small changes in pitch. Changes in pitch are what we detect when the frequency of a tone changes and are measured in a unit called the mel. There is little correlation between the two except that mels increase and decrease with frequency. For example, when we play the scale on the piano from middle C (256 Hz) to the C above middle C (512 Hz), we are moving up an octave; every time we move up an octave, the frequency doubles. However, as we move from one C to the next C the units on the mel scale do not double2 because pitch, although highly correlated with frequency, is subjective and influenced by both the frequency and the intensity of the sound.
Loudness is the psychological correlate of intensity. Changes in the intensity of a sound may or may not result in a perceived change in loudness. Loudness is a subjective analysis of the sound by the listener. It is affected by the duration and frequency of the sounds that are present, and a unit of loudness level is the phon. The smallest change in a physical parameter of sound (such as frequency or intensity) that results in a perceived change (of pitch or loudness) is called a just noticeable difference (JND).
Frequency
A single-frequency sound, or pure tone, is the standard used in the assessment of auditory sensitivity (threshold). Frequency is a physical attribute of a sound and is defined as the number of cycles per unit of time. For example, if a metronome were to move back and forth 1000 times in 1 second, it would have 1000 cycles per second. One cycle, therefore, is defined as one complete event and has occurred when a particle has completed all its variations, returned to its original point of rest, and is about to begin the same variations again. Although measured in cycles per second, frequency is reported in hertz (Hz). As in the above example, the result would be a 1000-Hz tone because it completed 1000 cycles per second. A sound can be visualized in the time domain, as shown in Fig. 2–1, which describes tones of different frequencies.
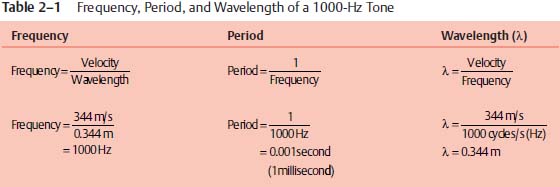
Period refers to the amount of time it takes for one cycle to occur; therefore, period is the reciprocal of frequency (period = 1/frequency). This 1000-Hz tone would have a period of 1/1000 seconds. Wavelength (λ) is the distance sound travels in one period and is reported in centimeters, feet, or miles, depending on how the velocity is recorded. Velocity is the speed in which the sound travels from the source to a distant point and is determined by the density of the medium. Because sound is transmitted mainly through the air, the velocity would be 344 m (or 1130 feet) per second. Therefore, wavelength is the speed at which the sound travels divided by the frequency of the sound (λ = velocity/frequency). Given a 1000-Hz tone, the period and the wavelength can be computed, as shown in Table 2–1.
A single-frequency sound is a simple sound or pure tone. However, sounds in the real world are seldom simple and are made of more than one frequency; these are called complex sounds. If the variations of a sound are repetitive over time, the sound is periodic. Both simple (pure tones) and complex (voice) sounds may be periodic. Sounds that are not repetitive over time are aperiodic (e.g., noise).
Noise is defined as an aperiodic, complex sound. There are several types of noise, such as white noise, speech, and narrow-band noise. White noise is a broadband noise that is complex and aperiodic. Its name is derived from the fact that it contains all the frequencies in the audible spectrum, randomly distributed, just as white light contains all the colors of the visual spectrum. White noise is not often used in audiometry as it is too broad in its spectrum. However, the other noises, speech and narrow-band noise, are derived from this white noise with a narrower band or frequency response than white noise.
Speech noise refers to a band of noise that has had the frequencies above and below the speech frequencies (300 to 3 kHz) filtered out. Speech noise is most often used for masking during speech audiometry. Narrow-band noise (NBN) is actually white noise with certain frequencies (above and below a given center frequency) filtered out. The result of the filtering is a frequency range of noise smaller than broadband white noise but broad enough to effectively mask the tested frequency. NBN is most often used for masking in pure-tone testing.
Intensity
The number of times an object vibrates determines its frequency, but how far the object moves determines its intensity. Intensity or amplitude then becomes another physical attribute of sound. Intensity relates to the strength of a sound as shown in Fig. 2–2; the distance a mass moves from the point of rest is the amplitude of the sound. Intensity is usually measured in decibels (dB), after the renowned Alexander Graham Bell. There are five descriptors of the decibel; it is (1) a relative unit of measure, (2) a ratio, (3) logarithmic, (4) nonlinear, and (5) expressed in terms of various reference levels.2 An often-overlooked aspect of the decibel is that it is a relative unit of measure that needs to be described with a reference or it loses its meaning. For example, dB SPL is related to sound pressure level, dB HL is related to hearing level, and dB SL is related to the sensation level, where the tone is presented at above that amount above the threshold. The use of the term dB without a referent is meaningless and should be avoided.
In the simplest terms, the decibel represents a difference between two sounds: a referent and the sound being described. The formula for dB (pressure) is dB = 20 log R, where R is the ratio between the referent and a given sound. For example, if we were discussing a sound that was the same pressure as the referent (i.e., dB = 20 log 0.0002 μPa/ 0.0002μ, where the referent is 0.0002μ), the ratio equals 1, and the log of 1 = 0. Therefore, 20 × 0 = 0 dB, and 0 dB means that there is no difference between the two sounds—our sound and its referent. It is also important to be aware that the decibel represents a logarithmic series, not an interval series. Therefore, in pressure measurements, a 20-dB step represents a 10-fold increase (i.e., a ratio of 10:1) and a 40-dB step represents a 100-fold increase; a 60-dB step represents a 1000-fold increase, and so forth. For example, people attending a rock concert where the level of the sound is 140 dB SPL (2000 dynes/cm2) are exposed to 1000 times more pressure than they should be exposed to if the safe level is 80 dB SPL (2.0 dynes/cm2).
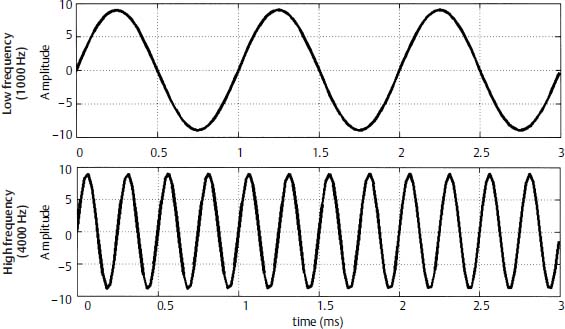
Figure 2–1 Graphs of two sine waves of different frequencies plotted over time. The top graph is a low frequency (1000 Hz) and the bottom is a 36 higher frequency (4000 Hz) as denoted by the number of cycles in the same time window.
The basic acoustical measurement that is used for almost all acoustic measures is the sound pressure level (SPL). This measure is independent of frequency and has a referent of 0.0002 dyne/cm2 (or 0.0002μ). This referent was determined in the Bell Laboratories many years ago and has stood the test of time. It remains the basic referent for all acoustic measures, but, unfortunately, very few people are able to detect a sound at 0 dB SPL. Therefore, a different system had to be set up using SPL as a referent and criteria ascertained from several studies of auditory sensitivity in humans. The American National Standards Institute (ANSI) in 1969 issued the standard for audiometric zero.
Audiometric zero is frequency-specific and indicates that auditory sensitivity in humans is poorer at lower frequencies (125 Hz) and higher frequencies (8000 Hz) than it is in the midfrequencies (500 to 4000 Hz) range as shown in Table 2–2. When audiometric zero is the referent, the designation is hearing level (HL); thus, when indicating a decibel measurement the method of measurement (i.e., SPL or HL) is very important. The use of dB HL instead of dB SPL allows the hearing threshold for normal individuals to be calibrated to audiometric zero across all frequencies (despite normal auditory sensitivity being better for the middle frequencies of the test range).
As previously noted, dB sensation level (SL) refers to any measurement that is above an individual’s threshold. This term is both frequency-specific and individual-specific. If someone is tested at 30 dB SL, this means he or she was tested at 30 dB above his or her threshold for that particular frequency or for speech. Because the decibel is a measurement based on a referent, it is possible to move back and forth between dB SPL, dB HL, and dB SL. For example, at 250 Hz, a sound is to be presented to a patient at 35 dB SL. The patient’s threshold is 40 dB HL. What is the level of presentation in dB SPL? We know from Table 2–2 that the 0 dB HL is 25.5 dB SPL; thus the dB SPL equivalent of 35 dB SL is 100.5. Because all of the units are mathematically related, it is possible to convert from one to another.
Phase
The phase of a sound refers to the relative timing of sound waves. It is simplest to refer to the starting phase of the signal; therefore, at time zero the point of the sine wave where the signal begins will be the starting phase as shown in Fig. 2–3. This will act as a referent point for other waves. Two tones of the same frequency that begin 180 degrees out of phase will cancel each other out.
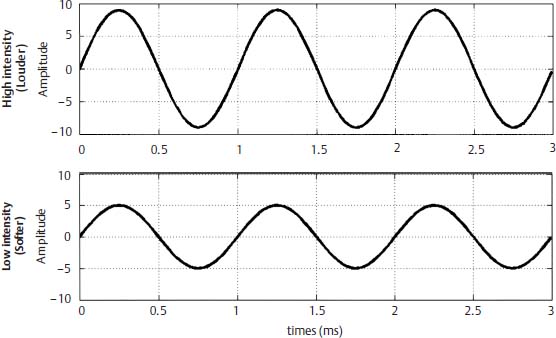
Figure 2–2 Graphs of two sine waves of the same frequency (1000 Hz) but different intensities plotted over time. The tones have the same cycles per second but differ in the amplitude of the waves.
| Frequency (Hz) | Standard Earphore (TDH 39) | |
|---|---|---|
| 125 | 45.0 | |
| 250 | 25.5 | |
| 500 | 11.5 | |
| 750 | 8.0 | |
| 1000 | 7.0 | |
| 1500 | 6.5 | |
| 2000 | 9.0 | |
| 3000 | 10.0 | |
| 4000 | 9.5 | |
| 6000 | 15.5 | |
| 8000 | 13.0 | |
In a complex sound, that is, one that has more than one frequency, the lowest frequency in that sound is called the fundamental. The fundamental frequency of a complex, periodic sound is the frequency at which the source vibrates. All frequencies above that are called overtones. Frequencies that are multiples of the fundamental are called harmonics and those that are not multiples are called aharmonics.
Resonance refers to the phenomenon whereby one body can be set into motion by the vibration of another body. If a given area has a “resonant frequency,” then that frequency is amplified when it is presented in that area. In other words, there is an increase in the intensity of that signal because the surface of the area with the resonant frequency vibrates at the particular frequency that has been presented and therefore increases its intensity. The fundamental frequency of the voice is the slowest rate at which the vocal folds vibrate for a given “voiced” sound. There may be several overtones imposed by the inertial effect of the vibrating vocal folds.
Differences in the sounds that come out of the vocal mechanism are caused by changing the resonating cavities above the vocal folds. Complex sounds may be described in terms of spectra. The spectrum of a sound identifies the frequencies and the relative amplitudes of the various components of a sound.
 Physiology of Hearing
The anatomy of the auditory system was addressed in Chapter 1. This chapter traces the course of the auditory stimulus from its generator to the auditory cortex, as shown in Fig. 2–4
Stay updated, free articles. Join our Telegram channel

Full access? Get Clinical Tree


